Technical Analysis of Gold for April 13, 2016
Gold price reversed yesterday after reaching the important resistance of $1,260. I warned Gold bulls that this is not good to be long now. There were many warnings for bulls and today we see the results.

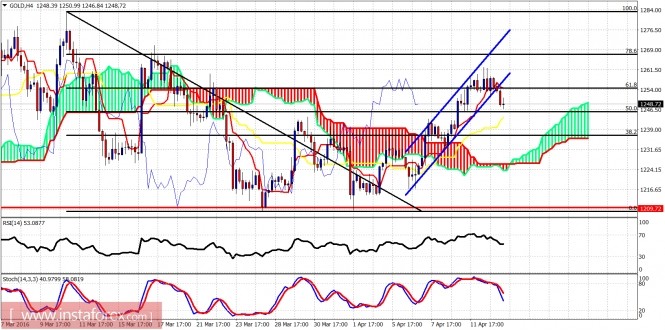
Blue lines - bullish channel (broken)
Gold price broke out of the bullish channel. Price was rejected at the 61.8% retracement. This is a bearish sign. Combined with the bearish divergence signs, I pointed out in our previous posts, price has started moving lower at least towards $1,230.

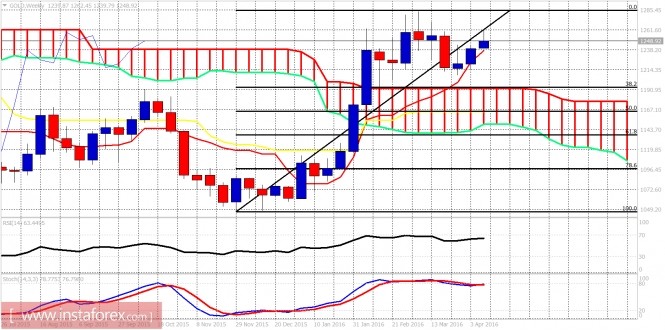
The week started on a bullish note but I believe we will see a bearish reversal weekly candle and a break below the tenkan-sen (red line indicator). I expect a move at least towards the 38% Fibonacci retracement and the upper cloud boundary. I remain bearish in the short term .
The material has been provided by InstaForex Company - www.instaforex.com


