Technical Analysis of EUR/GBP for March 15, 2016
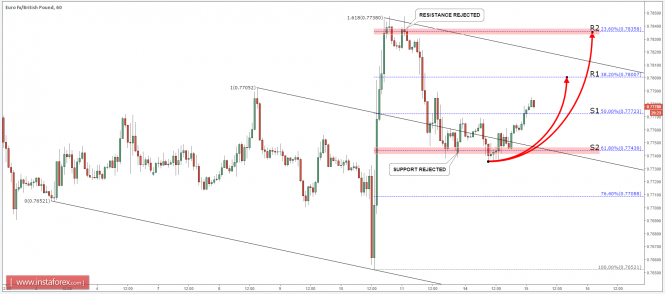
On March 10, after the news release, EUR/GBP sharply surged, breaking above the descending channel. The rise stopped, once the price tested the strong support level of 0.7835 (R2), which is 23.6% Fibonacci applied to the channel breakout point.
At the same time, the price bounced off the 1.618% of the Fibonacci channel, thus confirming the resistance one again. After resistance had been rejected, the price corrected down and found the support at S2 (61.8% Fibs). It is clear that the price has stuck between support S2 and resistance R2.
After such actions, the trading range is expected where the current wave up is likely to continue to test either R1 (.7800) or R2 (0.7835) once again.
Consider looking for buying opportunities on pullbacks between S1 and S2, targeting either R1 or R2. The stop loss should be placed just below the most recent low (0.7735)
Support: 0.7740, 0.7770
Resistance: 0.7800, 0.7835

The material has been provided by InstaForex Company - www.instaforex.com


