Daily Analysis of GBP/USD for March 15, 2016
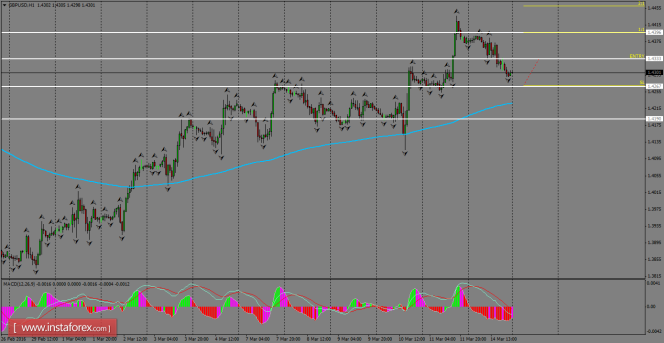
GBP/USD seems to be trading inside a corrective move towards the support level of 1.4267, where a rebound should happen to resume the bullish bias. The H1 chart is still pointing to the upside and the pair can perform a breakout above the level of 1.4396, in order to reach new highs. The MACD indicator is entering oversold territories, so it is highly possible to see further rebounds.

H1 chart's resistance levels: 1.4333 / 1.4396
H1 chart's support levels: 1.4267 / 1.4190
Trading recommendations for today: Based on the H1 chart, place buy (long) orders only if the GBP/USD pair breaks a bullish candlestick; the resistance level is seen at 1.4333, take profit is at 1.4396 and stop loss is at 1.4271.
The material has been provided by InstaForex Company - www.instaforex.com


