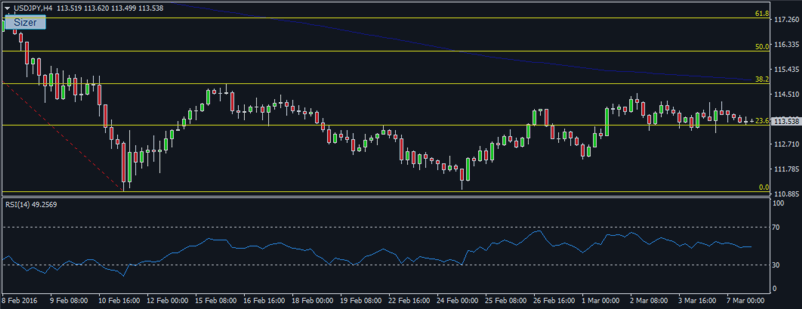
The USD/JPY 4 hour chart shows the price has been range trading between the 23.6% fibonacci line and the 38.2% fibonacci line. The price is currently sitting on the 23.6% fibonacci retracement.
The 38.2% line is a very strong resistance mark, it is right next to the 200 EMA which is a common support or resistance line. Therefore, a move upward will initially target the 38.2 line. If there is a lot of momentum then it could be possible for the price to reach the 50% retracement.
However, if the current support line at 23.6% line is broken then this will open the chart up to enable the pairing to eye up the 0% fibonacci retracement at 111.00. Any move will need a very strong confirmation before entering either long or short as the price is very flat at the moment and no clear direction has been established.
see www.plusfxtrading.com for more analysis.


