Gold Prices: Higher-Low Sets Top-Side Trend Re-Entry
To receive James Stanley’s Analysis directly via email, please sign up here.
Talking Points:
- Gold Technical Strategy: Final target cleared, long conditional setup from previous article not triggered; new long setup identified.
- Gold has continued to see heavy volatility, and this will likely remain as such until a clearer trend develops in USD.
- If you want to see positioning and sentiment changes in Gold, check out our Real-Time SSI. It’s free.
It’s been quite the ride for Gold. It’s not often that you’ll see a price target eclipsed by over $100 in a few days, but that’s what happened last week in Gold. The final target on the previous setup was at $1,161, and Gold ran all the way up to $1,263 in very short order. The big driver here was the threat of negative rates out of the United States, as Chair Yellen’s testimony in front of Congress appeared to be the major driver ofGold prices. In six trading days, Gold prices shot all the way from $1,155 to that $1,263 high; and in the four trading days since that high was set, prices have retraced over $73 of range.
So, Gold is still very much volatile, and that primary driver will likely be the prospect of continued monetization and the prospect of further negative rates around the world. Given the brutally abysmal reaction that financial markets have had to negative rates, at least since the Bank of Japan initiated them, the negative rate argument in financial markets may be short lived. But the fact of the matter is that the Fed is facing mounting issues surrouding those four rate hikes in 2016. At this point, markets aren’t pricing in any hikes for this year, and again that big driver was Chair Yellen’s testimony last week. So, these themes may continue.
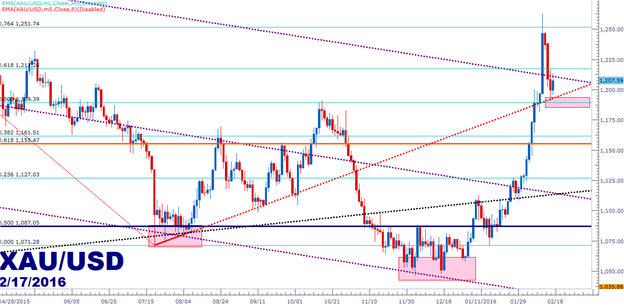
That run in Gold last week was significant: Gold prices broke above the 2+ year downward channel. There was a brief top-side breech in March of 2014, but other than that – resistance on this channel remained unfettered until last week (shown in purple on the below chart). And on the topic of trend-lines, we may have had an old one just peak out as new support, as you can see the projected trend-line in red on the below chart. This can be found by connecting the lows in July and August of last year and projecting the level to near-term price action.
Traders can look to get long to play continuation in this move in Gold. Traders looking to treat the move more aggressively can look to lodge stops below that $1,189 level, as this was the 50% Fib retracement of the prior major move. For those that want to take the setup a little more conservatively, they can look to get stops below last Wednesday’s low, as that was an inflection point on this trend-line projection. That would put the stop below $1,180 to take on ~$30 of risk with current prices.
On the target side, traders can look to the $1,225 area, as that had provided a swing low shortly after that fresh-high was hit. This can potentially come in as new resistance and this could be an ideal area to take off some risk. After that $1,251.74 becomes an area of interest, as this is the 76.4% retracement of the prior major move, followed by $1,283.82, which is the 38.2% retracement of the primary major move, taking the 1999 low to the 2011 high. After that, the next big level is in the $1,300 area, as this was the 2015 high as well as being near the 50% retracement of the secondary move in Gold, taking the 2008 low to the 2011 high.


