
DAX Index Long-Term Technical Analysis: breaking key resistance for the bullish trend to be continuing
2 December 2015, 18:11

0
858
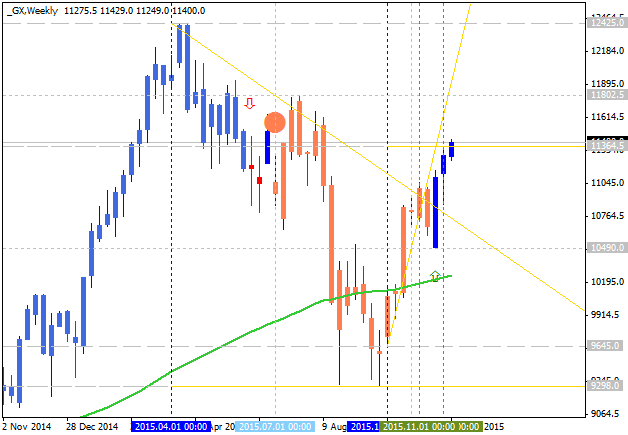
The price is located above 100 period SMA (100 SMA) and 200
period SMA (200 SMA) with the ranging within the following
support/resistance levels:
- 12425 resistance level located far above 100 SMA and 200 SMA in the primary bullish area of the chart, and
- 9298 support level located within 100 SMA/200 SMA on the border between the primary bearish and the primary bullish trend.
RSI indicator is estimating the primary bullish to be continuing.
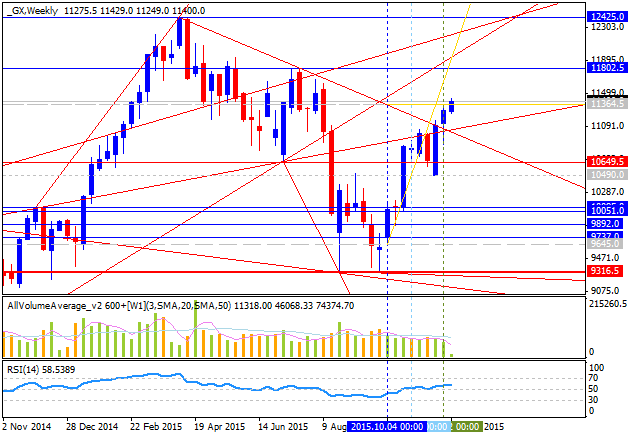
- If the price will break 12425
resistance level so the bullish trend will be continuing.
- if price will break 9298 support so the bearish reversal will be started with the secondary ranging.
- if not so the price will be ranging within the levels.
| Resistance | Support |
|---|---|
| 11802 | 10490 |
| 12425 | 9298 |


