The most interesting pair you can make money with - USD/TRY (US Dollar/Turkish Lira): breakout with reversal
27 November 2015, 12:11
0
1 707
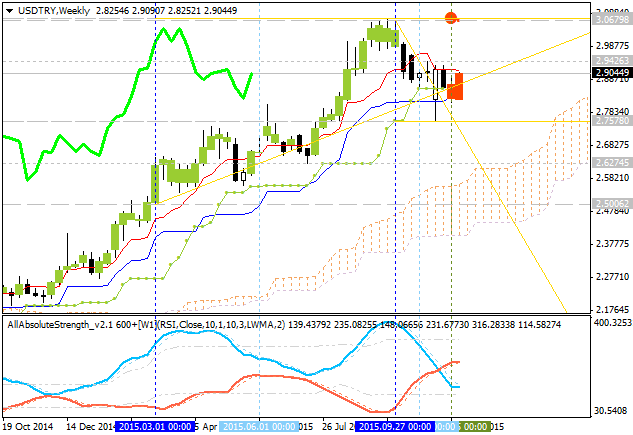
USD/TRY: daily breakout with bullish reversal; weekly ranging bullish. Weekly price is located to be above Ichimoku cloud in the primary bullish area of the chart. 'Reversal' Sinkou Span line (as the border between the primary bullish and the primary bearish on the chart) is located far below the price which makes the bearish reversal to be unlikely in the coming weeks. The price is ranging within the following key support/resistance levels:
- 3.0679 resistance level, and
- 2.7578 support level located.
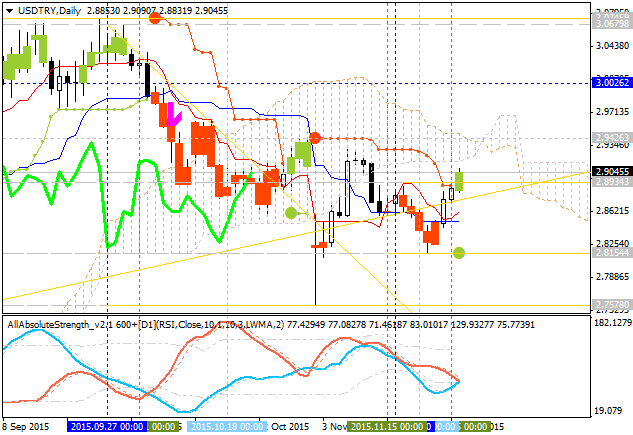
Daily price. This is the most interesting situation we may have on daily chart for this pair:
- Chinkou Span line is ready to break the price from below to above for good possible breakout in the near future.
- The price is breaking Ichimoku cloud to be reversed to the bullish market condition
- Absolute Strength indicator is estimating the bullish condition in the near future.
- The nearest real bullish targets are 2.9426 level, 3.0026 level and 3.0679.

There are 3
simple scenarios for the price movement for the coming weeks:
- daily price will be reversed to the bullish market condition and weekly price will break symmentic triangle pattern in case the daily price breaks 2.9426 resistance on close bar with 3.0679 as the nearest target in this case,
- weekly bullish trend will be continuing in case the close weekly price breaks 3.0679
resistance from below to above,
- or the ranging within the levels.

| Resistance | Support |
|---|---|
| 2.9426 | 2.8154 |
| 3.0679 | 2.7578 |
| N/A | 2.5006 |


