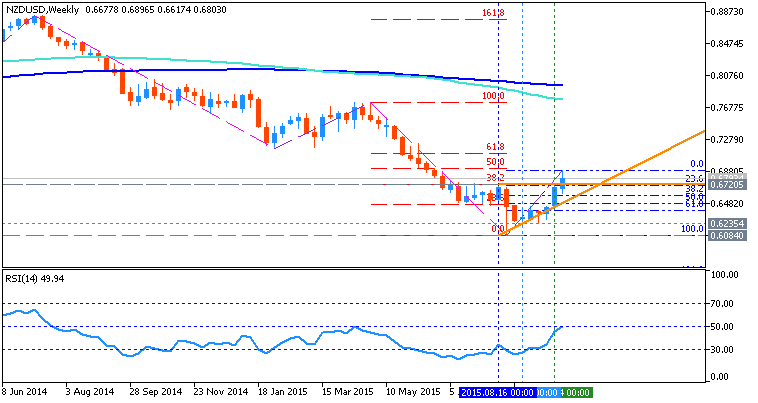
NZDUSD Next Month Outlook - breaking ascending triangle pattern for the rally to be started
20 October 2015, 15:11
0
1 146
W1 price is located below 200 period SMA
and below 100 period SMA for the primary bearish market condition. The price is breaking ascending triangle pattern from below to above with Fibo resistance level at 0.6892 as the next target:
- "NZD/USD triggered a short term double bottom and blew through the target. Given the long term picture, dips should be bought. There probably isn’t solid resistance (as in a place that could cap the bird for at least several weeks or more) until near .70."
- ".70 represents channel resistance and the 200 day average."
If the price will break Fibo support level at 0.6084 so the bearish trend will be continuing.
If the price will break Fibo resistance level at 0.6892 from below to above so we may see the secondary bear market rally will be started.
If not so the price will be ranging between the levels.

Trend:
- W1 - bear market rally to be started


