Current trend
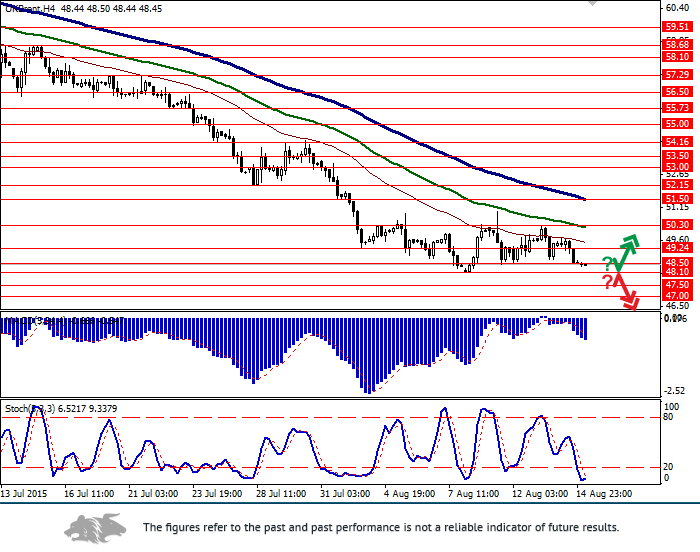
In the end of last week, the price of Brent crude oil resumed its fall amid the growing USD.
Last week, the USD significantly declined due to the Yuan devaluation in China, which increased the concerns regarding an anticipated interest rate hike in the US in September. However, despite the USD weakness, the pair could not show any substantial growth.
The downward trend for oil remains very strong and there are no reasons to for its reverse. According to the IEA, a disbalance between supply and demand is going to stay in 2016.
Support and resistance
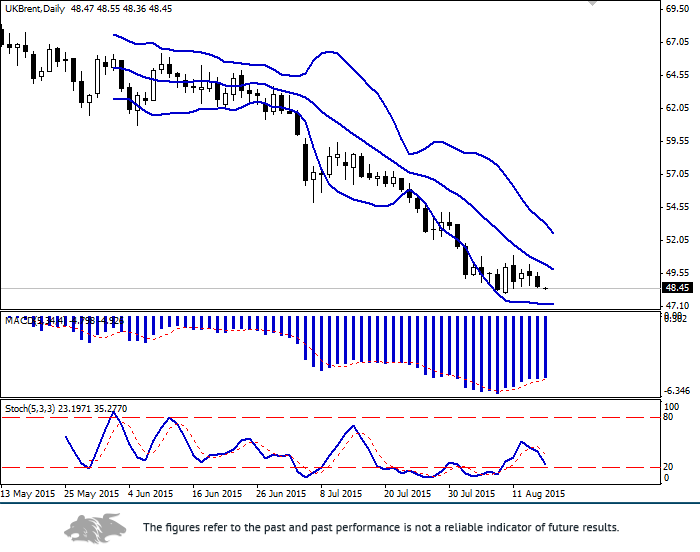
Bollinger Bands on the daily chart is falling and the price range is narrowing. MACD is slowly growing and giving a weak buy signal. Stochastic has turned down and is approaching the oversold zone.
The indicators recommend closing long positions and consider opening short positions in the short-term.
Support levels: 48.50 (local low), 48.10 (10 August low), 47.50, 47.00 (psychologically important level).
Resistance levels: 49.24, 50.30 (the upper border of the sideways channel), 51.50, 52.15, 53.00, 53.50, 54.16 (29 July high), 55.00.
Trading tips
Open short positions after the breakdown of the level of 48.10 with the target at 47.00 and stop-loss at 49.24.
Long positions can be opened after the price rebound from the levels of 48.10, 48.50 (with the appropriate indicators signals) with targets at 50.00, 50.30 and stop-loss at 47.50.


