Crude Oil Technical Analysis At Year-End: 45.17 as a real valid target
10 July 2015, 09:11
0
971
Let's provide simple forecasting to crude oil at year-end using simple
technical analysis tools:
- support and resistance lines, and
- Simple Moving Averages indicator (which is standard indicator in Metatrader 4 and Metatrader 5)
As
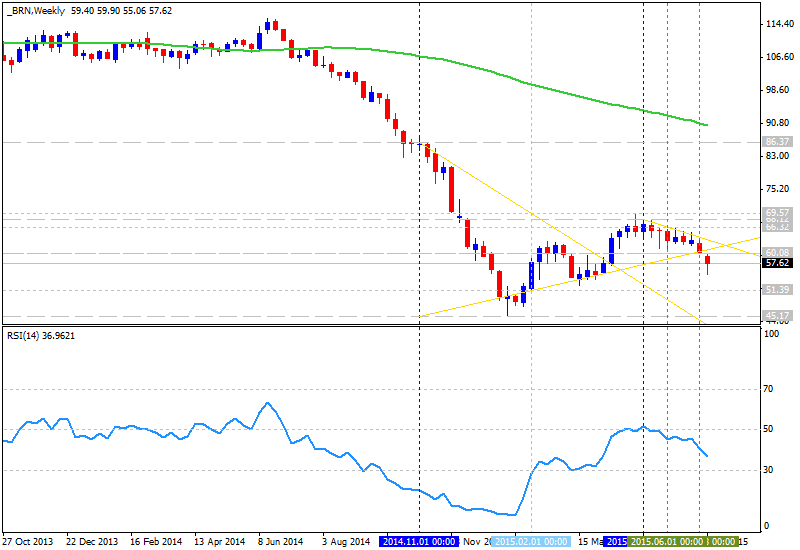
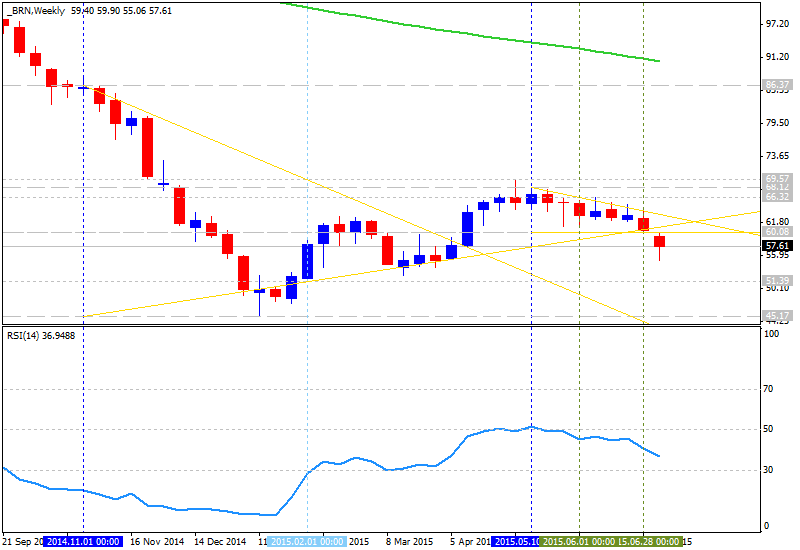
we see from the charts below (W1 timeframe and MN1 timeframe for
EUR/USD) - 45.17 is the key support level for for both
timeframes. On W1 timeframe - the price is located below 100 SMA and
below 200 SMA for primary bearish market condition, and triangle pattern was broken by close weekly price from above to below for the bearish trend to be continuing. nearest support level is 51.39 and the next one is 45.17.
MN1 timeframe: the price is breaking triangle pattern for downtrend with key support level as 45.17.
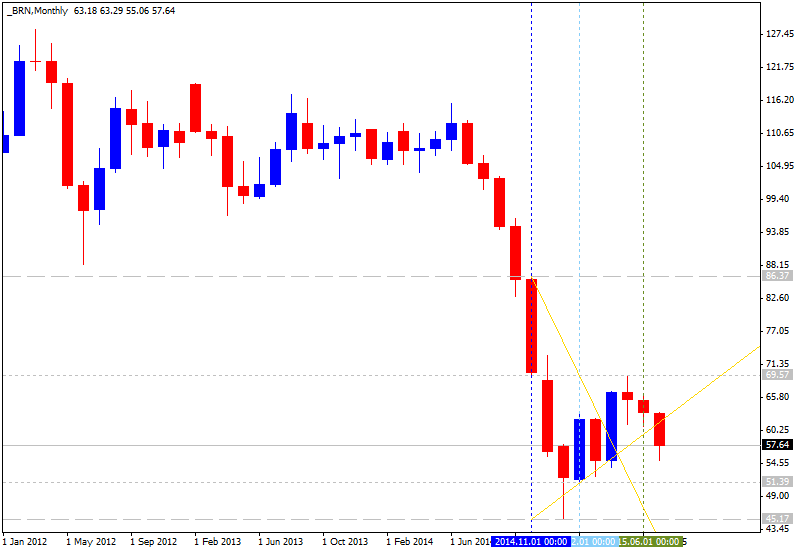
So, we can prove that 45.17 is the real target for crude oil at year-end.

