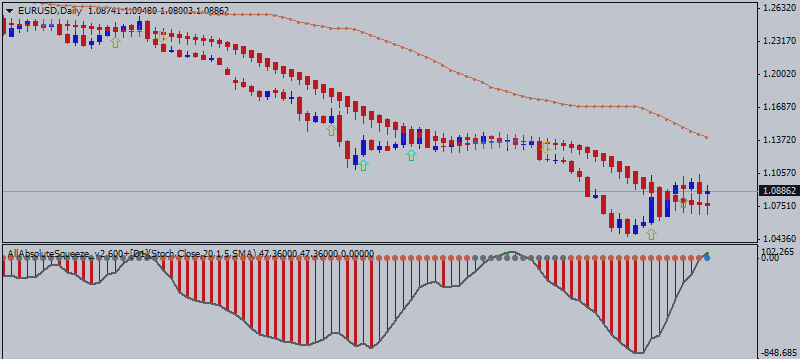

But Heikin-Ashi candles are different and each candle is calculated and plotted using some information from the previous candle:
1- Open price: the open price in a Heikin-Ashi candle is the average of the open and close of the previous candle.
2- Close price: the close price in a Heikin-Ashi candle is the average of open, close, high and low prices.
3- High price: the high price in a Heikin-Ashi candle is chosen from one
of the high, open and close price of which has the highest value.
4- Low price: the low price in a Heikin-Ashi candle is chosen from one
of the low, open and close price of which has the lowest value.
So candles of a Heikin-Ashi chart are related to each other because the open price of each candle should be calculated using the previous candle close and open prices, and also the high and low price of each candle is affected by the previous candle. So a Heikin-Ashi chart is slower than a candlestick chart and its signals are delayed.
So the Heikin-Ashi chart is delayed and the candlestick chart is much
faster and helps us to make more profit. Why should we use a Heikin-Ashi
chart then? As it was already explained, because of the delay that the
Heikin-Ashi chart has, it has less number of false signals and prevent
us from trading against the market. On the other hand, Heikin-Ashi
candles are easier to read because unlike the candlesticks they don’t
have too many different patterns.
There are many Heiken Ashi indicators (and EA) on MT5 CodeBase, for example :
Trading signals module based on Heiken_Ashi_Smoothed indicator
Heiken_Ashi_Smoothed_HTF_Signal
========
An Example of a Trading System Based on a Heiken-Ashi Indicator
Heiken Ashi based EA

