Technical Analysis for US Dollar, S&P 500, Gold and Crude Oil - Gold Finds Support, Crude Oil Rally May Fail Near $59

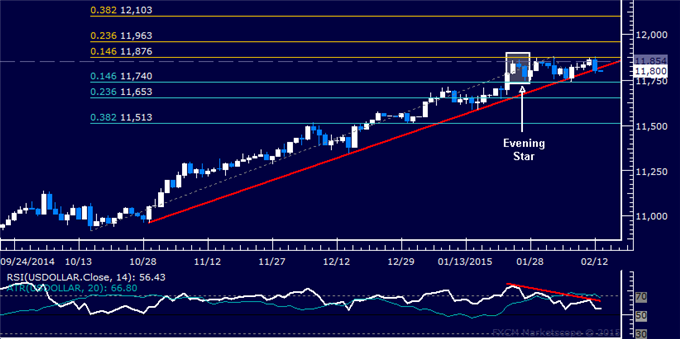
US DOLLAR TECHNICAL ANALYSIS
Prices may have finally started to
turn lower as expected following the appearance of a bearish Evening
Star candlestick pattern. Near-term support is at 11740, the 14.6%
Fibonacci retracement, with a break below that on a daily closing basis
exposing the 23.6% level at 11653
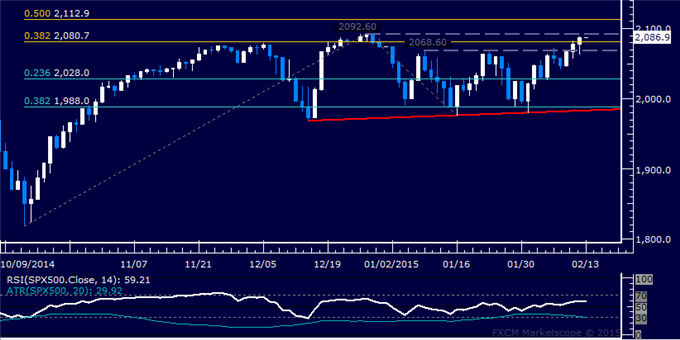
S&P 500 TECHNICAL ANALYSIS
Prices edged above resistance at
2080.70, the 38.2% Fibonacci expansion, to expose the December 29 high
at 2092.60. A break above that on a daily closing basis exposes the 50%
level at 2112.90.
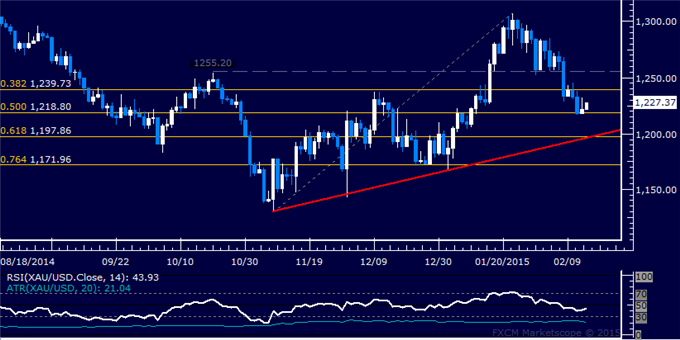
GOLD TECHNICAL ANALYSIS
Prices are testing support at 1218.80,
the 50% Fibonacci retracement, with a break below that on a daily
closing basis exposing the intersection of rising trend line support and
the 61.8% level at 1197.86. Alternatively, a reversal above the 38.2%
Fib at 1239.73 aims for the October 21 high at 1255.20.
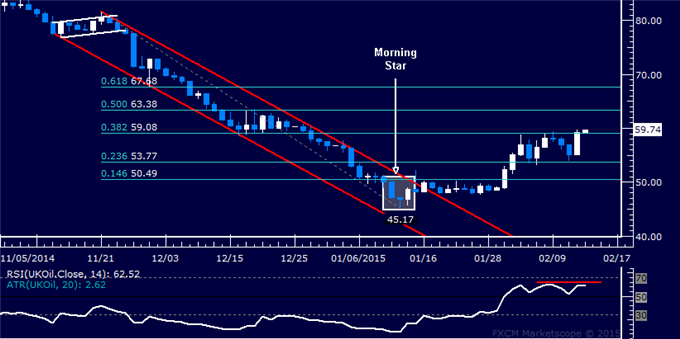
CRUDE OIL TECHNICAL ANALYSIS
Prices continue to push higher as
expected, with a narrow breach of the 38.2% Fibonacci retracement at
59.08 exposing the 50% level at 63.38. A further push beyond that
targets the 61.8% Fib at 67.68. Negative RSI divergence wars of fading
upside momentum however, hinting a turn downward may be ahead. A
reversal back below 59.08 aims for the 23.6% retracement at 53.77.