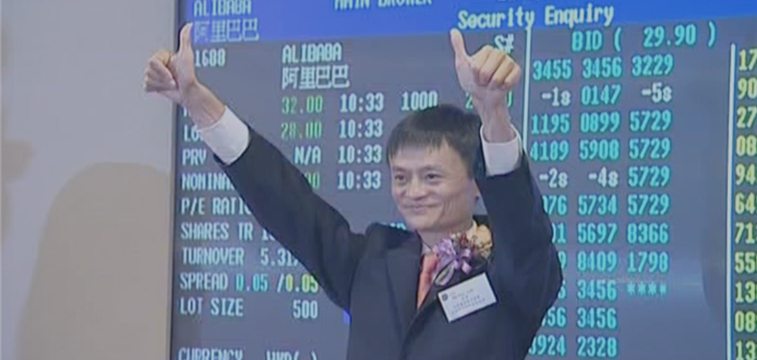
Alibaba (BABA) is going to become the United States largest initial public offering (IPO), and U.S. stock market indexes are up nearly 2% this week
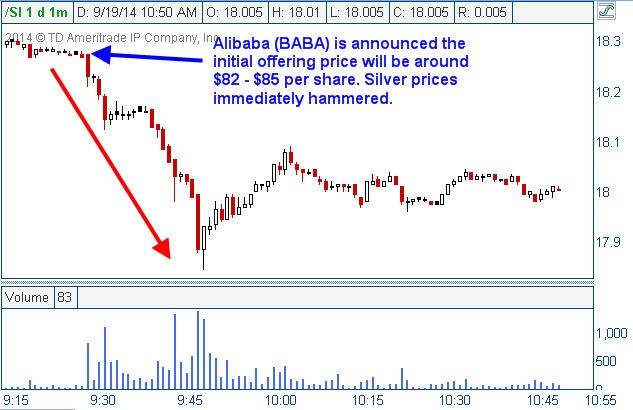
While U.S. financial prognosticators are raving over Alibaba and the IPO, the price action in precious metals and in the broader U.S. equity indexes showed signs of weakness about the time it was announced that Alibaba could start trading in the low to mid eighties.
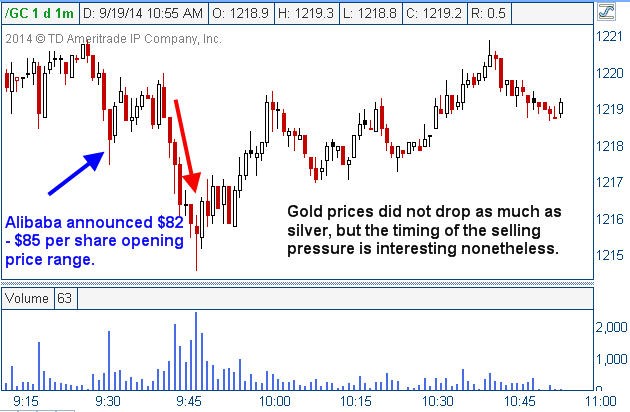
The chart below shows gold futures prices during the same time frame as the silver chart above.
In silver, the selling pressure started around July 15th of
this year and the selling has not stopped. Silver futures prices dropped
from roughly $21.50 to $18.50 an ounce in about two months. This
represents a near 14% decline in the price of silver over the past 2
months.
Gold prices have also seen strong selling over the same period from July 15th
to present. Gold prices fell from around $1,340 per ounce to a recent
low slightly below $1,220 per ounce. Gold prices dropped nearly 9%,
showing some strong relative strength against silver futures.
The daily chart of gold futures is shown below:
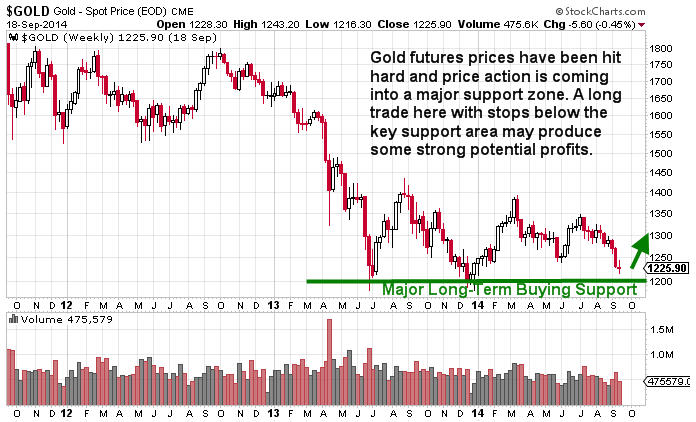
The $1,180 – $1,200 price level has shown major support for gold futures
prices which is clearly depicted on the weekly chart of gold futures
shown above. We are contrarian traders and the price action in precious
metals is ripe for a potential bounce. We view the opportunity more as a
trading opportunity than an investment opportunity for now, but that
could change in the longer term.

