

This is difficult just because there is so much of it. Many very bright young people will spend their entire lives studying economics and even then, they realize that the field is a very inexact science.
The shortest distance between two points is a straight line, and for most traders that straight line draws directly from technical analysis.
The first few indicators learned are often the basics. The moving average is often the first one learned because it is so simple; and then after that traders will usually move towards slightly more advanced, yet still ‘basic’ indicators.
These traders will learn how the indicator can work, and may even place a few trades based on that indicator. This story almost always ends the same way as these new traders realize that the indicator doesn’t ‘always’ work, so they discard that one and move on to more advanced studies. This is a very unfortunate mistake.
Relative Strength Index
RSI is probably the most discarded indicator on the planet earth. While moving averages are often the first indicator learned, RSI usually follows closely thereafter. And after careful examination, traders will often realize that RSI (like any other indicator) isn’t always right. So they’ll often discard it, and move on to investigate other indicators (which all have the same issue of not being perfectly predictable).
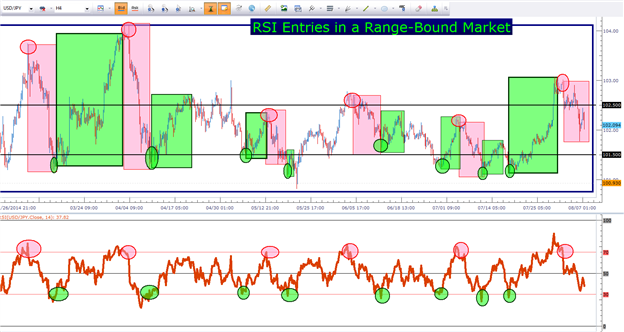
RSI, like any other indicator, has pluses and minuses. RSI can work fantastic in a range as an entry indicator; and traders can use this to trade swings in range-bound market conditions.
Traders can look to use RSI in the default manner, investigating short signals when the indicator crosses down and through ’70,’ under the presumption that the market may be leaving ‘overbought’ status; while investigating long signals with RSI crosses up and over 30 as the market leaves ‘oversold’ status.
Trading the Range in USDJPY (4-hour chart) with RSI
How to Trade Swings within a Trend Using MACD
As we looked at above, RSI can be a fantastic way to trade swings within
a range. But the fact-of-the-matter is that most traders avoid ranges
like they were infested with bubonic plague. So I would be remiss in
this article if I didn’t touch on the most desired of the three market
conditions: The trend.
To use an indicator to trade swings within a trending environment, we’re
going to need some type of a filter to help us determine which
direction to trade the trend. A common filter for this cause is the
200-day moving average; as many investment banks and hedge funds
around-the-world use this indicator for the same purpose.
If prices are above the 200-day moving average, traders determine the
trend to be ‘up,’ in which case they look for opportunities to buy.
In the below image, we’re taking a look at GBPUSD over the past year; in
which the pair has seen a brisk up-trend take prices from the 1.5500
vicinity, all the way up towards 1.7000. The 200-day moving average has
been applied, and is showing in red on this 4-hour chart below.
MACD has also been applied, using the settings of 21, 55, and 9 periods
respectively, and when the MACD crosses up and over the signal line – a
long position is considered. Because this is a trending strategy, the
short signal from MACD (MACD crossing down and under the signal line) is
used only to close the long position. No short positions are initiated
here because the trend is classified as being ‘up.’
GBPUSD 4-hour chart (with 200-day Moving Average) Using MACD Trend-Side Entries
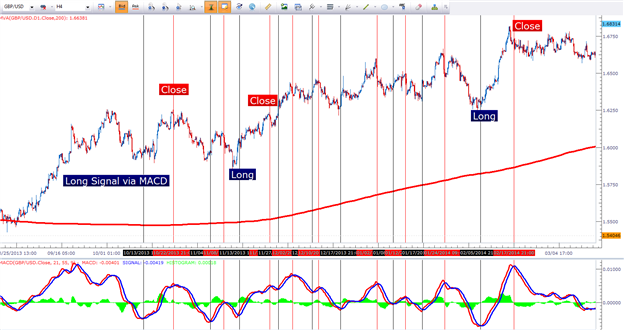
As you can see above, not every signal would have worked out perfectly. But in this year-long trend in GBPUSD, traders had numerous opportunities to jump on the long side when prices were ‘low,’ and then to close the positions out after prices have swung higher.


")
