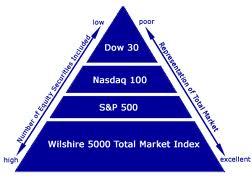
The Wilshire 5000 Total Market Index, or more simply the Wilshire 5000, is a market-capitalization-weighted index of the market value of all stocks actively traded in the United States. As of September 30, 2014 the index contained only 3,698 components. The index is intended to measure the performance of most publicly traded companies headquartered in the United States, with readily available price data, (Bulletin Board/penny stocks and stocks of extremely small companies are excluded). Hence, the index includes a majority of the common stocks and REITs traded primarily through New York Stock Exchange, NASDAQ, or the American Stock Exchange. Limited partnerships and ADRs are not included.
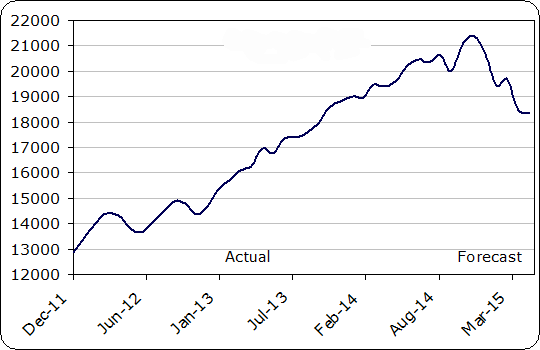
Wilshire 5000 Stock Index Forecast Index Values Average of Month :| Month | Date | Forecast Value |
50% Correct +/- |
80% Correct +/- |
| 0 | Nov 2014 | 21,116.4 | +/-0 | +/-0 |
| 1 | Dec 2014 | 21,360 | +/-215 | +/-409 |
| 2 | Jan 2015 | 20,710 | +/-284 | +/-539 |
| 3 | Feb 2015 | 19,427 | +/-334 | +/-634 |
| 4 | Mar 2015 | 19,692 | +/-374 | +/-711 |
| 5 | Apr 2015 | 18,472 | +/-409 | +/-778 |
| 6 | May 2015 | 18,356 | +/-440 | +/-836 |


