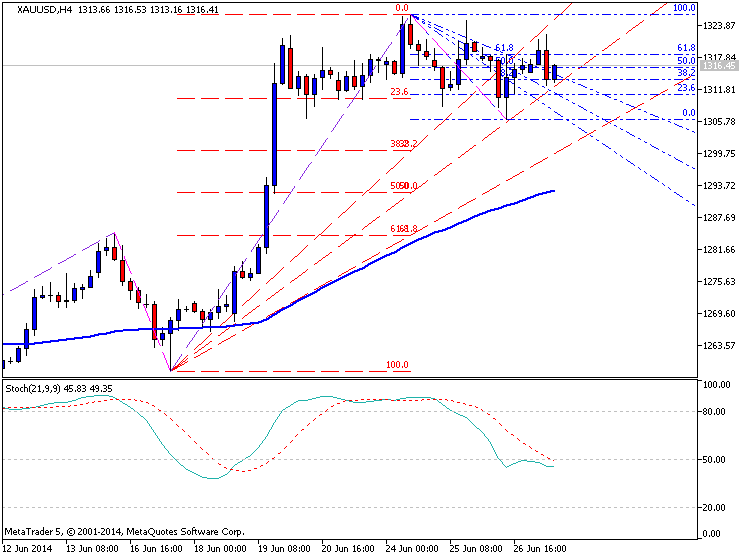
After a strong rally last week, Gold has been consolidating roughly between 1326 and 1306. We saw traders during the 6/26 session respect the support around 1306, bringing back June’s bullish trend in focus.

The technical conditions in the 4H chart favor a bullish breakout. The moving averages in are in bullish alignment. The RSI has tagged 80 and held above 40, which reflects maintenance of bullish momentum according to the RSI guru Andrew Cardwell.

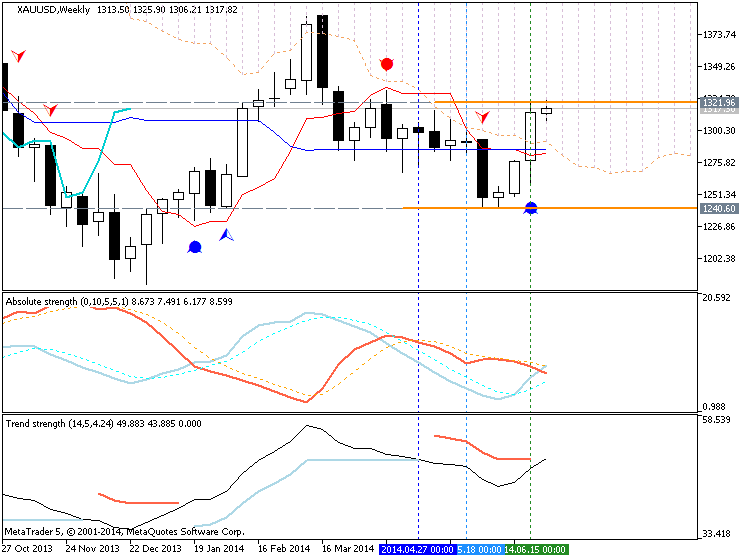
When looking at the weekly chart, you can see that gold is currently challenging a falling trendline from 2012 that held in March.
Ability to break above the current consolidation in the 4H chart will
open up the 1350 area, which is likely to be around a falling trendline
from 2013. Also, this week’s range is 1326-1320=20, and a range breakout
projects to 1326+20 = 1346.
A break below 1326 would also project towards 1300-1306. If it falls further, the 1285 level should provide support. Otherwise, if price breaks below 1280, traders will likely have shifted to the bearish mode.


