Probability Indicator for MT5
- Indikatoren
- Steven Brown
- Version: 1.1
- Aktualisiert: 5 September 2018
- Aktivierungen: 5
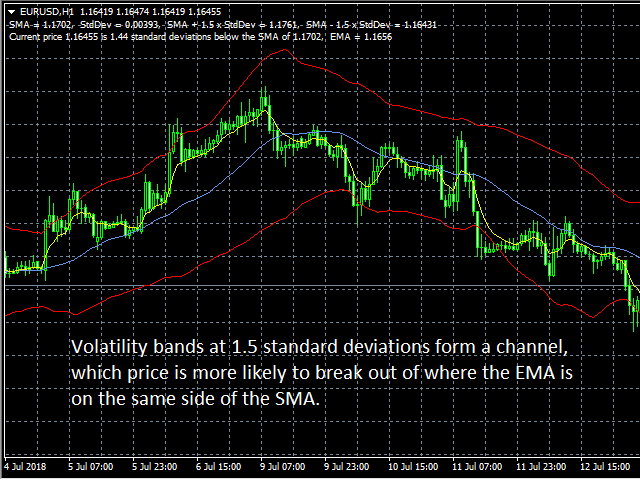
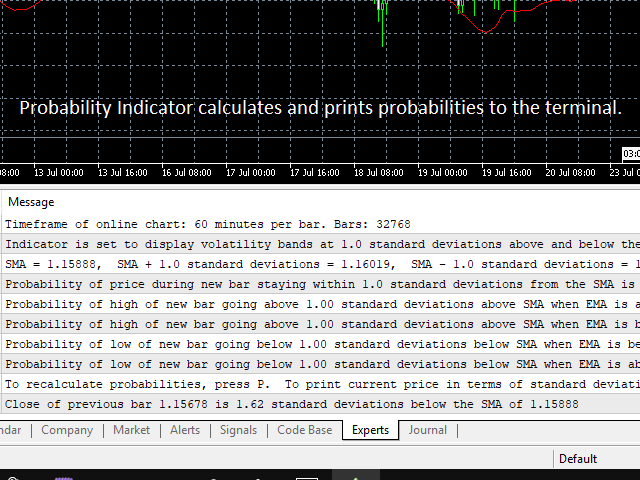
Der Wahrscheinlichkeitsindikator zeigt die Volatilitätsbänder auf dem Preisdiagramm an und berechnet die Wahrscheinlichkeit, dass der Preis für den nächsten Balken bestimmte Werte übersteigt, wobei der Trend berücksichtigt wird. Dazu führt er eine statistische Analyse der abgeschlossenen Balken in der Historie des Charts durch, die Daten aus mehreren Jahren umfassen kann. Die Volatilitätsbänder unterscheiden sich von den Bollinger-Bändern durch die Berechnung der Standardabweichung vom einfachen gleitenden Durchschnitt, was zu Bändern führt, die den Bereich der Kursschwankungen in einem für den Händler nützlichen Kanal einschließen.
Vorteile
- Die gezeichneten Bänder sind nützlicher als die Bollinger-Bänder
- EMA im Verhältnis zu SMA zeigt Trend an
- Der Trend fließt in die Wahrscheinlichkeitsberechnung ein
- Wahrscheinlichkeitswerte werden auf dem Terminal ausgedruckt
- Der Indikator verwendet alle Daten der Chart-Historie
Merkmale
- Anwendbar auf jeden Zeitrahmen
- Berechnet Wahrscheinlichkeiten für Hoch, Tief oder Schluss des nächsten Balkens
- Berechnung der Wahrscheinlichkeiten für jeden ausgewählten Preis
- Meldet den aktuellen Preis als Standardabweichung vom SMA
Eingaben
- "SMA-Perioden", Balken im einfachen gleitenden Durchschnitt
- "EMA-Perioden", Balken im exponentiell gleitenden Durchschnitt
- "Band-Standardabweichungen", Abstand der Bänder vom SMA
- "Höchst- und Tiefstwerte der Balken verwenden", Berechnung der Wahrscheinlichkeiten für den maximalen Preisausschlag oder für den Schlusskurs
- "Bollinger-Berechnung verwenden", Plot nach Bollinger-Methode oder nach verbesserter Methode
- "Signifikante Ziffern", Einstellung der Genauigkeit der Zahlen im Terminal
- "Ausschlussschwelle", erklärt im Benutzerhandbuch
Im Benutzerhandbuch werden die Funktionsweise und die Verwendung des Wahrscheinlichkeitsindikators ausführlich beschrieben.