Volume Structure MT4
- Indicators
- Part-time Day Trader
- Version: 1.2
- Updated: 20 May 2026
- Activations: 15
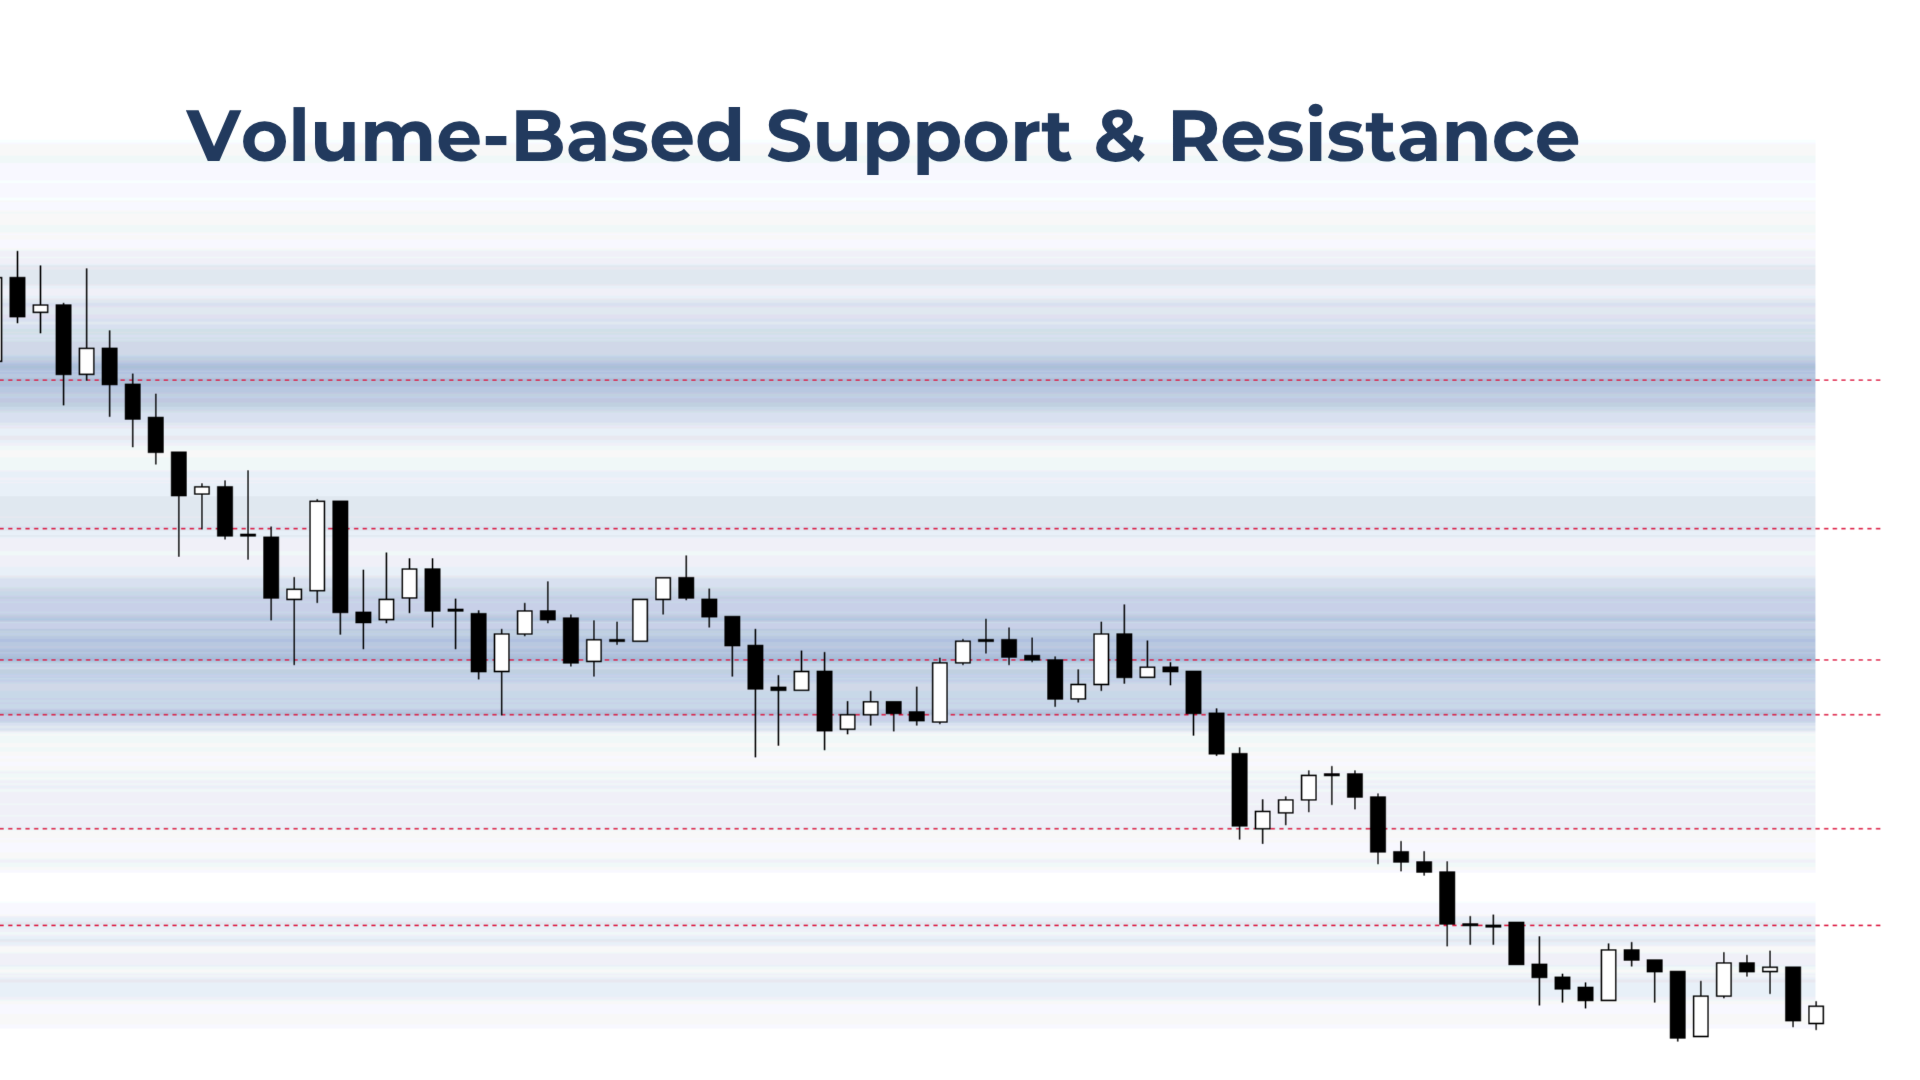
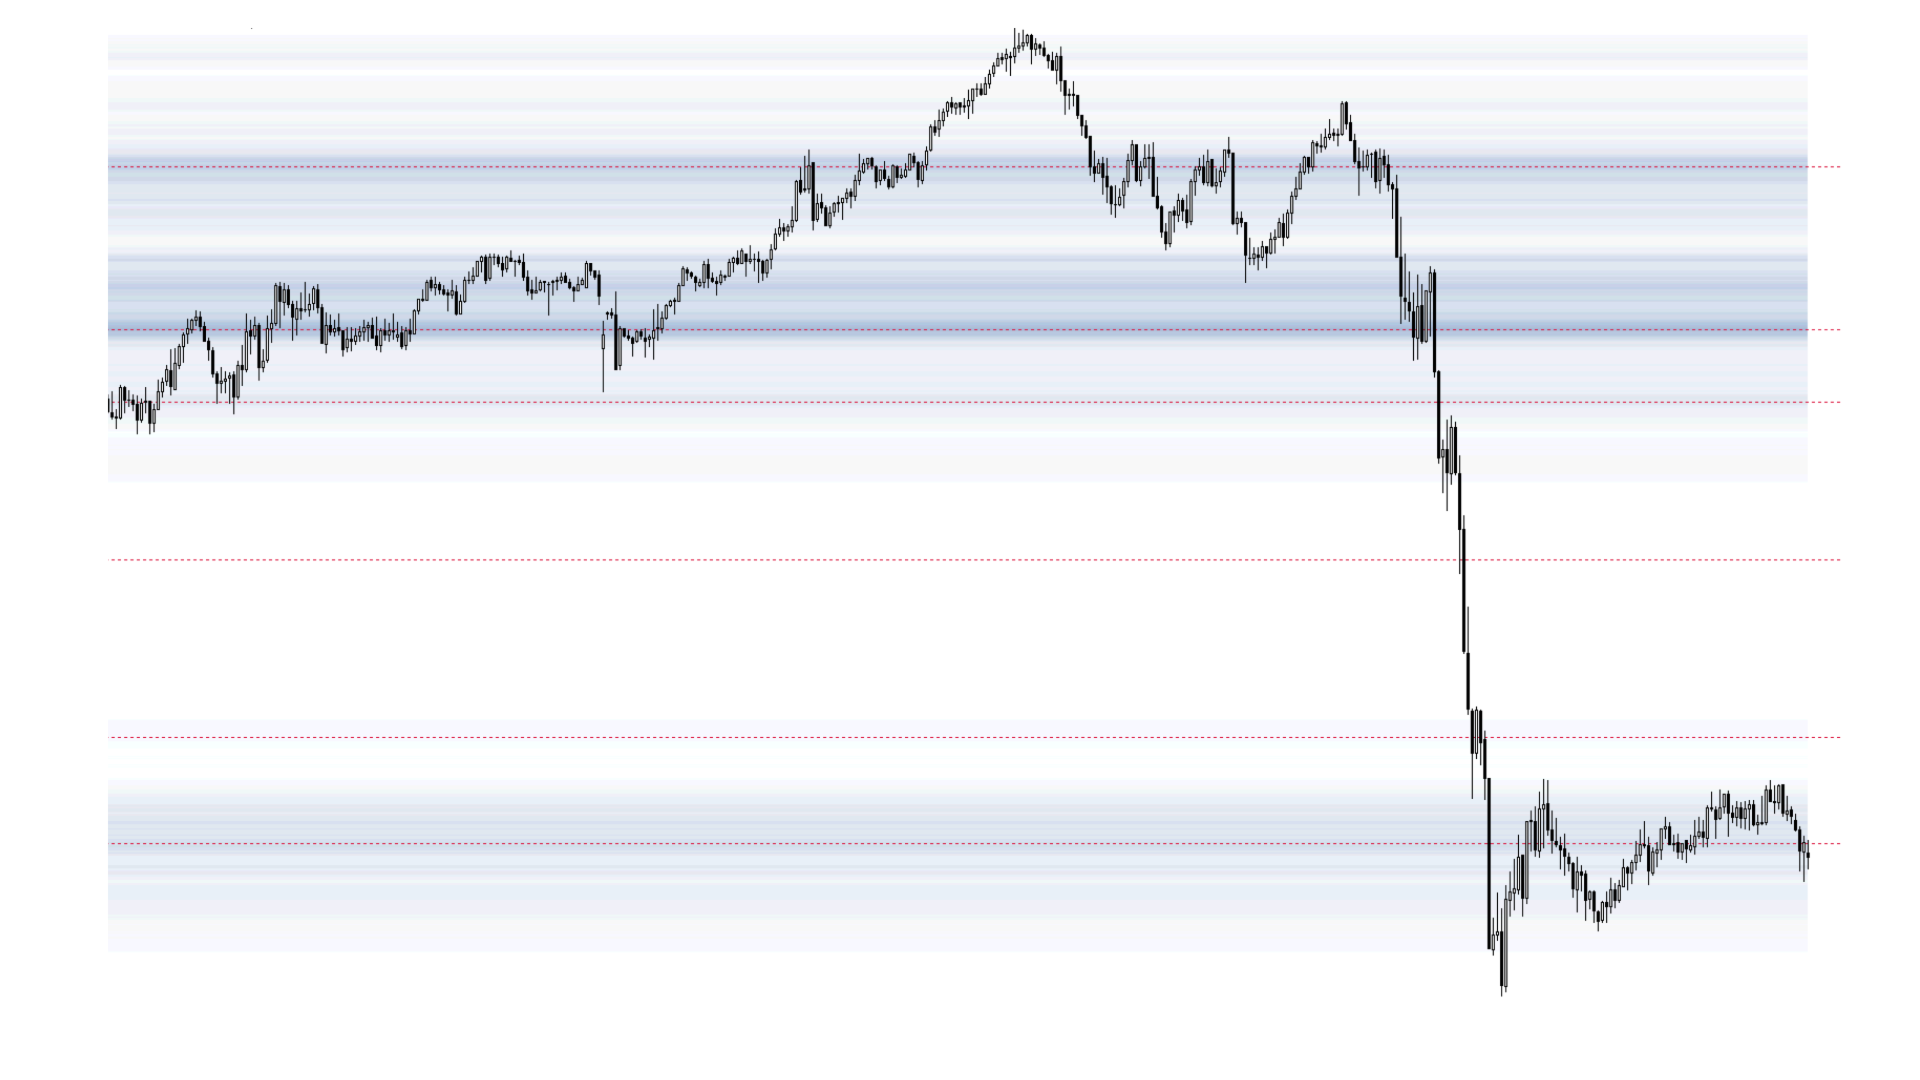
See volume-based support and resistance at a glance.
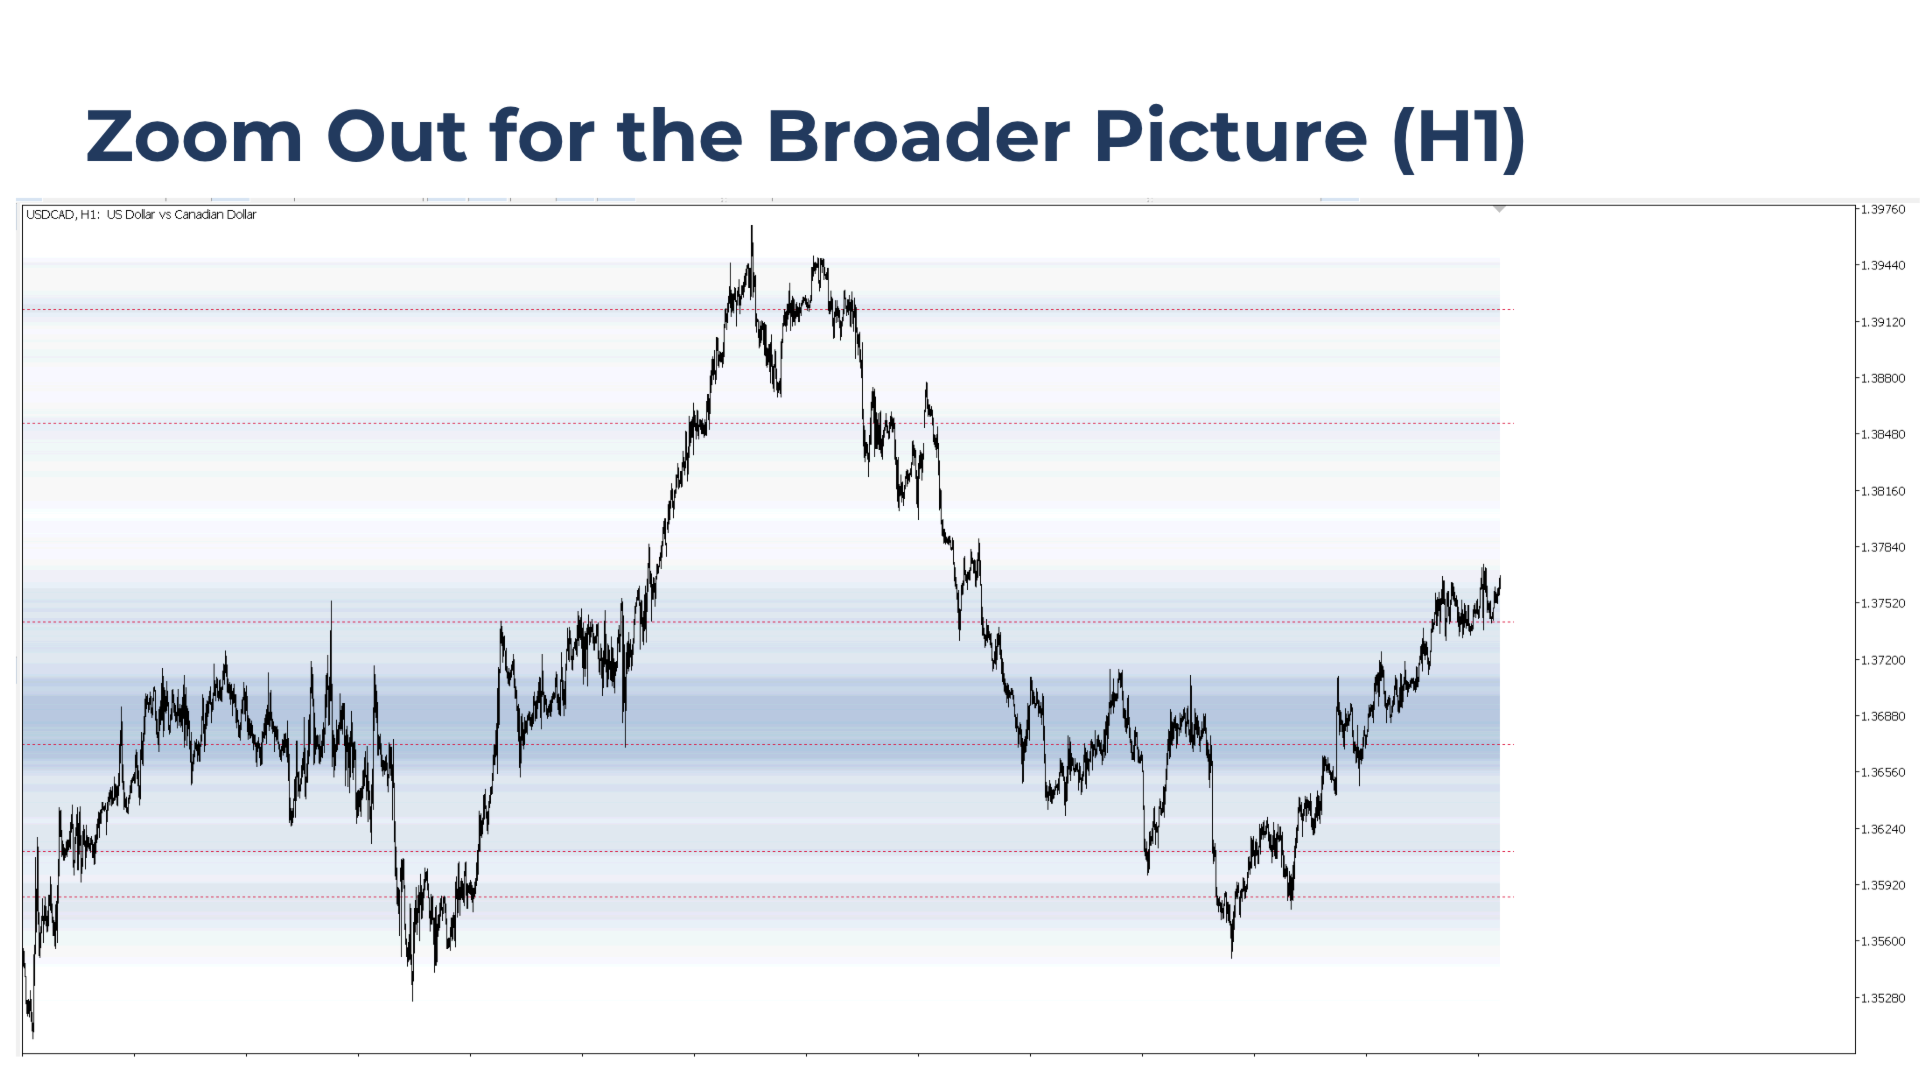
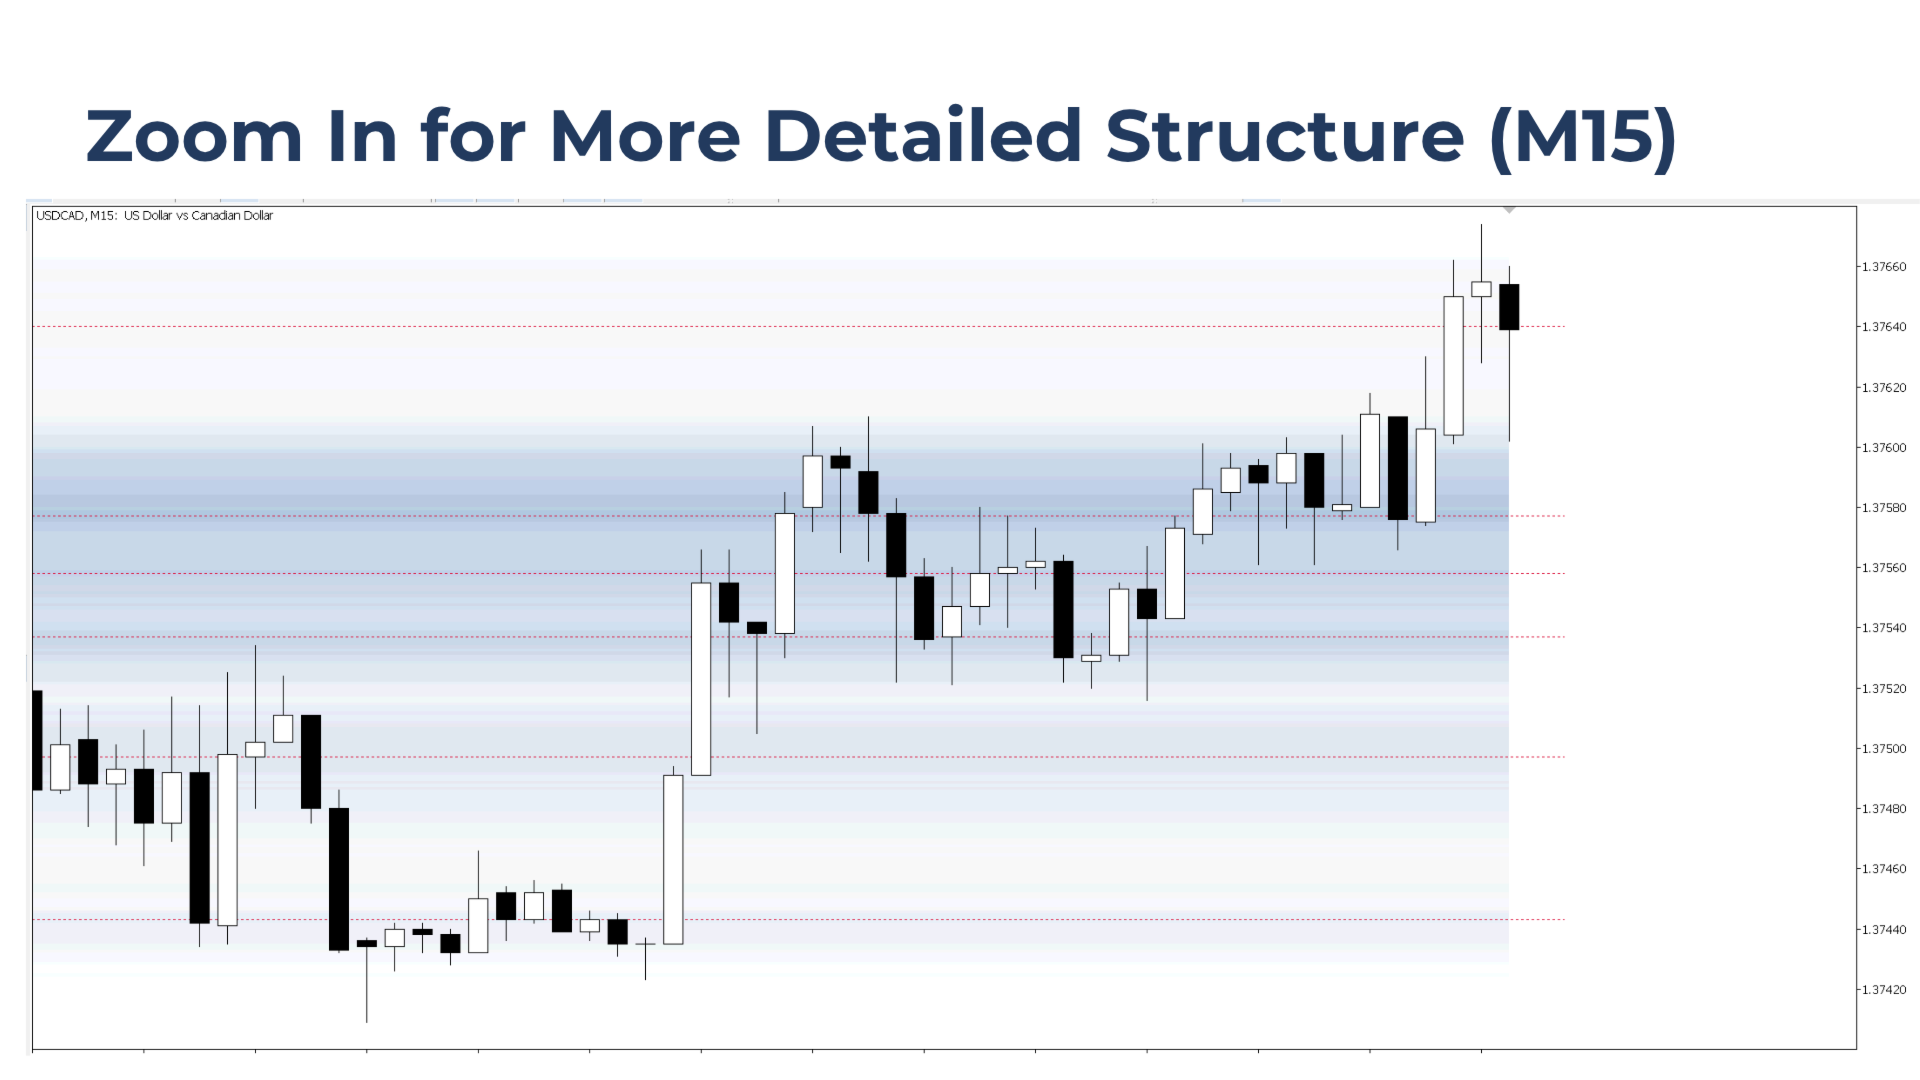
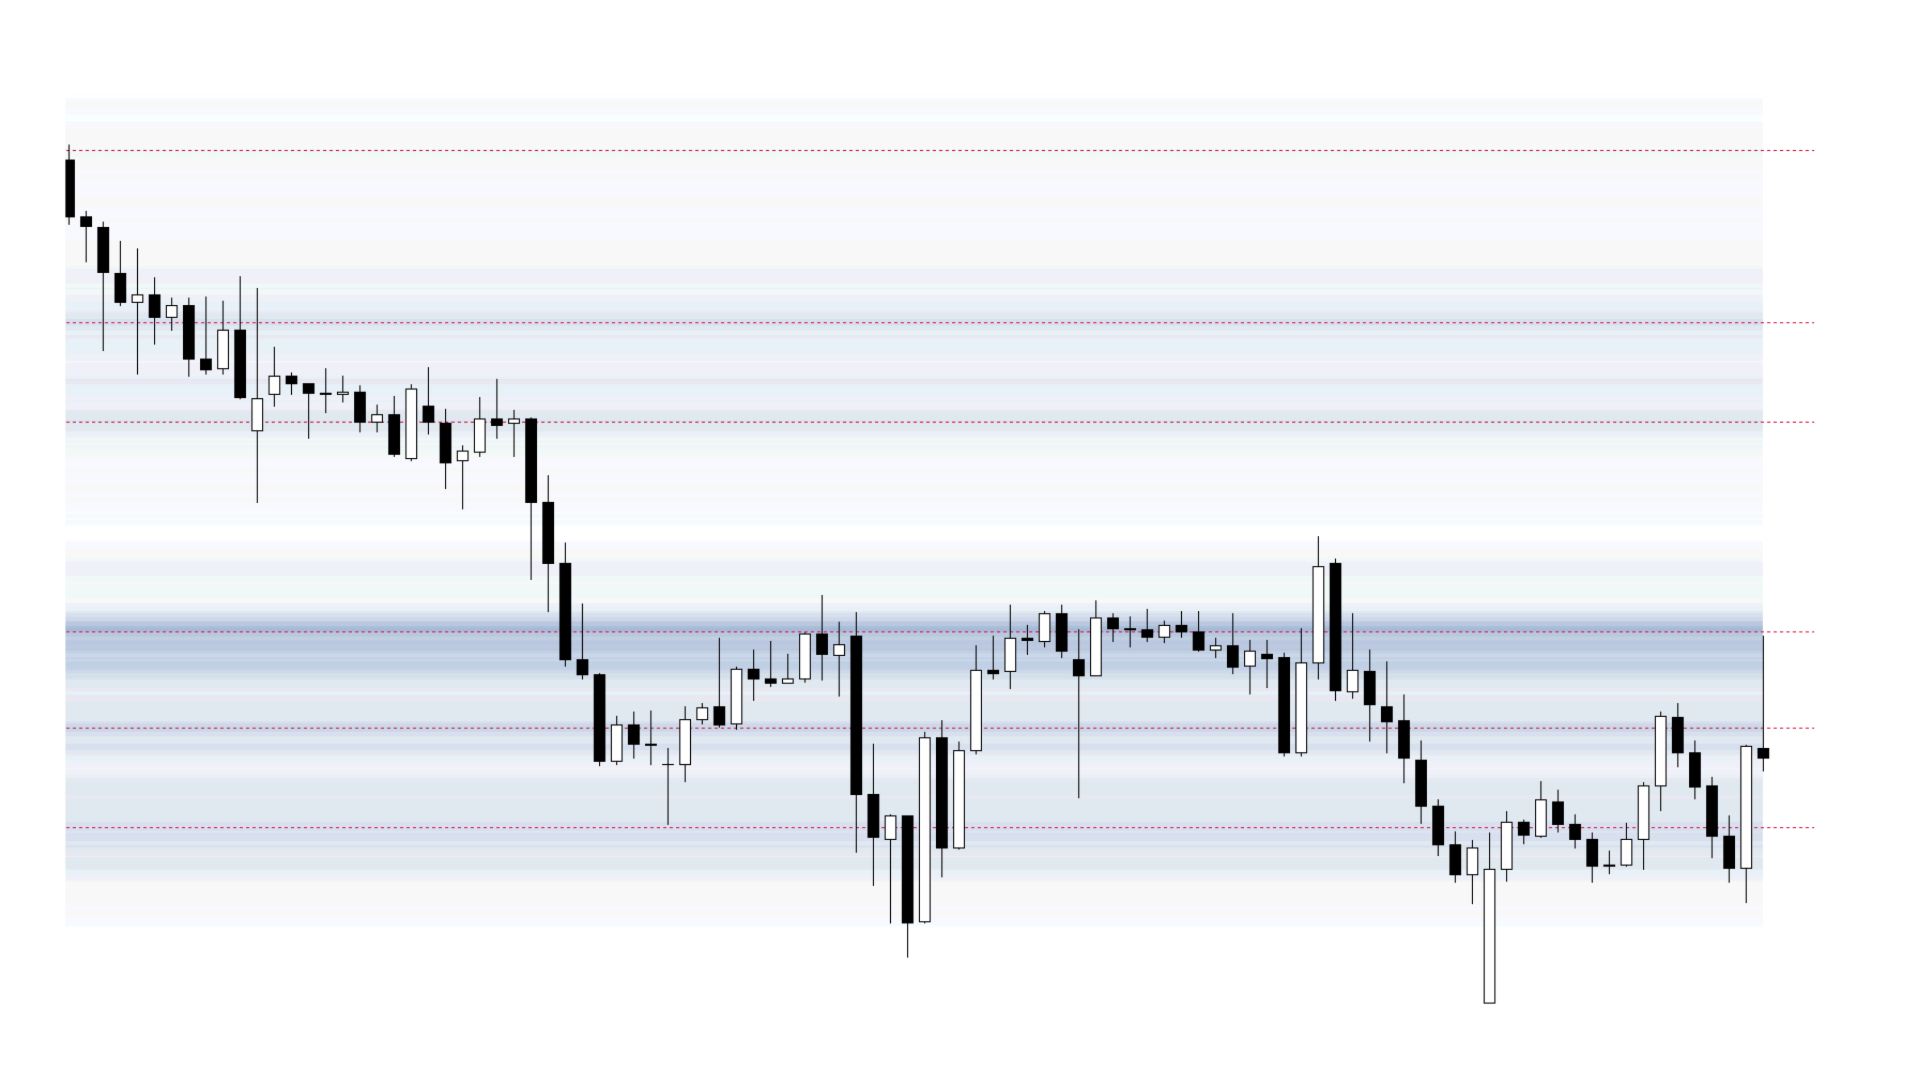
Volume Structure turns visible-range volume into a chart-wide heatmap and marks local volume peaks as key levels for alerts, targets, and entries. Zoom out for the broader picture, or zoom in for more detailed structure.
Built for traders who focus on:
- Market reversals at key zones
- Support and resistance
- Volume profile levels
What Does Volume Structure Do?
Volume Structure displays a visible-range heatmap of volume zones across the chart and marks key levels at major volume peaks.
By zooming in or out, traders can control the visible range used for the calculation. This makes it possible to focus on recent local structure or zoom out to view broader support and resistance structure.
Key benefits
- Makes volume-based support and resistance zones easier to spot.
- Marks key levels where volume is locally higher, even inside thinner volume zones.
- Uses the visible chart range, so structure detail can be adjusted by zooming in or out.
Main features of Volume Structure
Lightweight Performance
Updates only when needed to keep CPU usage low and chart performance smooth.
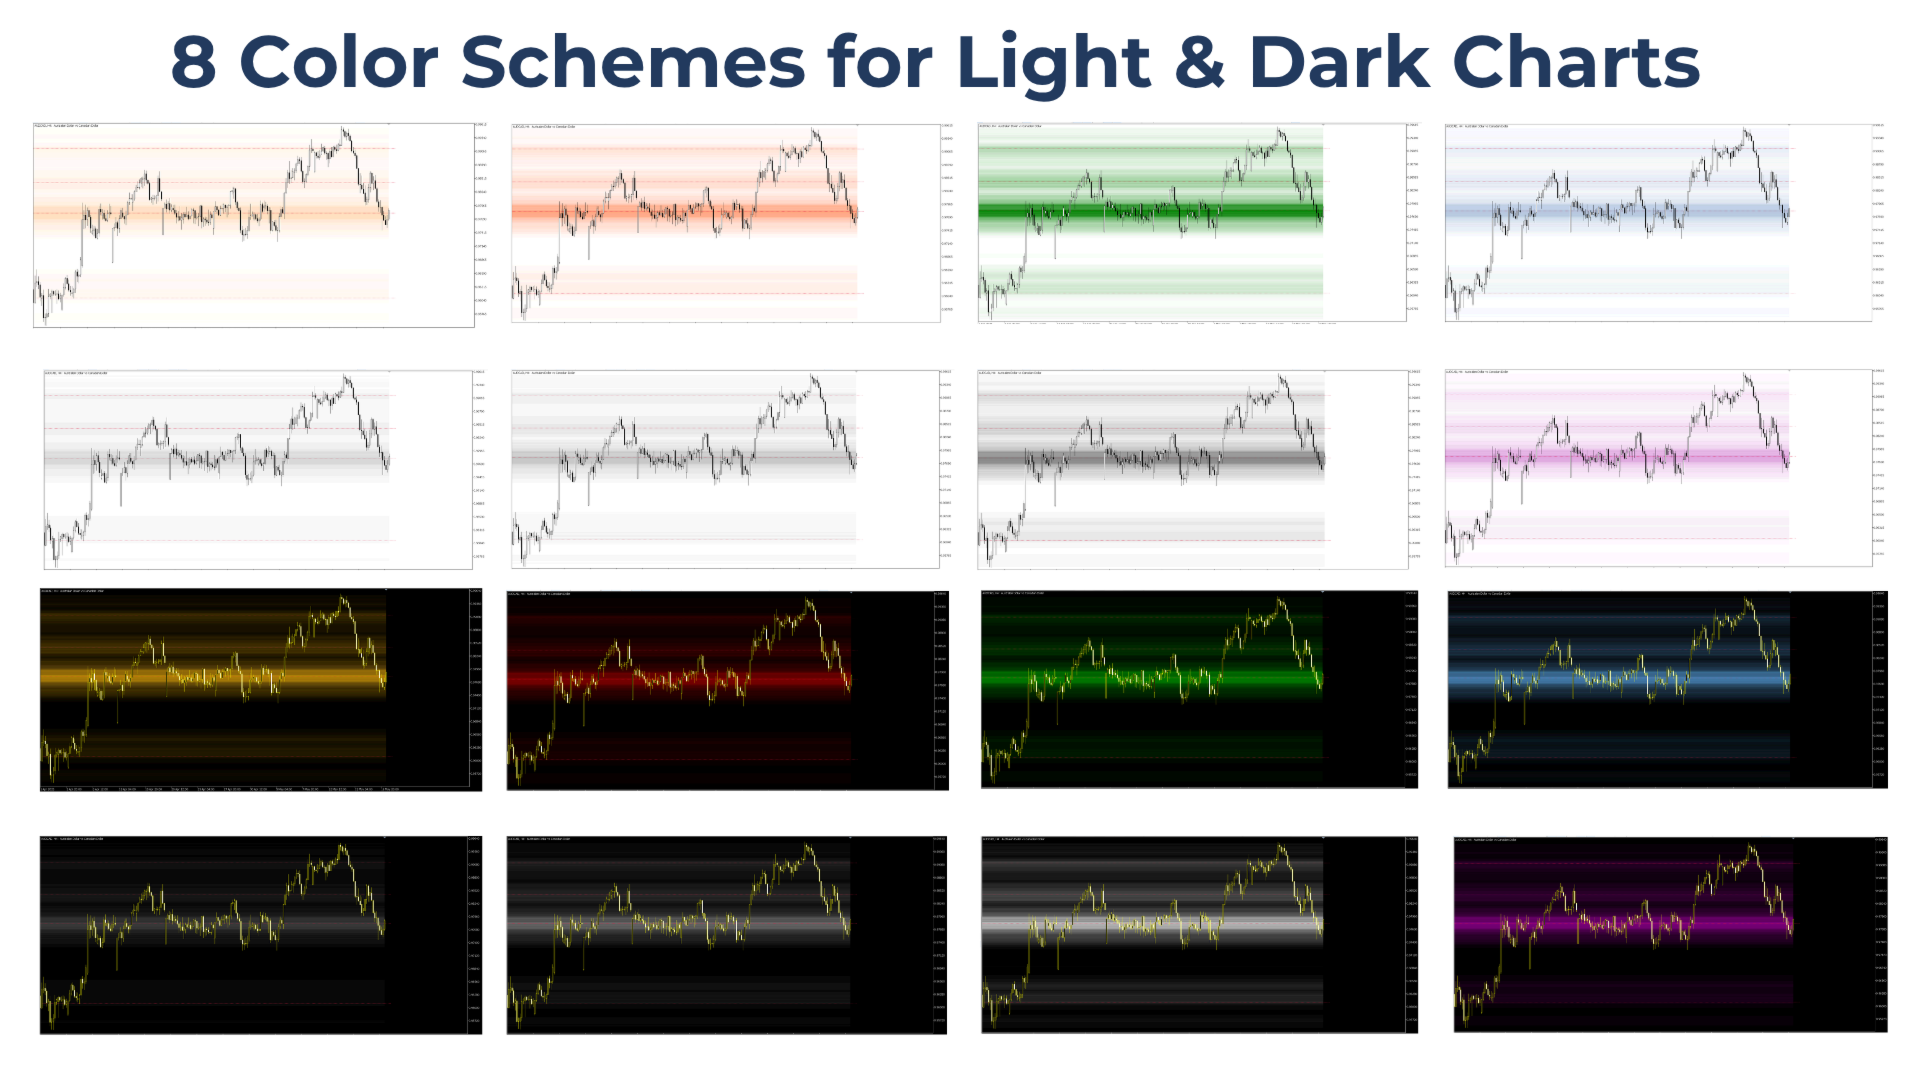
8 Color Schemes
Choose from 8 color schemes to match different chart backgrounds, candle colors, and visibility preferences.
Works on All Symbols and Timeframes
Can be used across all Market Watch symbols and any timeframe.
How to use Volume Structure
1. Attach the indicator to the chart.
2. Zoom in or out to adjust the visible range. The zones and levels update instantly to the new chart scale.
3. The tool updates automatically with each new candle.
Limitations
The tool is not supported in the Strategy Tester.