Bermaui Bands

4.97

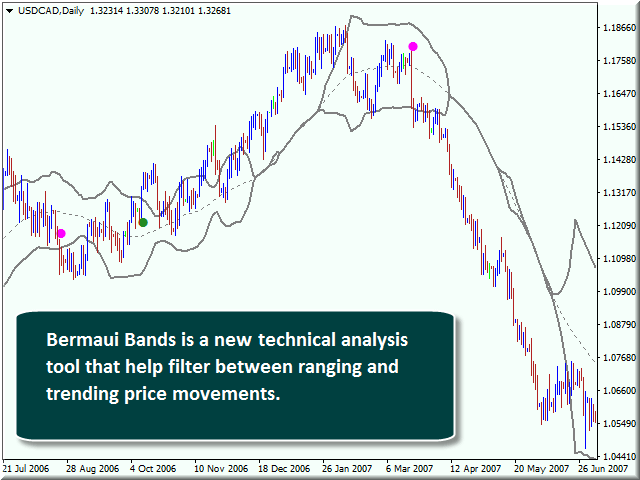
Bermaui Bands (BB) is a technical analysis tool that helps filter between ranging and trending price movements. The idea behind this indicator can be explained in the next steps:

  1. Calculate Standard Deviation as an oscillator that moves between 0 and 100. I will name it Bermaui Deviation percent (BD %).
  2. If "BD %" is near zero then volatility is at its extreme. In addition, if "BD %" is near 100 then volatility is very low.
  3. High volatility means a great probability for a trending market, while low volatility means side-way or ranging market.
  4. Middle Line is a Simple Moving Average (SMA) because Standard Deviation is calculated depending on SMA.
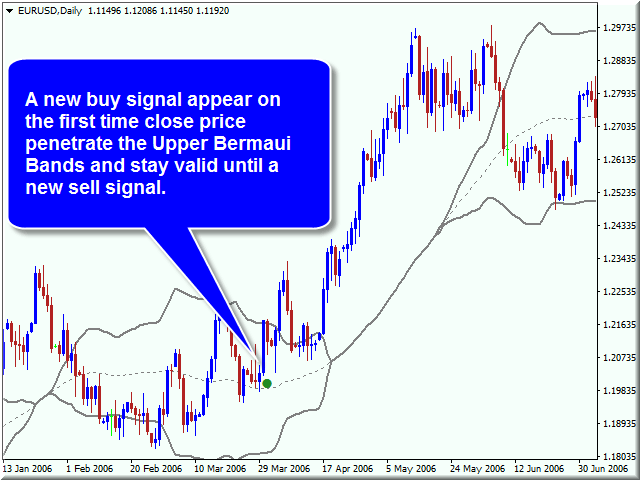
  5. Add "BD %" to a simple moving average with the same number of bars in the calculation to get The Upper Bermaui Band.
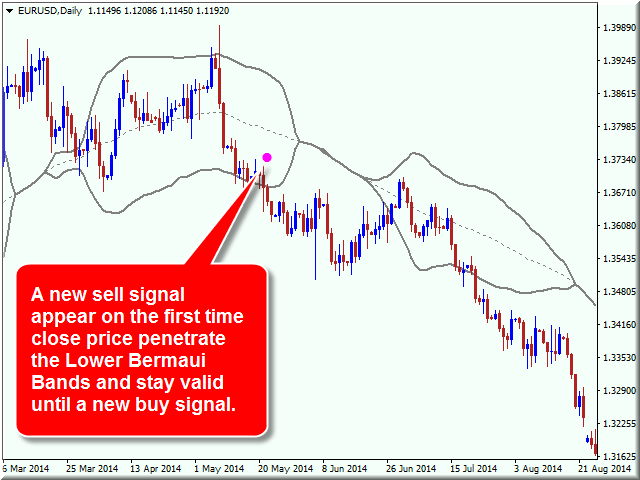
  6. Subtract "BD %" from a simple moving average with the same number of bars in the calculation to get The Lower Bermaui Bands.

Important Information


How to use it

  • Use Bermaui Bands as a filter to help you identify trend direction.
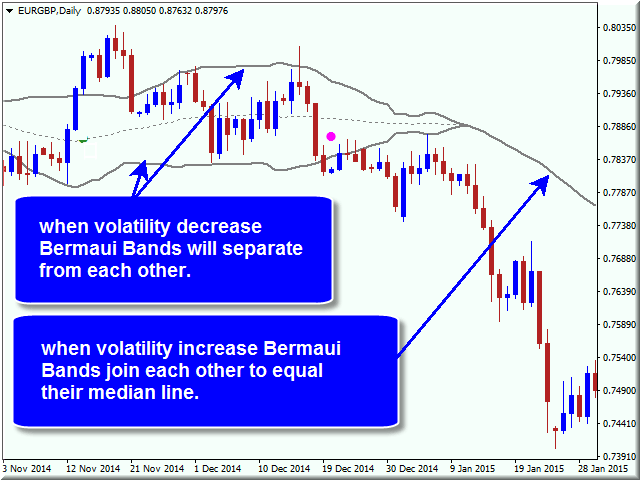
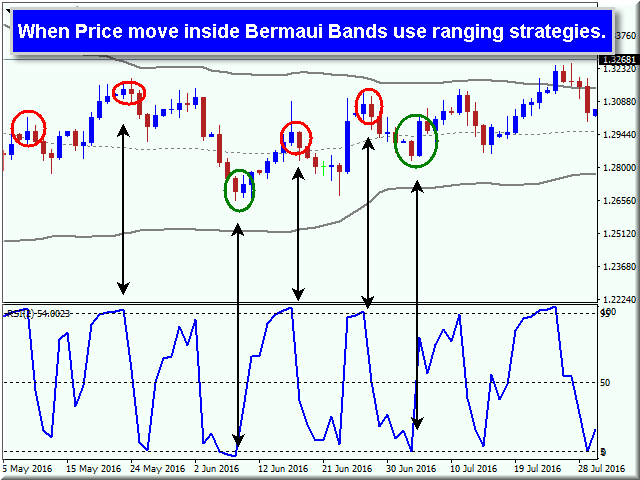
  • If BB lines separate from each other then there is a great probability that price candles will move in a side-way or a ranging movement.
  • When BB lines separate from each other and price candles move in between them then trade with a ranging market strategy.
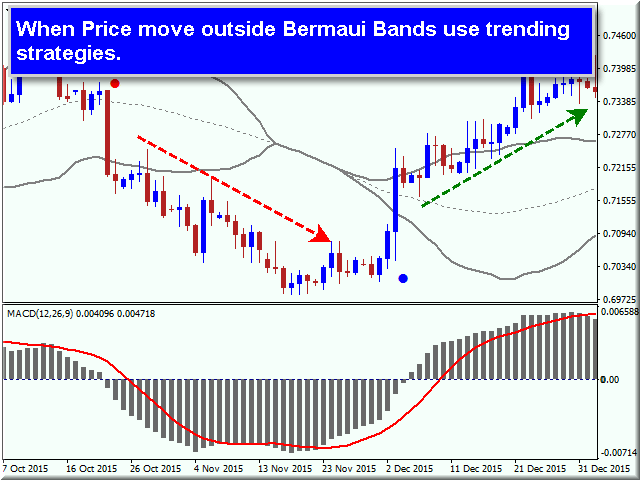
  • If BB lines combine like a single line then there is a great probability that price will move in a trending movement.
  • When BB lines combine like a single line and price candles move away from them then trade with a trending market strategy.

    Features

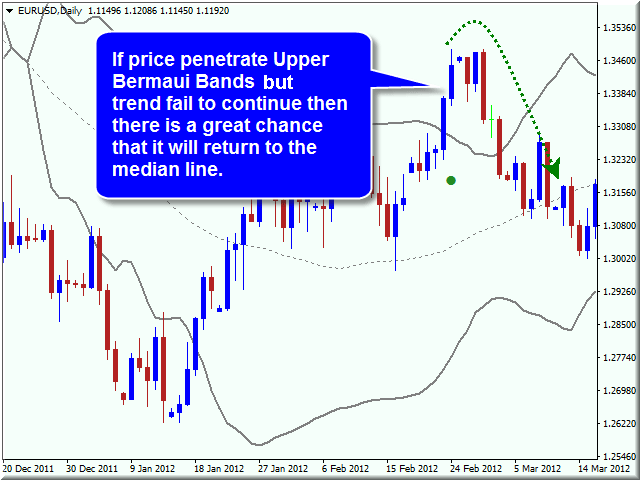
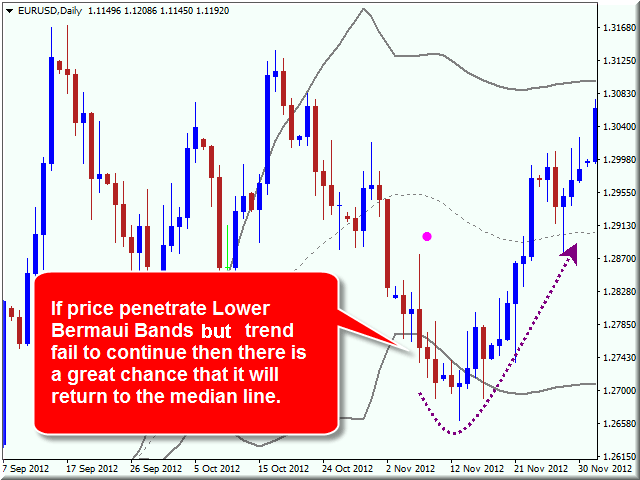
    • Buy & Sell alert signals when price candles penetrate BB lines.
    • Suggested Stop loss that depends on a percent from Standard Deviation.
    • A well-designed style that users can control.
    • Sound, email alerts depending on the user choice.

    Bermaui Bands most important inputs

      1) Bermaui Bands Settings

      • Candles [Min =2]:The number of candles used in band calculations. If less than two the indicator will print a message and this parameter will be reset to default (= 50).
      • Deviation Multiplier [>0]:This parameter will help you to control Bermaui Band's width or how much far the bands can be away from the center-line (default is 2.1). It should be bigger than zero or the indicator will print a message and this parameter will be reset to default.
      • Bands Width:Choose the width of the bands (the median line will always be a dotted line).
      • Bands Color:Color of the bands. The default is Gray.

      2) Arrow Settings

      • Show Arrow Signals:Show or hide signal arrows (default is true).
      • Buy Arrow Color:Default is Blue.
      • Sell Arrow Color:Default is Red.

      3) Alert & Email Settings

      • Send Alert:Choose to use or stop alert sound and message Default is true.
      • Send Email:Option to send messages to the user by email. Default is false.
      • Send Notification:Option to send mobile notifications to the user. Default is false.


      If you have any questions then please, contact me via a private message or, write them in the comment section.
      Muhammad Al Bermaui, CMT


      Reviews 95
      Yusuf Hamzah
      806
      Yusuf Hamzah 2024.09.08 17:42 
       

      Another one-of-a-kind innovative indicator that is based on volatility. A rare one, indeed. I vouch for this ingenuity.

      Robbert
      1073
      Robbert 2024.03.25 11:05 
       

      Very usefull indicator to follow the trend on long and short TimeFrames. The author is very helpfull with tips and tricks and this is my 3rd indicator from Mr Bermaui. Highly Recommended !!

      pornchai_p
      910
      pornchai_p 2023.06.04 04:26 
       

      I bought two indicators Bermaui RSI candles and Bermaui Bands. The indicators look amazing. Kindly send me the Bermaui Stochastic and Bermaui Bands EA (Bonus). Thank you.

      Recommended products
      Noize Absorption Index MT4
      Ekaterina Saltykova
      5 (1)
      Noize Absorption Index - is the manual trading system that measures the difference of pressure between bears forces and bulls forces. Green line - is a noize free index that showing curent situation. Zero value of index shows totally choppy/flat market.Values above zero level shows how powerfull bullish wave is and values below zero measures bearish forces.Up arrow appears on bearish market when it's ready to reverse, dn arrow appears on weak bullish market, as a result of reverse expectation. S
      Super Reversal Pattern
      Parfait Mujinga Ndalika
      Super Reversal Pattern Indicator Unlock the power of advanced pattern recognition with our Super Reversal Pattern Indicator. Designed for traders seeking precision and reliability, this indicator identifies one of the most effective reversal patterns in technical analysis, offering a significant edge in your trading strategy. Key Features: Non-Repainting Accuracy: Enjoy the confidence of non-repainting technology. Once a Super Reversal Pattern is detected, it remains static, providing consiste
      The Th3Eng PipFinite indicator is based on a very excellent analysis of the right trend direction with perfect custom algorithms. It show the true direction and the best point to start trading. With StopLoss point and Three Take Profit points. Also it show the right pivot of the price and small points to order to replace the dynamic support and resistance channel, Which surrounds the price. And Finally it draws a very helpful Box on the left side on the chart includes (take profits and Stop loss
      The SMC Venom Model BPR indicator is a professional tool for traders working within the Smart Money (SMC) concept. It automatically identifies two key patterns on the price chart: FVG (Fair Value Gap) is a combination of three candles, in which there is a gap between the first and third candles. It forms a zone between levels where there is no volume support, which often leads to a price correction. BPR (Balanced Price Range) is a combination of two FVG patterns that form a “bridge” - a zone of
      VR Cub
      Vladimir Pastushak
      VR Cub is an indicator for getting high-quality entry points. The indicator was developed to facilitate mathematical calculations and simplify the search for entry points into a position. The trading strategy for which the indicator was written has been proving its effectiveness for many years. The simplicity of the trading strategy is its great advantage, which allows even novice traders to successfully trade with it. VR Cub calculates position opening points and Take Profit and Stop Loss targe
      Owl smart levels
      Sergey Ermolov
      4.24 (37)
      MT5 version  |  FAQ The Owl Smart Levels Indicator  is a complete trading system within the one indicator that includes such popular market analysis tools as  Bill Williams' advanced fractals , Valable ZigZag which builds  the correct wave structure  of the market, and  Fibonacci levels  which mark the exact levels of entry into the market and places to take profits. Detailed description of the strategy Instructions for working with the indicator Advisor-assistant in trading Owl Helper Private
      Infinity Trend Pro
      Yaroslav Varankin
      1 (1)
      This is a trend indicator without redrawing Developed instead of the binary options strategy (by the color of the Martingale candlestick) Also works well in forex trading When to open trades (binary options) A signal will appear in the place with a candle signaling the current candle It is recommended to open a deal for one candle of the current timeframe M1 and M5 When a blue dot appears, open a deal up When a red dot appears, open a trade down. How to open trades on Forex. When a signal is rec
      Daily Candle Predictor is an indicator that predicts the closing price of a candle. The indicator is primarily intended for use on D1 charts. This indicator is suitable for both traditional forex trading and binary options trading. The indicator can be used as a standalone trading system, or it can act as an addition to your existing trading system. This indicator analyzes the current candle, calculating certain strength factors inside the body of the candle itself, as well as the parameters of
      EZZ Elite Zig Zag is an indicator for the MetaTrader 4 terminal. This indicator traces the peak of the trend based on the market reversal, thus showing various opportunities in the financial market. EZZ Elite Zig Zag is a visual tool, intuitive, and easy to understand and use.  Test it Yourself by Downloading it for Free. Author Paulo Rocha all rights reserved
      We present you the indicator "Candle closing counter", which will become your indispensable assistant in the world of trading. That’s why knowing when the candle will close can help: If you like to trade using candle patterns, you will know when the candle will be closed. This indicator will allow you to check if a known pattern has formed and if there is a possibility of trading. The indicator will help you to prepare for market opening and market closure. You can set a timer to create a pre
      Master Scalping M1 is an innovative indicator that uses an algorithm to quickly and accurately determine the trend.The indicator calculates the time of opening and closing positions, the indicator's algorithms allow you to find the ideal moments to enter a deal (buy or sell an asset), which increase the success of transactions for most traders. Benefits of the indicator: Easy to assemble, does not overload the chart with unnecessary information. Can be used as a filter for any strategy. Works on
      Trend Oscillator - is an advanced custom  Crypto_Forex indicator, efficient trading tool! Advanced new calculation method is used - 20 options for parameter "Price for calculation". Smoothest oscillator ever developed. Green color for upward trends,  Red color for downward trends. Oversold values: below 5, O verbought values: over 95. There are plenty of opportunities to upgrade even standard strategies with this indicator. With PC and Mobile alerts. // Great Trading Robots and Indicators are a
      TWO PAIRS SQUARE HEDGE METER INDICATOR Try this brilliant 2 pairs square indicator It draws a square wave of the relation between your two inputs symbols when square wave indicates -1 then it is very great opportunity to SELL pair1 and BUY Pair2 when square wave indicates +1 then it is very great opportunity to BUY pair1 and SELL Pair2 the inputs are : 2 pairs of symbols         then index value : i use 20 for M30 charts ( you can try other values : 40/50 for M15 , : 30 for M30 , : 10 for H1 ,
      Gvs Undefeated Trend   indicator is designed for trend and signal trading. This indicator generates trend signals.  It uses many algorithms and indicators to generate this signal. It tries to generate a signal from the points with the highest trend potential. This indicator is a complete trading product. This indicator does not need any additional indicators.  You can only trade with this indicator. The generated signals are displayed on the graphical screen.  Thanks to the alert features you ca
      Auto Fibo Pro m
      DMITRII GRIDASOV
      "Auto FIBO Pro"   Crypto_Forex  indicator  - is great auxiliary tool in trading! Indicator automatically calculate and place on chart Fibo levels and local trend lines (red color). Fibonacci levels indicate key areas where price can reverse. Most important levels are 23.6%, 38.2%, 50% and 61.8%. You can use it   for reversal scalping  or for zone grid trading. There are plenty of opportunities to  improve your current system using Auto FIBO Pro indicator as well. It has Info Spread Swap Displa
      The indicator displays the data of the Stochastic oscillator from a higher timeframe on the chart. The main and signal lines are displayed in a separate window. The stepped response is not smoothed. The indicator is useful for practicing "manual" forex trading strategies, which use the data from several screens with different timeframes of a single symbol. The indicator uses the settings that are identical to the standard ones, and a drop-down list for selecting the timeframe. Indicator Paramet
      Fibonacci retracement and extension line drawing tool Fibonacci retracement and extended line drawing tool for MT4 platform is suitable for traders who use  golden section trading Advantages: There is no extra line, no too long line, and it is easy to observe and find trading opportunities Trial version: https://www.mql5.com/zh/market/product/35884 Main functions: 1. Multiple groups of Fibonacci turns can be drawn directly, and the relationship between important turning points can be seen
      HMA Trend Professional MT4
      Pavel Zamoshnikov
      4.57 (7)
      Improved version of the free HMA Trend indicator (for MetaTrader 4) with statistical analysis. HMA Trend is a trend indicator based on the Hull Moving Average (HMA) with two periods. HMA with a slow period identifies the trend, while HMA with a fast period determines the short-term movements and signals in the trend direction. The main differences from the free version: Ability to predict the probability of a trend reversal using analysis of history data. Plotting statistical charts for analyzi
      "Dynamic Scalping Oscillator" - is an advanced custom Crypto_Forex indicator - efficient Trading tool for MT4!  - New generation of Oscillators - see pictures to check how to use it. - Dynamic Scalping Oscillator has adaptive Oversold/Overbought zones. - Oscillator is an auxiliary tool to find exact entry points from dynamic OverSold/OverBought areas. - Oversold values: below Green line, Overbought values: over Orange line . - This indicator is great to combine with Price Action patterns as we
      RSI Speed mp
      DMITRII GRIDASOV
      Crypto_Forex   Indicator "RSI SPEED" for MT4 - great predictive tool , No Repaint. The calculation of this indicator is  based on equations from physics . RSI SPEED is the  1st derivative of RSI  itself. RSI SPEED is   good for scalping entries   into the direction of main trend. Use it   in combination   with suitable   trend indicator , for example HTF MA (as on pictures). RSI SPEED indicator shows how fast RSI itself changes its direction   - it is very sensitive . It is recommended to use RS
      Alpha Trend sign has been a very popular trading tool in our company for a long time. It can verify our trading system and clearly indicate trading signals, and the signals will not drift. Main functions: Based on the market display of active areas, indicators can be used to intuitively determine whether the current market trend belongs to a trend market or a volatile market. And enter the market according to the indicator arrows, with green arrows indicating buy and red arrows indicating se
      ApexSR MQL4
      German Pablo Gori
      ApexAR - Complete Multi TimeFrame Support and Resistance Systems. Want to trade with the same levels used by major institutional funds? Discover   SRmaster   , the ultimate technical indicator for MetaTrader 5, designed for traders who seek   precision, clarity, and statistical edge   in every trade. What is   ApexSR ? ApexSR   is more than just a support and resistance indicator – it's an   advanced market structure analysis system   that helps you accurately identify the most important
      Crypto_Forex Indicator " F orce Index   with Dynamic OverSold/OverBought zones " for MT4 , No Repaint. F orce index is one of the top indicators that combines price and volume data into a single value. It   is great to take   Sell   trades from   dynamic OverBought zone and   Buy   trades from dynamic OverSold zone. T his indicator is excellent for   Momentum trading   into the trend direction. D ynamic   OverBought zone - above yellow line. Dynamic   OverSold zone - below blue line. F orce 
      [ZhiBiCCI] indicators are suitable for all cycle use, and are also suitable for all market varieties. [ZhiBiCCI] Green solid line is a reversal of bullish divergence. The green dotted line is a classic bullish divergence. [ZhiBiCCI] The solid line to the red is a reverse bearish divergence. The red dotted line is a classical bearish divergence. [ZhiBiCCI] can be set in the parameters (Alert, Send mail, Send notification), set to (true) to send instant signals to the alarm window, email, insta
      This is a new strategy for SUPPLY DEMAND areas It is based on a calculation using the tick volume to detect the big price action in market for both bear /bull actions this smart volume action candles are used to determine the supply and demand areas prices in between main supply and demand lines indicate sideway market  up arrows will be shown when prices moves above the main supply and the secondary supply lines Down arrows will be shown when prices moves below the main demand and the secondary
      Crypto_Forex Indicator  " Morning  Star  pattern" for MT4. Indicator "Morning Star pattern" is a very powerful indicator for Price Action trading:   No repaint, No delay. Indicator   detects bullish Morning Star patterns on chart:  Blue arrow signal on chart (see pictures). With P C, Mobile & Email alerts. Also its brother - bearish  " Evening Star pattern" indicator is available (follow the link below). Indicator  " Morning Star pattern" is excellent to   combine with Support/Resistance Levels
      Cosmic Diviner X Planet
      Olena Kondratenko
      4 (2)
      This unique multi-currency strategy simultaneously determines the strength of trends and market entry points, visualizing this using histograms on the chart. The indicator is optimally adapted for trading on the timeframes М5, М15, М30, Н1. For the convenience of users, the indicator renders the entry point (in the form of an arrow), recommended take profit levels (TP1, TP2 with text labels) and the recommended Stop Loss level. The take profit levels (TP1, TP2) are automatically calculated for
      Buy and sell zones
      Evgeniy Zhdan
      5 (2)
      Indicator for determining flat and trend. If the price is below any of the two histograms and two lines (red and blue), this is a sell zone. When purchasing this version of the indicator, MT5 version for one real and one demo account - as a gift (to receive, write me a private message)! If the price is above any of the two histograms and two lines (red and blue), this is a buy zone. MT5 version:  https://www.mql5.com/en/market/product/70409 If the price is between two lines or in the zone of
      Title : Market Bias Indicator - Oscillator-Based Trading Tool Introduction : Discover the potential of the "Market Bias Indicator," a revolutionary oscillator-based trading tool designed for precise market analysis. If you're in search of a robust alternative to traditional bias indicators, your quest ends here. Market Bias Indicator offers unparalleled accuracy in identifying market sentiment and is your gateway to confident trading decisions. Recommended Trading Pairs : Market Bias Indicator i
      Wave Wolf MT4
      Andrei Salanevich
      The Wave Wold MT4 Forex indicator is designed to search for Wolf waves and display them in the current window of the trading terminal. An excellent indicator for traders who use Wolf waves in trading. Its application in trading strategies will significantly increase their efficiency and profitability. INFORMATION ABOUT THE INDICATOR Unlike other Wolf wave indicators, the Wave Wold MT4 forex indicator has a number of features that significantly increase its effectiveness: The first is the Ope
      Buyers of this product also purchase
      M1 Sniper
      Oleg Rodin
      5 (11)
      M1 SNIPER is an easy to use trading indicator system. It is an arrow indicator which is designed for M1 time frame. The indicator can be used as a standalone system for scalping on M1 time frame and it can be used as a part of your existing trading system. Though this trading system was designed specifically for trading on M1, it still can be used with other time frames too. Originally I designed this method for trading XAUUSD and BTCUSD. But I find this method helpful in trading other markets a
      Trend indicator AI
      Ramil Minniakhmetov
      5 (39)
      Trend Ai indicator is great tool that will enhance a trader’s market analysis by combining trend identification with actionable entry points and reversal alerts.  This indicator empowers users to navigate the complexities of the forex market with confidence and precision Beyond the primary signals, Trend Ai indicator identifies secondary entry points that arise during pullbacks or retracements, enabling traders to capitalize on price corrections within the established trend. Important Advantage
      Gann Made Easy
      Oleg Rodin
      4.82 (137)
      Gann Made Easy is a professional and easy to use Forex trading system which is based on the best principles of trading using the theory of W.D. Gann. The indicator provides accurate BUY and SELL signals including Stop Loss and Take Profit levels. You can trade even on the go using PUSH notifications. PLEASE CONTACT ME AFTER PURCHASE TO GET MY TRADING TIPS PLUS A GREAT BONUS! Probably you already heard about the Gann trading methods before. Usually the Gann theory is a very complex thing not only
      Day Trader Master is a complete trading system for traders who prefer intraday trading. The system consists of two indicators. The main indicator is the one which is represented by arrows of two colors for BUY and SELL signals. This is the indicator which you actually pay for. I provide the second indicator to my clients absolutely for free. This second indicator is actually a good trend filter indicator which works with any time frame. THE INDICATORS DO NOT REPAINT AND DO NOT LAG! The system is
      PipRush is a technical indicator that identifies structured trading opportunities using statistical logic. It automatically draws trade setups with predefined entry, stop loss, and take profit levels. The indicator is designed for traders who want to reduce manual analysis and apply a consistent, data-driven approach. Key Features Automatically plots full trade setup, including entry, stop loss, take profit, and risk-to-reward levels Real-time dashboard displays live performance metrics Alerts f
      Scalper Inside PRO
      Alexey Minkov
      4.69 (68)
      An exclusive indicator that utilizes an innovative algorithm to swiftly and accurately determine the market trend. The indicator automatically calculates opening, closing, and profit levels, providing detailed trading statistics. With these features, you can choose the most appropriate trading instrument for the current market conditions. Additionally, you can easily integrate your own arrow indicators into Scalper Inside Pro to quickly evaluate their statistics and profitability. Scalper Inside
      Currently 20% OFF ! Best Solution for any Newbie or Expert Trader! This dashboard software is working on 28 currency pairs plus one. It is based on 2 of our main indicators (Advanced Currency Strength 28 and Advanced Currency Impulse). It gives a great overview of the entire Forex market plus Gold or 1 indices. It shows Advanced Currency Strength values, currency speed of movement and signals for 28 Forex pairs in all (9) timeframes. Imagine how your trading will improve when you can watch the e
      Trading System Double Trend - an independent trading system consisting of several indicators. Determines the direction of the general trend and gives signals in the direction of price movement. Can be used for scalping, intraday or weekly trading. Features Works on any time frames and trading instruments (forex, cryptocurrencies, metals, stocks, indices.) Simple visual reading of information that does not load the chart The indicator does not repaint and does not complete signals Works only wh
      Dynamic Forex28 Navigator
      Bernhard Schweigert
      5 (6)
      Specials Discount now. The Next Generation Forex Trading Tool. Dynamic Forex28 Navigator is the evolution of our long-time, popular indicators, combining the power of three into one: Advanced Currency Strength28 Indicator (695 reviews) + Advanced Currency IMPULSE with ALERT (520 reviews) + CS28 Combo Signals (recent Bonus) Details about the indicator  https://www.mql5.com/en/blogs/post/758844 What Does The Next-Generation Strength Indicator Offer? Everything you loved about the originals, now
      FX Volume
      Daniel Stein
      4.6 (35)
      FX Volume: Experience Genuine Market Sentiment from a Broker’s Perspective Quick Overview Looking to elevate your trading approach? FX Volume provides real-time insights into how retail traders and brokers are positioned—long before delayed reports like the COT. Whether you’re aiming for consistent gains or simply want a deeper edge in the markets, FX Volume helps you spot major imbalances, confirm breakouts, and refine your risk management. Get started now and see how genuine volume data can
      Gold Stuff
      Vasiliy Strukov
      4.85 (262)
      Gold Stuff is a trend indicator designed specifically for gold and can also be used on any financial instrument. The indicator does not redraw and does not lag. Recommended time frame H1. At it indicator work full auto  Expert Advisor EA Gold Stuff. You can find it at my profile. Contact me immediately after the purchase to get   personal bonus!  You can get a free copy of our Strong Support and Trend Scanner indicator, please pm. me! Settings  and manual here  Please note that I do not sell my
      Volatility Trend System - a trading system that gives signals for entries. The volatility system gives linear and point signals in the direction of the trend, as well as signals to exit it, without redrawing and delays. The trend indicator monitors the direction of the medium-term trend, shows the direction and its change. The signal indicator is based on changes in volatility and shows market entries. The indicator is equipped with several types of alerts. Can be applied to various trading ins
      IQ Gold Gann Levels a non-repainting, precision tool designed exclusively for XAUUSD/Gold intraday trading. It uses W.D. Gann’s square root method to plot real-time support and resistance levels, helping traders spot high-probability entries with confidence and clarity. William Delbert Gann (W.D. Gann) was an exceptional market analyst, whose trading technique was based on a complex blend of mathematics, geometry, astrology, and ancient mathematics which proved to be extremely accurate. Download
      Currency Strength Wizard is a very powerful indicator that provides you with all-in-one solution for successful trading. The indicator calculates the power of this or that forex pair using the data of all currencies on multiple time frames. This data is represented in a form of easy to use currency index and currency power lines which you can use to see the power of this or that currency. All you need is attach the indicator to the chart you want to trade and the indicator will show you real str
      Predictive Levels
      Satya Prakash Mishra
      Market predictive price levels are key technical analysis tools is my finest invention through mathematics to predict automatically next price is where to reach after break any levels. A unique name quality it automatically calculate price range its my own invention according price value to predict what's is next price came than after it not fixed levels like Fibonacci or pivots Its Naveen's Predictive Levels .used to forecast where an asset's price might find support (stop falling) or resistanc
      PZ Mean Reversion MT4
      PZ TRADING SLU
      3 (4)
      Outperform traditional strategies: effective mean reversion for savvy traders Unique indicator that implements a professional and quantitative approach to mean reversion trading. It capitalizes on the fact that the price diverts and returns to the mean in a predictable and measurable fashion, which allows for clear entry and exit rules that vastly outperform non-quantitative trading strategies. [ Installation Guide | Update Guide | Troubleshooting | FAQ | All Products ] Clear trading signals Am
      Auto Optimized RSI
      Davit Beridze
      5 (1)
      Auto Optimized RSI is a smart and easy-to-use arrow indicator designed for precision trading. It automatically finds the most effective RSI Buy and Sell levels for your selected symbol and timeframe using real historical data simulations. The indicator can be used as a standalone system or as part of your existing trading strategy. It is especially useful for intraday trading. Unlike traditional RSI indicators that rely on fixed 70/30 levels, Auto Optimized RSI dynamically adjusts its levels bas
      Cycle Maestro
      Stefano Frisetti
      1 (1)
      If a new green  NOTE: CYCLEMAESTRO is distributed only on this website, there are no other distributors. Demo version is for reference only and is not supported. Full versione is perfectly functional and it is supported CYCLEMAESTRO , the first and only indicator of Cyclic Analysis, useful for giving signals of TRADING, BUY, SELL, STOP LOSS, ADDING. Created on the logic of  Serghei Istrati  and programmed by  Stefano Frisetti ;  CYCLEMAESTRO  is not an indicator like the others, the challenge wa
      Hydra Trend Rider is a non-repainting, multi-timeframe trend indicator that delivers precise buy/sell signals and real-time alerts for high-probability trade setups. With its color-coded trend line, customizable dashboard, and mobile notifications, it's perfect for traders seeking clarity, confidence, and consistency in trend trading. Download the Metatrader 5 Version Read the User Manual here. HURRY!   FLASH SALE is  ON . Price  increasing soon! Read the product description carefully before pur
      CURRENTLY 26% OFF Best Solution for any Newbie or Expert Trader! This Indicator is a unique, high quality and affordable trading tool because we have incorporated a number of proprietary features and a new formula. With only ONE chart you can read Currency Strength for 28 Forex pairs! Imagine how your trading will improve because you are able to pinpoint the exact trigger point of a new trend or scalping opportunity? User manual: click here That's the first one, the original! Don't buy a worthle
      Algo Pumping MT4
      Ihor Otkydach
      4.93 (14)
      PUMPING STATION – Your Personal All-inclusive strategy Introducing PUMPING STATION — a revolutionary Forex indicator that will transform your trading into an exciting and effective activity! This indicator is not just an assistant but a full-fledged trading system with powerful algorithms that will help you start trading more stable! When you purchase this product, you also get FOR FREE: Exclusive Set Files: For automatic setup and maximum performance. Step-by-step video manual: Learn how to tra
      Splash
      Pavel Verveyko
      The indicator identifies the most suitable moment for entering the market in terms of market volatility, when the market has the strength to move (the signal is indicated by an arrow under the candle). For each of the signals, the presence of trends on the current and higher timeframes is determined, so that the signal is in the direction of the majority of positions opened on the market (denoted near the signal by abbreviations of timeframes with a trend present). The signal appears after the c
      Scientific trade
      Aleksey Ivanov
      5 (1)
      An extremely convenient indicator that truly makes the process of making money on the exchange easy. It is based on the scientifically rigorous theory of the market developed by the author, the beginning of which is presented here .                The full algorithm of this indicator operation is presented in the article .               The indicator calculates the most probable price movement trajectory and displays it on the chart. Based on the predicted price movement trajectory
      TPSpro RFI Levels
      Roman Podpora
      4.85 (27)
      Reversal zones - levels / Active zones of a major player INSTRUCTIONS RUS   /   INSTRUCTIONS   ENG   /   Version MT5 EVERY BUYER OF THIS INDICATOR       GET ADDITIONALLY   FOR FREE   : 3 months access       to trading signals from the service       SUPER SIGNALS       — ready-made entry points according to the TPSproSYSTEM algorithm. 3 months access       to training materials with regular updates - immersion in strategy and professional growth. 24/5 support on weekdays and access to a closed t
      Quantum Breakout Indicator PRO
      Bogdan Ion Puscasu
      4.96 (25)
      Introducing   Quantum Breakout PRO , the groundbreaking MQL5 Indicator that's transforming the way you trade Breakout Zones! Developed by a team of experienced traders with trading experience of over 13 years, Quantum Breakout PRO is designed to propel your trading journey to new heights with its innovative and dynamic breakout zone strategy. Quantum Breakout Indicator will give you signal arrows on breakout zones with 5 profit target zones and stop loss suggestion based on the breakout box. I
      Upper and Lower Reversal - Early forecasting system for reversal points. Allows you to find price reversal points on the boundaries of the upper and lower price movement channels. The indicator will never repaint or change the position of the signal arrows. Red arrows are a buy signal, Blue arrows are a sell signal. Adapts to any time frames and trading instruments The indicator does not repaint, it works only when the candle closes. There are several types of alerts for signals The indicator i
      2 copies left at $65, next price is $120 Scalper System is a user-friendly indicator designed to detect market consolidation zones and anticipate breakout movements. Optimized for the M1 or M15 timeframe, it performs best on highly volatile assets like gold (XAUUSD). Although originally designed for the M1 or M15 timeframe, this system performs well across all timeframes thanks to its robust, price action-based strategy. You can visually backtest the indicator to evaluate the accuracy of its si
      PRO Renko System
      Oleg Rodin
      5 (27)
      PRO Renko System is a highly accurate trading system specially designed for trading RENKO charts. The ARROWS and Trend Indicators DO NOT REPAINT! The system effectively neutralizes so called market noise giving you access to accurate reversal signals. The indicator is very easy to use and has only one parameter responsible for signal generation. You can easily adapt the tool to any trading instrument of your choice and the size of the renko bar. I am always ready to provide extra support to help
      M1 Arrow
      Oleg Rodin
      5 (19)
      M1 Arrow is an indicator which is based on natural trading principles of the market which include volatility and volume analysis. The indicator can be used with any time frame and forex pair. One easy to use parameter in the indicator will allow you to adapt the signals to any forex pair and time frame you want to trade. The Arrows DO NOT REPAINT and DO NOT LAG! The algorithm is based on the analysis of volumes and price waves using additional filters. The intelligent algorithm of the indicator
      Advanced Currency IMPULSE with ALERT
      Bernhard Schweigert
      4.91 (485)
      CURRENTLY 31% OFF !! Best Solution for any Newbie or Expert Trader! This indicator is a unique, high quality and affordable trading tool because we have incorporated a number of proprietary features and a secret formula. With only ONE chart it gives Alerts for all 28 currency pairs. Imagine how your trading will improve because you are able to pinpoint the exact trigger point of a new trend or scalping opportunity! Built on new underlying algorithms it makes it even easier to identify and confir
      More from author
      Berma Bands
      Muhammad Elbermawi
      5 (6)
      The Berma Bands (BBs) indicator is a valuable tool for traders seeking to identify and capitalize on market trends. By analyzing the relationship between the price and the BBs, traders can discern whether a market is in a trending or ranging phase. Visit the [ Berma Home Blog ] to know more. Berma Bands are composed of three distinct lines: the Upper Berma Band, the Middle Berma Band, and the Lower Berma Band. These lines are plotted around the price, creating a visual representation of the pric
      True Direction Oscillator
      Muhammad Elbermawi
      4.86 (361)
      Or (TDO)  which is an index that measures the price rate of change using the principle of " Pure Momentum ". When a security price advances from 10 to 15 then the price rate of change is 150% but when it declines back from 15 to 10 then the price rate of change is 33.3% only. That is why technical analysis indicators like "Price Rate of Change" (ROC) or "Momentum" give higher readings for ascending price movements than those given to descending ones. TDO fixes this problem to help traders at rea
      Bermaui Deviation Percent
      Muhammad Elbermawi
      4.94 (111)
      Or ( BD% ) which is a volatility index that measures volatility in percent rather than points. The idea of BD% is to make an index depending on the Classic Standard Deviation (CSD) that moves between 0 and 100 percent. You can use BD% to compare volatility for the same security in different time periods or different time-frames. In addition, you can use BD% to compare volatility between different securities in different markets in terms of percent rather than points. HOW TO USE "BD%" If BD%
      MASR Bands
      Muhammad Elbermawi
      5 (5)
      Or M oving A verage S upport R esistance Bands . MASR Bands indicator is a moving average surrounded by two bands that work together as support and resistance levels. Statistically, MASR Bands contain price candles 93% of the time. Here is how it is calculated in steps: 1. The first step is to calculate the highest high (HHV) and the lowest low (LLV) for an X period of time. 2. The second step is to divide HHV by LLV to get how wide is the distance between them as a percentage. I call the resu
      Classic Keltner Channel
      Muhammad Elbermawi
      4.87 (30)
      Or CKC. This indicator works depending on the classic ten-day moving average rule described by Chester W. Keltner (1909–1998). All parameters are set to the classic version of the Keltner system by default, while the user can change them if he wants. Important Information    Read CKC Manual:   https://www.mql5.com/en/blogs/post/736577    CKC Expert Advisor Example:   https://www.mql5.com/en/blogs/post/734150 About Keltner Channel Formula 1. Calculate the Center Line as a simple moving average
      Bermaui RSI Candles
      Muhammad Elbermawi
      5 (4)
      The idea of this indicator is to draw RSI in the form of candles that can be compared with price charts to generate buy and sell signals. The indicator is not my invention. I founded it on the internet several years ago. I updated the code, added alert functions, added the Bermaui Utilities group of tools. The indicator calculates the RSI of all the prices that are used to draw candlesticks (RSI of the open, high, low & close). It uses the highest of them to draw the RSI candles high wick & the
      Bermaui Manual EA
      Muhammad Elbermawi
      5 (10)
      This is a semi-automatic expert advisor that trades the grid system. The idea is to gradually take different positions in the market, then to calculate the break-even level for them. When the prices pass this break-even by a predetermined distance all opened orders are closed. Important Information Here is the user's guide:   https://www.mql5.com/en/blogs/post/730567 You can try this EA with any of my other products, here:    https://www.mql5.com/en/users/bermaui314/seller Important Features T
      Moving Average Cloud
      Muhammad Elbermawi
      4.92 (13)
      Or "MAC". This is an indicator designed to help you capture and trade the trend. The idea behind this indicator can be explained in the next steps: Draw a fast-moving average Envelope. Draw a slow-moving average Envelope. The MAC Upper Band is the highest value between the high of both Envelopes. The MAC Lower Band is the lowest value between the low of both Envelopes. The MAC Histogram Cloud fills the distance between two bands to show you change in direction. Blue Cloud indicates the uptrend
      Bermaui Pin Bars
      Muhammad Elbermawi
      5 (13)
      Bermaui Pin Bars   Or (BPB) is an indicator that finds Pin Bars price action pattern on the chart. Pin Bars is a shortcut for "Pinocchio Bars" which is a classic bar pattern alternative to Japanese candlesticks with tall upper or lower shadows and very small bodies like Hammer, Inverted-Hammer, Hanging Man, Shooting Star, Dragon Fly Doji or Grave Stone Doji. Bermaui Pin Bars indicator find this pattern depending on a formula that can be explained in the next steps: At first BPB calculate the ce
      Bermaui Channel
      Muhammad Elbermawi
      5 (19)
      This is a price channel that shows five important price levels on the chart. Those levels are: 1. The Highest High (HH) of the previous x bars. 2. The Highest Low (HL) of the previous x bars. 3. The Center Line. 4. The Lowest High (LH) of the previous x bars. 5. The Lowest Low (LL) of the previous x bars. How does Bermaui Channels Captures Overbought  area Think of the distance between HH and HL levels as an overbought area. When the price candles or bars crosses the HL to the upside this indica
      Filter:
      Yusuf Hamzah
      806
      Yusuf Hamzah 2024.09.08 17:42 
       

      Another one-of-a-kind innovative indicator that is based on volatility. A rare one, indeed. I vouch for this ingenuity.

      Muhammad Elbermawi
      53195
      Reply from developer Muhammad Elbermawi 2024.09.08 18:40
      You are welcome, Yusuf 💚🙏
      sultan10001
      68
      sultan10001 2024.06.30 09:32 
       

      User didn't leave any comment to the rating

      Robbert
      1073
      Robbert 2024.03.25 11:05 
       

      Very usefull indicator to follow the trend on long and short TimeFrames. The author is very helpfull with tips and tricks and this is my 3rd indicator from Mr Bermaui. Highly Recommended !!

      Muhammad Elbermawi
      53195
      Reply from developer Muhammad Elbermawi 2024.03.25 12:11
      Thanks, Robert 🙏💚
      Shimaa Kamal
      42
      Shimaa Kamal 2023.09.21 03:02 
       

      User didn't leave any comment to the rating

      Muhammad Elbermawi
      53195
      Reply from developer Muhammad Elbermawi 2023.09.21 07:33
      You are welcome, Shimaa 💚🙏
      edsonvazpingo
      138
      edsonvazpingo 2023.08.21 06:53 
       

      Hello! Would you like to make the Bermaui Bands indicator for MT5?

      Muhammad Elbermawi
      53195
      Reply from developer Muhammad Elbermawi 2023.08.21 07:02
      I will do it in the near future.
      pornchai_p
      910
      pornchai_p 2023.06.04 04:26 
       

      I bought two indicators Bermaui RSI candles and Bermaui Bands. The indicators look amazing. Kindly send me the Bermaui Stochastic and Bermaui Bands EA (Bonus). Thank you.

      Cd Vijaya Narayana
      768
      Cd Vijaya Narayana 2022.12.23 07:05 
       

      User didn't leave any comment to the rating

      Muhammad Elbermawi
      53195
      Reply from developer Muhammad Elbermawi 2022.12.23 07:48
      Thanks for the great review & stars 🙏
      davevicens
      321
      davevicens 2022.12.22 16:06 
       

      I have recently purchased the Bermaui Bands indicator, is good indicator. , i use it together with classic Ketlner channel. Excellent indicator!!!

      Muhammad Elbermawi
      53195
      Reply from developer Muhammad Elbermawi 2022.12.22 16:09
      You are welcome, my friend 🙏
      Dani Kurniawan
      271
      Dani Kurniawan 2022.08.25 10:28 
       

      good indicator

      Jedidiah Benedict
      175
      Jedidiah Benedict 2022.08.05 18:30 
       

      I really like this indicator.

      Hanxyork
      841
      Hanxyork 2022.07.30 06:35 
       

      The Bermaui Bands indicator is one of a kind, the logic behind it's construction works accordingly the reality of the markets. I am very happy with the results. Also, the author Muhammad Elbermawi, provide a world class customer service and technical support. I wish I could give 10 stars to this product but I only could find 5 stars available. Please keep up with the good work! Thank you very much Mr. Elbermawi!

      rodbizness
      84
      rodbizness 2022.06.11 01:34 
       

      Just Very incredible indicator. Thank you so much Muhammad. Very Nice Product. Much Love.

      AlbertZAR
      666
      AlbertZAR 2022.04.18 21:21 
       

      Exactly as another reviewer said, this is the perfect indicator to confirm that a trend is continuing again after a pullback on the lower timeframes - helps you stay out until the trend really gets going again. One of my favourite indicators from an awesome creator, thanks Muhammad!

      Muhammad Elbermawi
      53195
      Reply from developer Muhammad Elbermawi 2022.04.19 02:46
      You are welcome my friend 🙏 The idea of trading the Bermaui Bands on multi-time frames is interesting.
      Munch Makuchi
      1334
      Munch Makuchi 2022.04.15 05:51 
       

      Great indicator if you are looking for some sort of extra confirmation whether its to stay out of a trade due to a pair ranging or to get in. 5 Stars!

      Blin81
      171
      Blin81 2022.03.28 01:37 
       

      This is my 4th time buying the Author's work. His indicators truly have help me a lot. Thank you

      Muhammad Elbermawi
      53195
      Reply from developer Muhammad Elbermawi 2022.03.28 05:30
      I really appreciate your trust, my friend 🙏💚
      fxpat
      510
      fxpat 2022.01.08 07:14 
       

      So simple.. Easy... And accurate....

      boghrat21
      170
      boghrat21 2021.12.09 16:23 
       

      User didn't leave any comment to the rating

      jinwen2004
      198
      jinwen2004 2021.12.09 05:34 
       

      A perfect breakout identifier

      Edward Wee Beng Hui
      430
      Edward Wee Beng Hui 2021.11.20 09:02 
       

      Simple to Use!

      Eduard Gabriel Gheorghiu
      245
      Eduard Gabriel Gheorghiu 2021.11.02 14:44 
       

      I recently purchased the "Bermaui Bands" indicator. It is well worth the investment. The indicator is very good and useful.Respectfully!

      Reply to review