EasyTrade Indicator
- 指标
- Gabor Bocsak
- 版本: 1.9
- 更新: 17 五月 2024
- 激活: 10
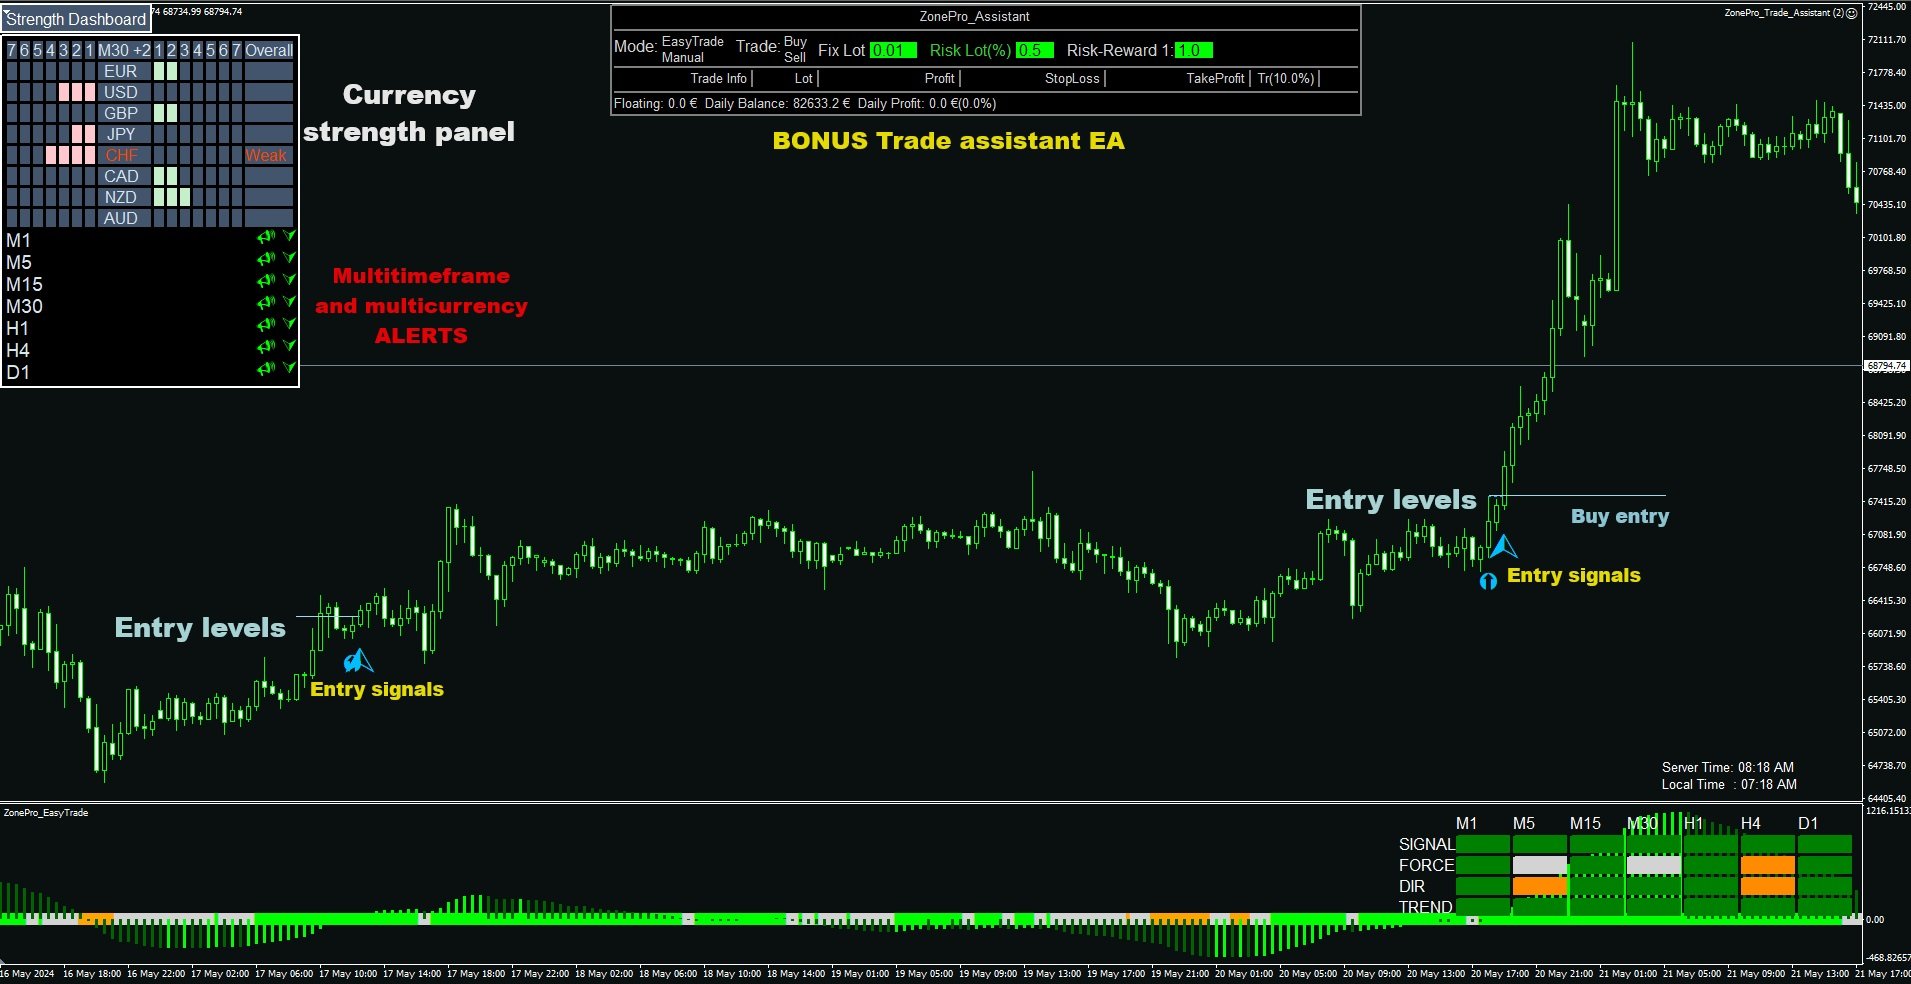
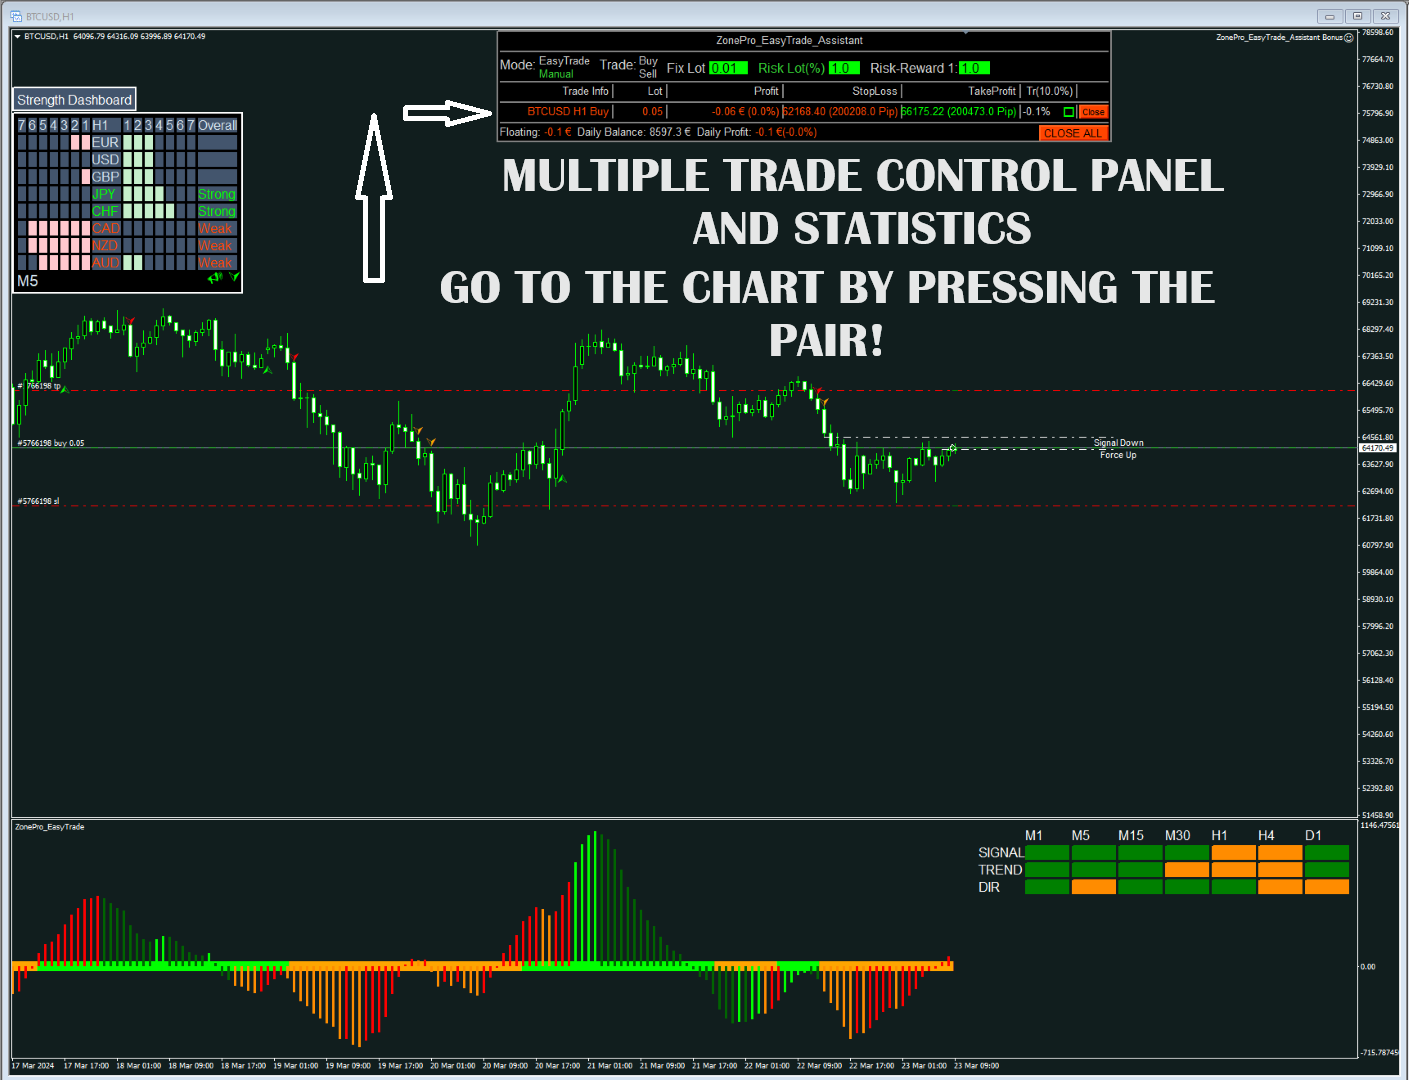
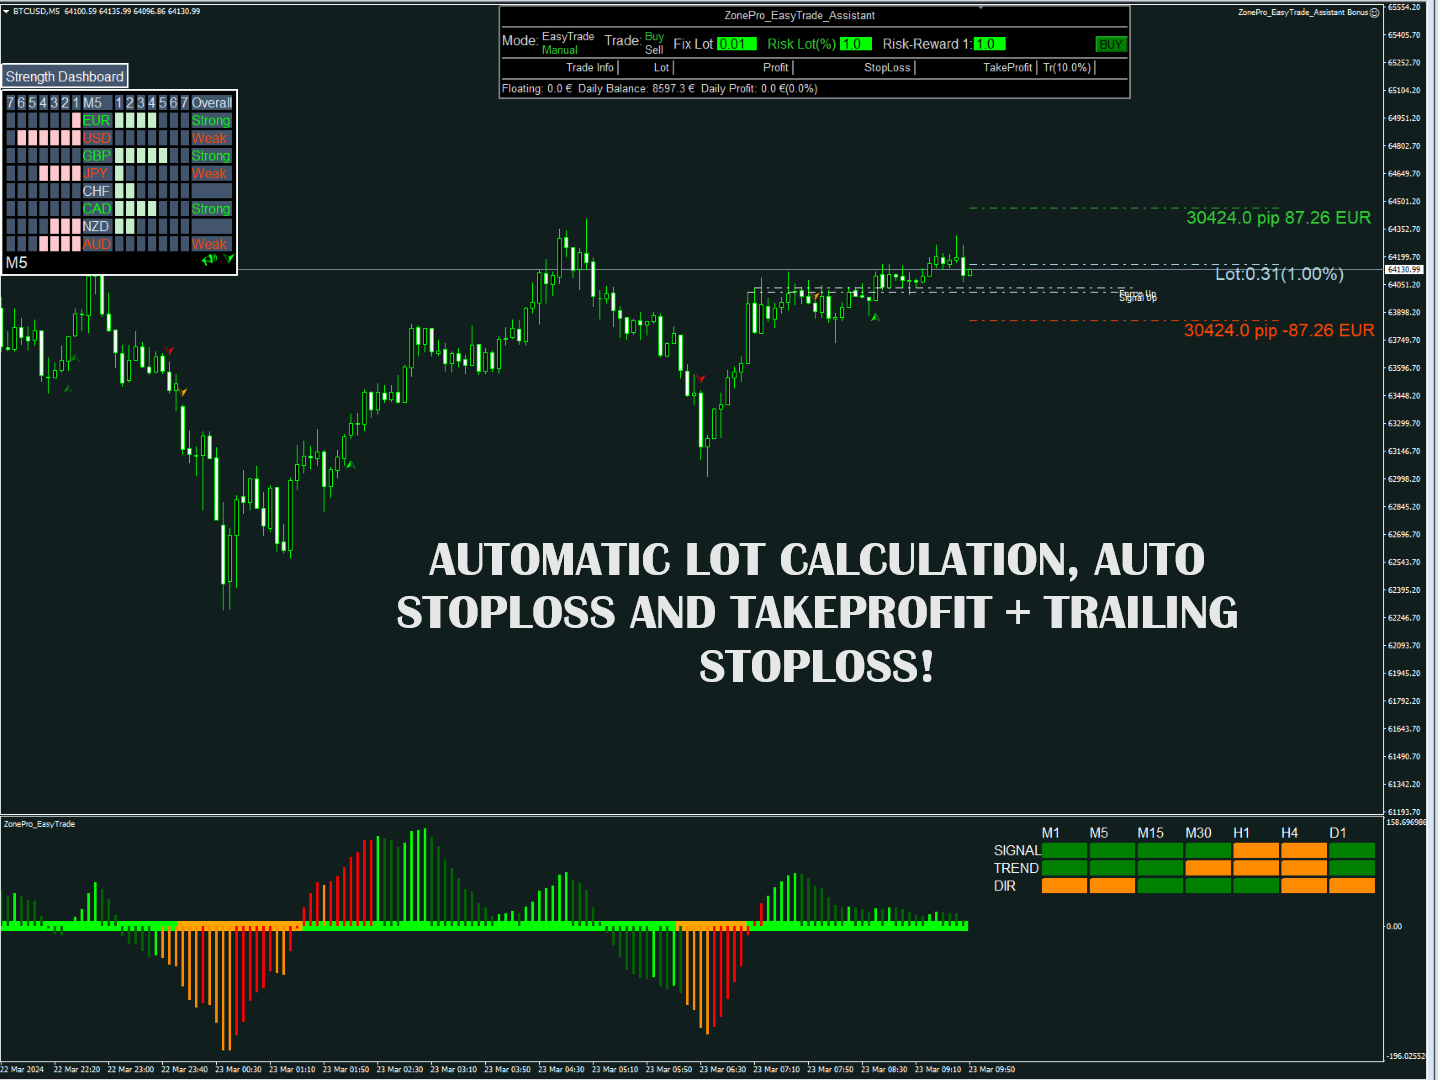
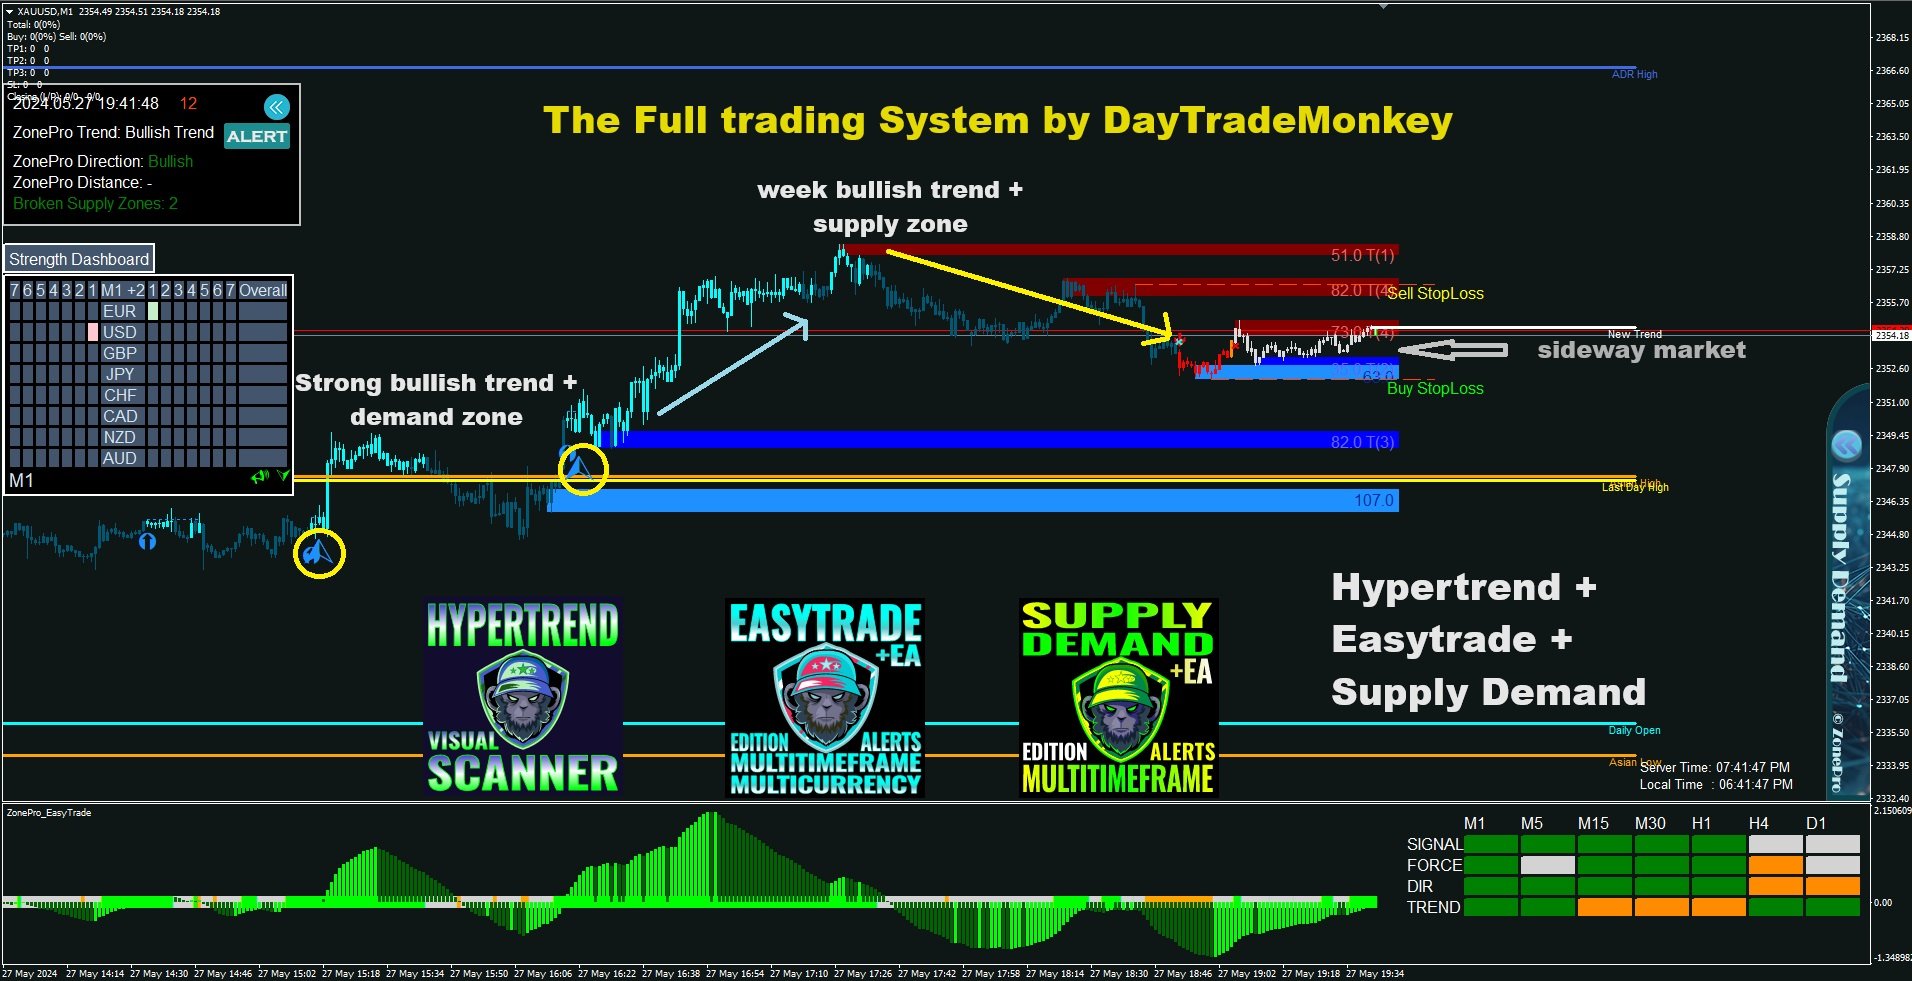
多货币和多框架买卖提醒。 自动追踪止损和风险奖励止盈! 该指标扫描并分析市场,让您无所事事! 在一张图表上交易您的所有货币!
购买后请留言联系我,我会给您发送交易助理EA。
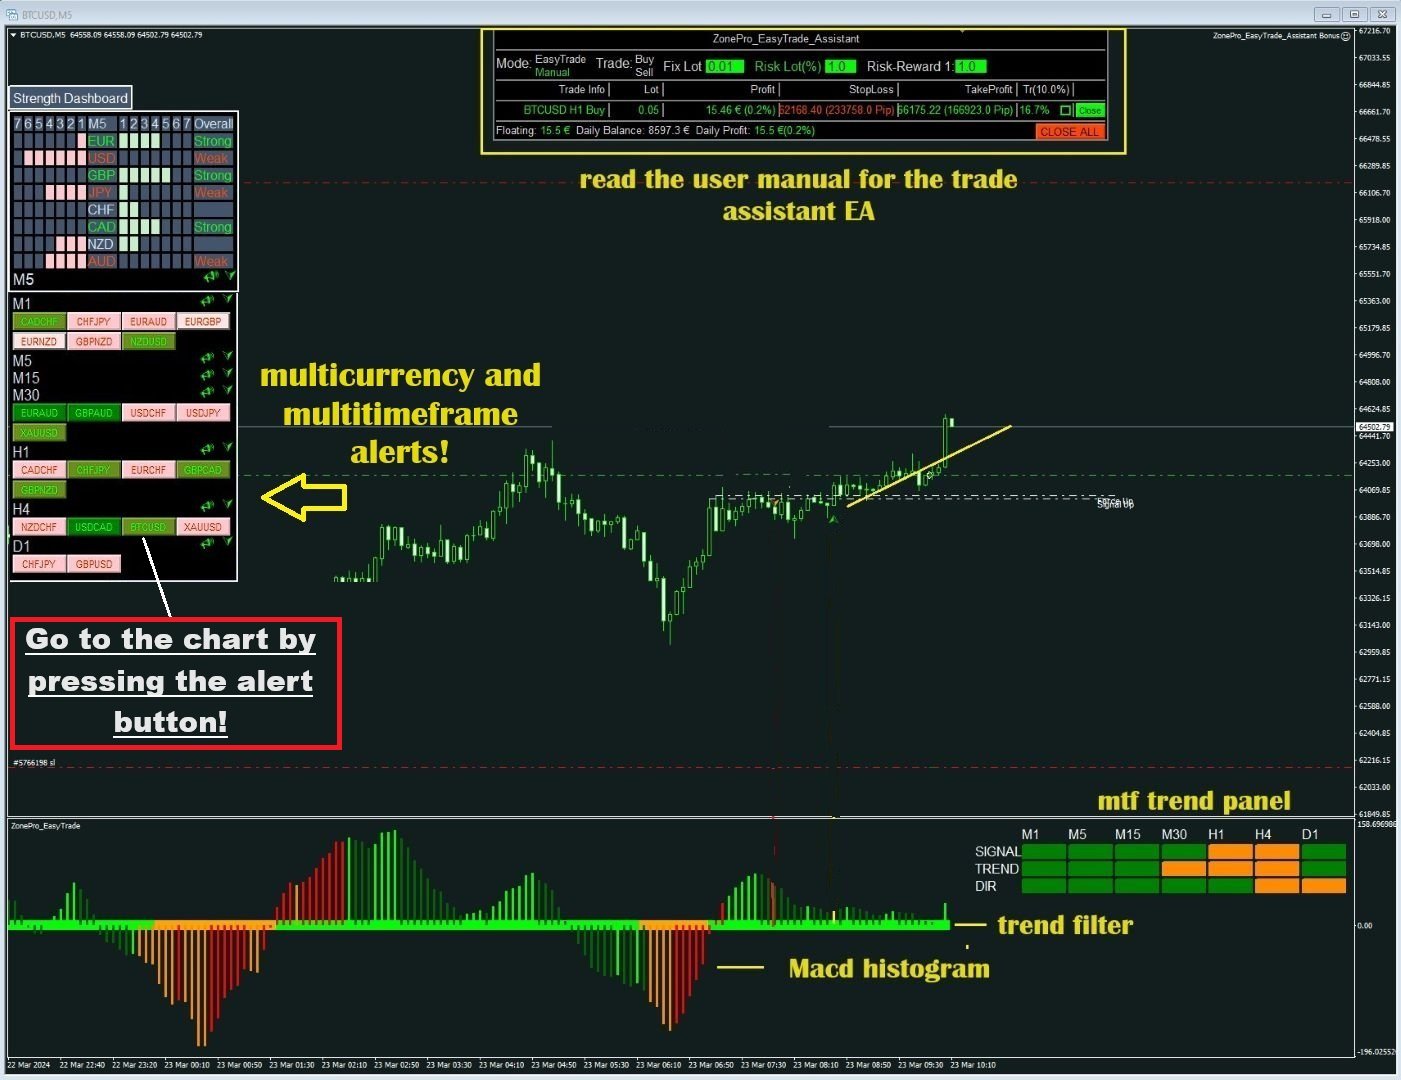
该指标使用多个振荡器和附加的过滤器来找到最佳的已确认进入点,因此您无需担心! 它会提醒您并为您选择观察的所有时间范围和货币绘制一个按钮。 只需按下按钮即可转到图表并打开交易!
该指标还为所有基础货币和市场观察货币绘制强度面板(可在设置中调整)。这将向您显示所有货币对和选择的更高时间范围。
在指标窗口中:带有趋势过滤器的特殊 MACD 直方图和图表货币的多时间框架趋势面板!
它提供所有货币和时间范围的交易警报,只需按下按钮即可转到图表!
展示:
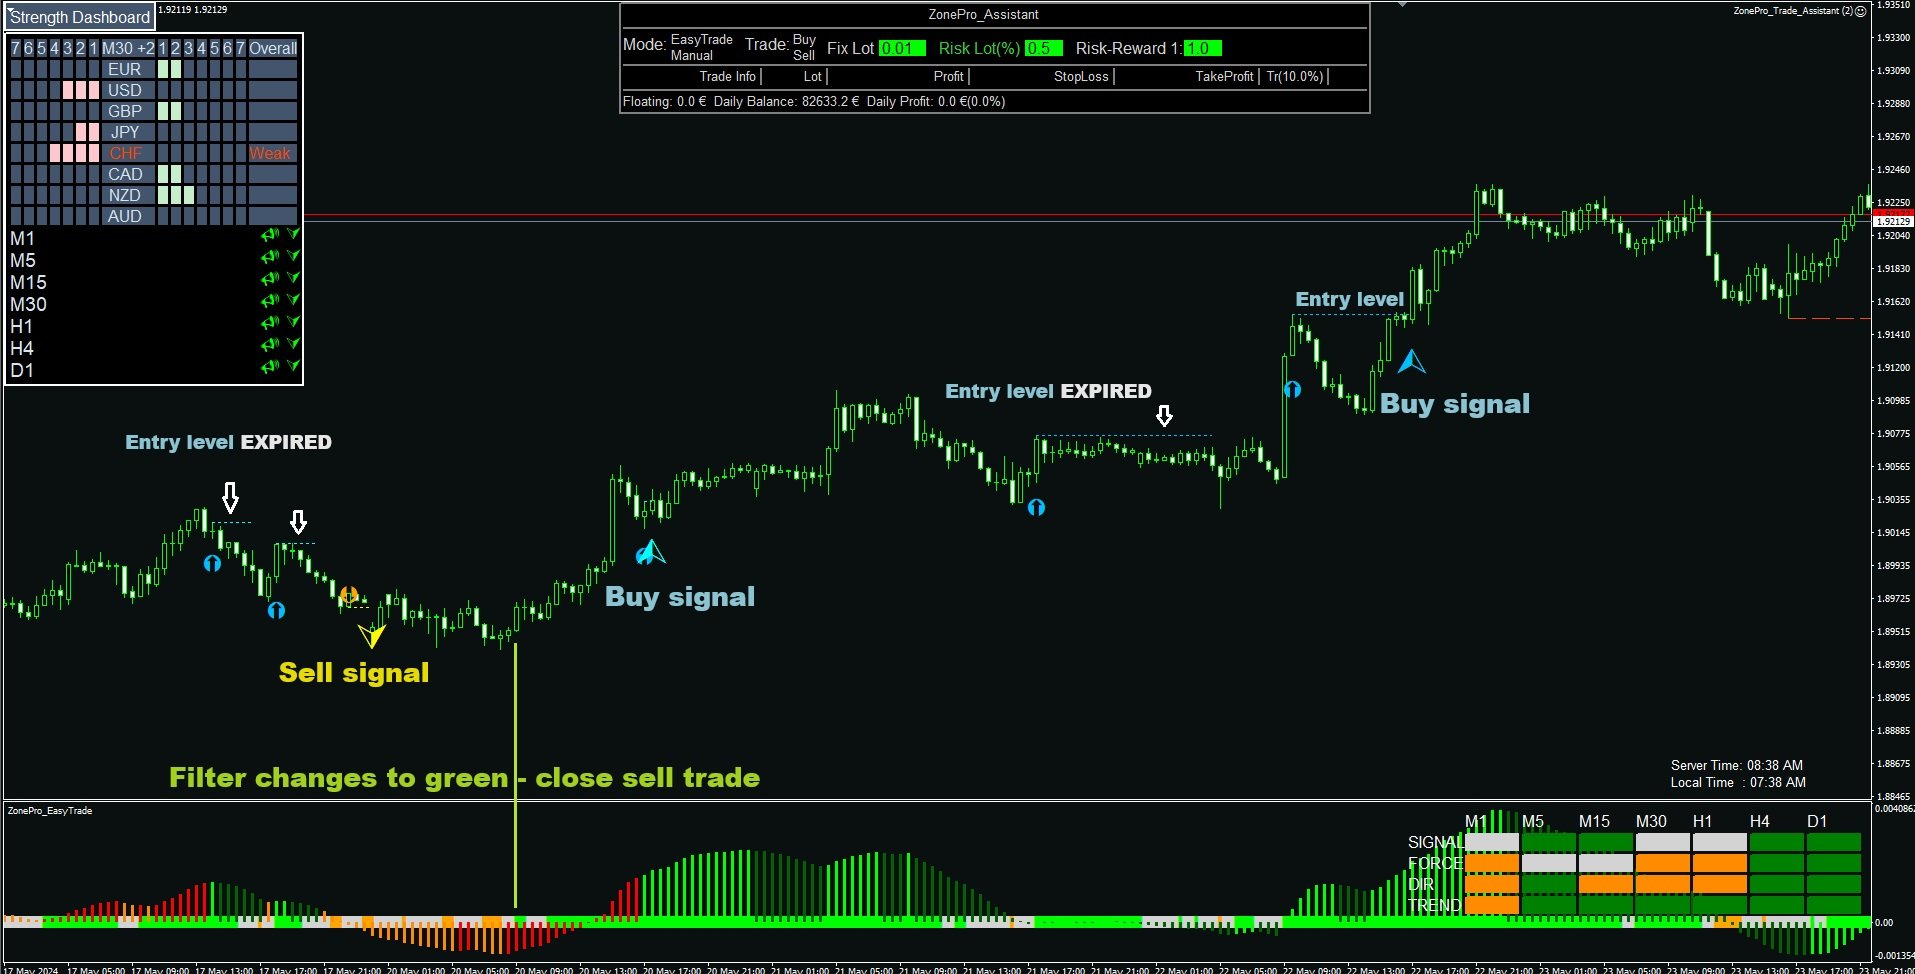
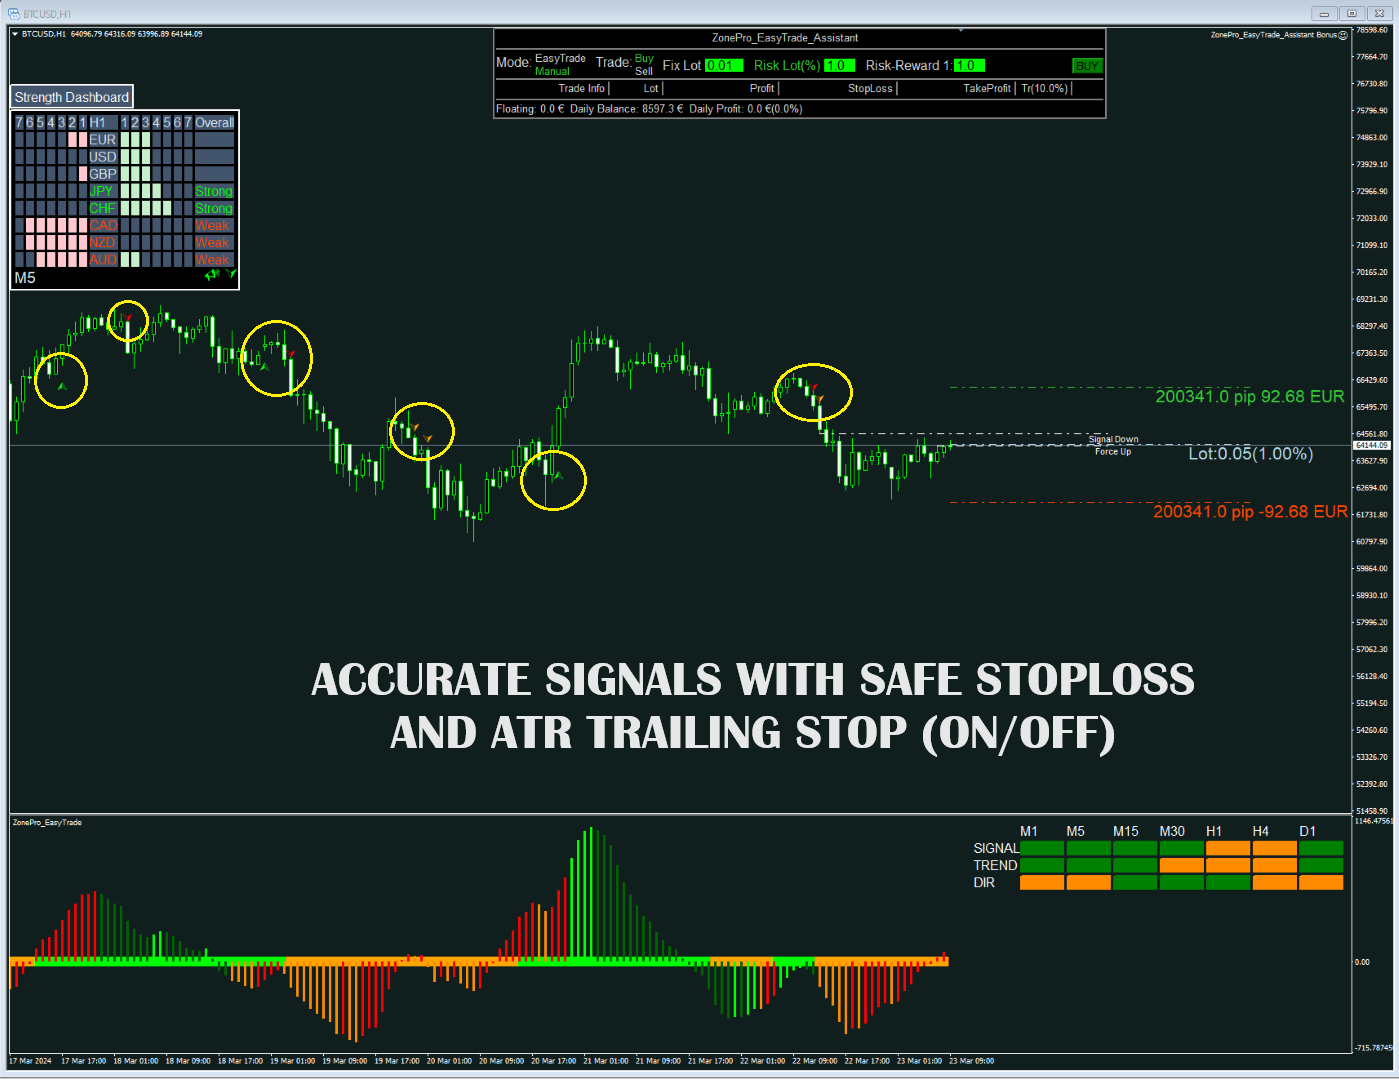
绿色箭头:买入信号
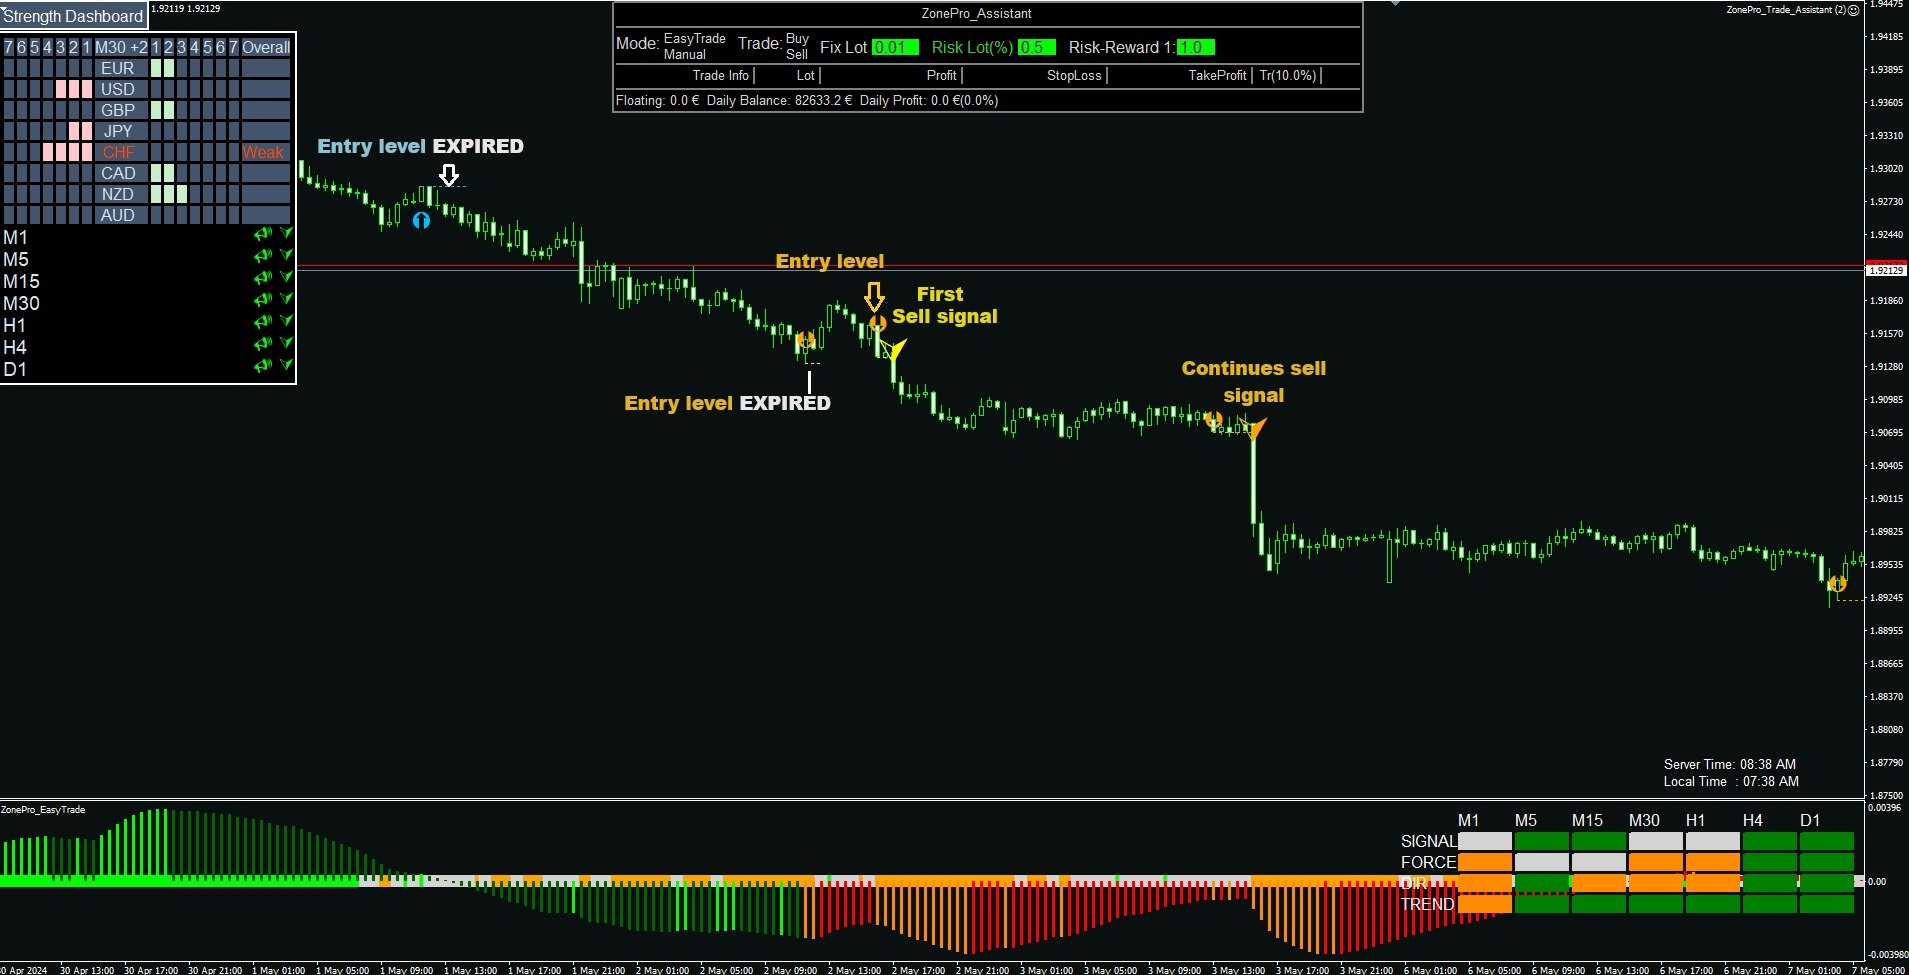
红色箭头:卖出信号
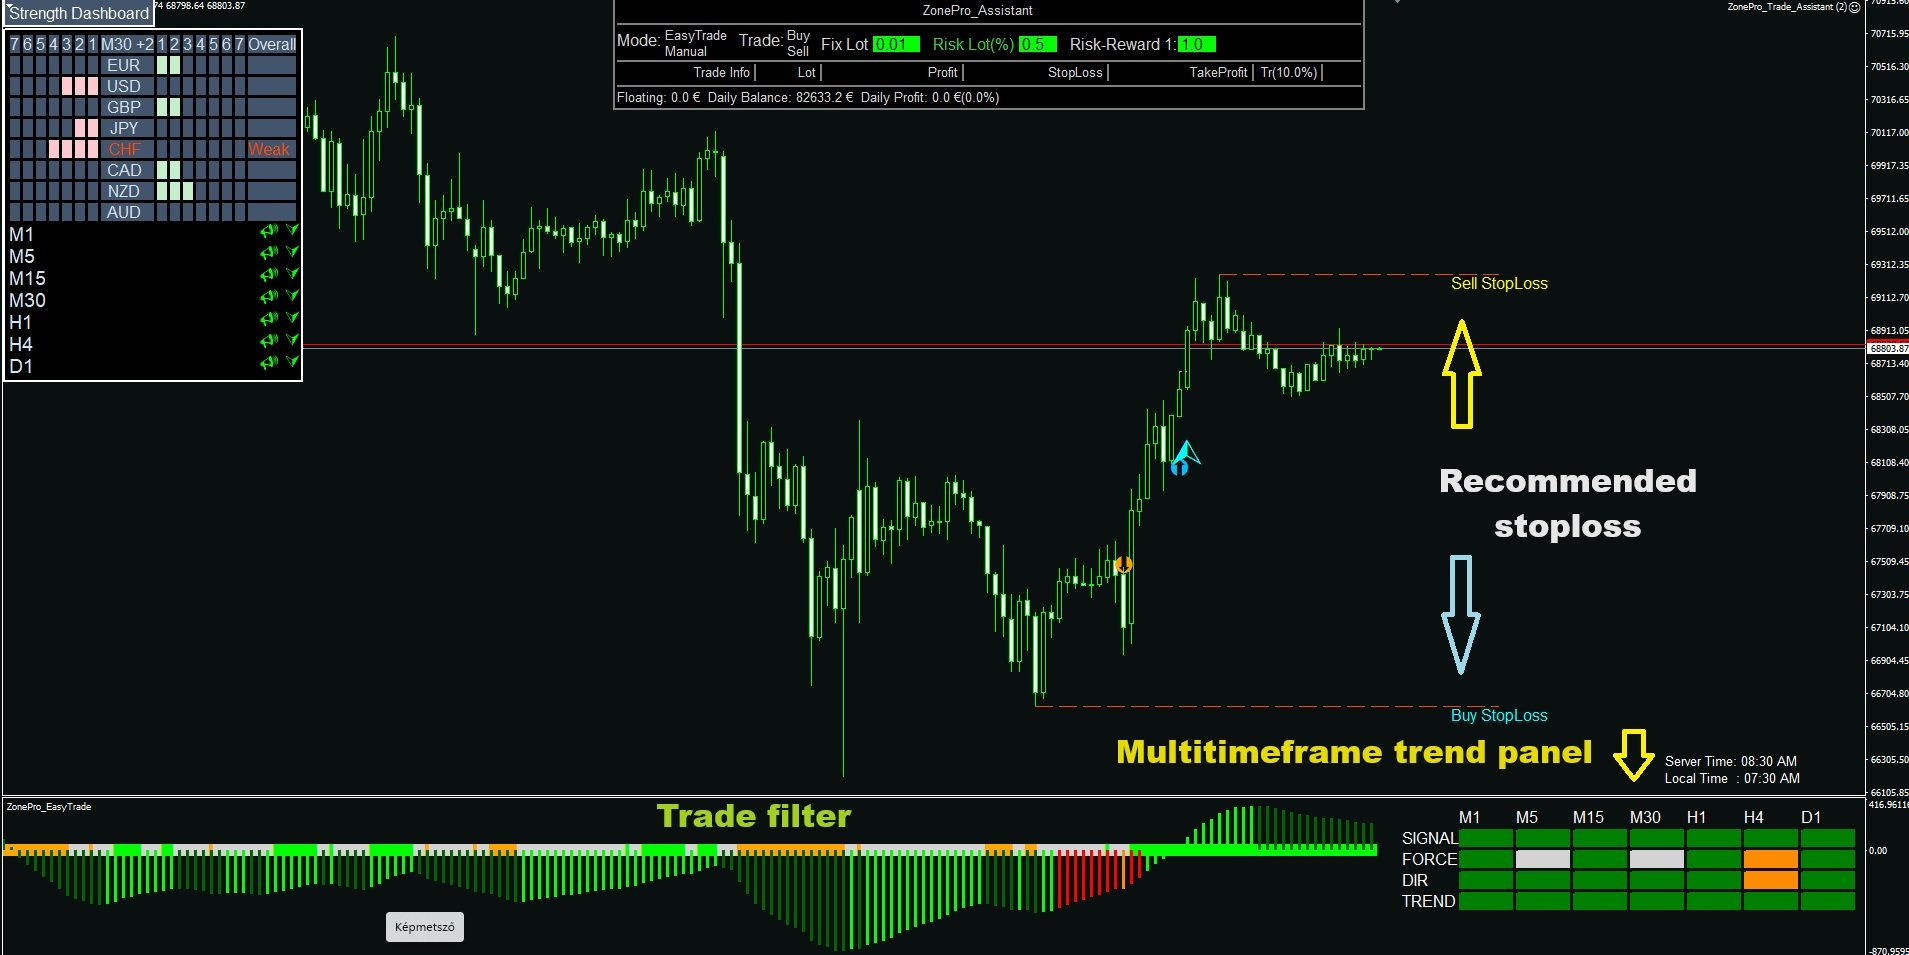
出现买入或卖出信号后,只需按 EA 上的 EASYTRADE 按钮,它就会为您提供自动计算的手数、止损和止盈!
检查指示器窗口中的过滤器,对于多头交易,它必须为绿色,对于空头交易,它必须为橙色!
Duō huòbì hé duō kuàngjià mǎimài tíxǐng. Zìdòng zhuīzōng zhǐ sǔn hé fēngxiǎn jiǎnglì zhǐ yíng! Gāi zhǐbiāo sǎomiáo bìng fēnxī shìchǎng, ràng nín wúsuǒshìshì! Zài yī zhāng túbiǎo shàng jiāoyì nín de suǒyǒu huòbì!
Gòumǎi hòu qǐng liúyán liánxì wǒ, wǒ huì gěi nín fāsòng jiāoyì zhùlǐ EA.
Gāi zhǐbiāo shǐyòng duō gè zhèndàng qì hé fùjiā de guòlǜ qì lái zhǎodào zuì jiā de yǐ quèrèn jìnrù diǎn, yīncǐ nín wúxū dānxīn! Tā huì tíxǐng nín bìng wèi nín xuǎnzé guānchá de suǒyǒu shíjiān fànwéi hé huòbì huìzhì yì gè ànniǔ. Zhǐ xū àn xià ànniǔ jí kě zhuǎn dào túbiǎo bìng dǎkāi jiāoyì!
Gāi zhǐbiāo hái wéi suǒyǒu jīchǔ huòbì hé shìchǎng guānchá huòbì huìzhì qiángdù miànbǎn (kě zài shèzhì zhōng tiáozhěng). Zhè jiāng xiàng nín xiǎnshì suǒyǒu huòbì duì hé xuǎnzé de gèng gāo shíjiān fànwéi.
Zài zhǐbiāo chuāngkǒu zhōng: Dài yǒu qūshì guòlǜ qì de tèshū MACD zhífāng tú hé túbiǎo huòbì de duō shíjiān kuàngjià qūshì miànbǎn!
Tā tígōng suǒyǒu huòbì hé shíjiān fànwéi de jiāoyì jǐngbào, zhǐ xū àn xià ànniǔ jí kě zhuǎn dào túbiǎo!
Zhǎnshì:
Lǜsè jiàntóu: Mǎi rù xìnhào
hóngsè jiàntóu: Mài chū xìnhào
chūxiàn mǎi rù huò mài chū xìnhào hòu, zhǐ xū àn EA shàng de EASYTRADE ànniǔ, tā jiù huì wèi nín tígōng zìdòng jìsuàn de shǒushù, zhǐ sǔn hé zhǐ yíng!
Jiǎnchá zhǐshì qì chuāngkǒu zhōng de guòlǜ qì, duìyú duōtóu jiāoyì, tā bìxū wèi lǜsè, duìyú kōngtóu jiāoyì, tā bìxū wèi chéngsè!
Zhuānjiā gùwèn de shèzhì:Https://Www.Mql5.Com/en/blogs/post/756792
zhuānjiā gùwèn yònghù shǒucè:Https://Www.Mql5.Com/en/blogs/post/756806


I look :)
Update.
I think its Strong, have Profit
I have rarely seen such a patient and informative salesman.
I am very grateful for his help.
I will continue to use and buy his products in the future