EasyTrade Indicator
- インディケータ
- Gabor Bocsak
- バージョン: 1.9
- アップデート済み: 17 5月 2024
- アクティベーション: 10
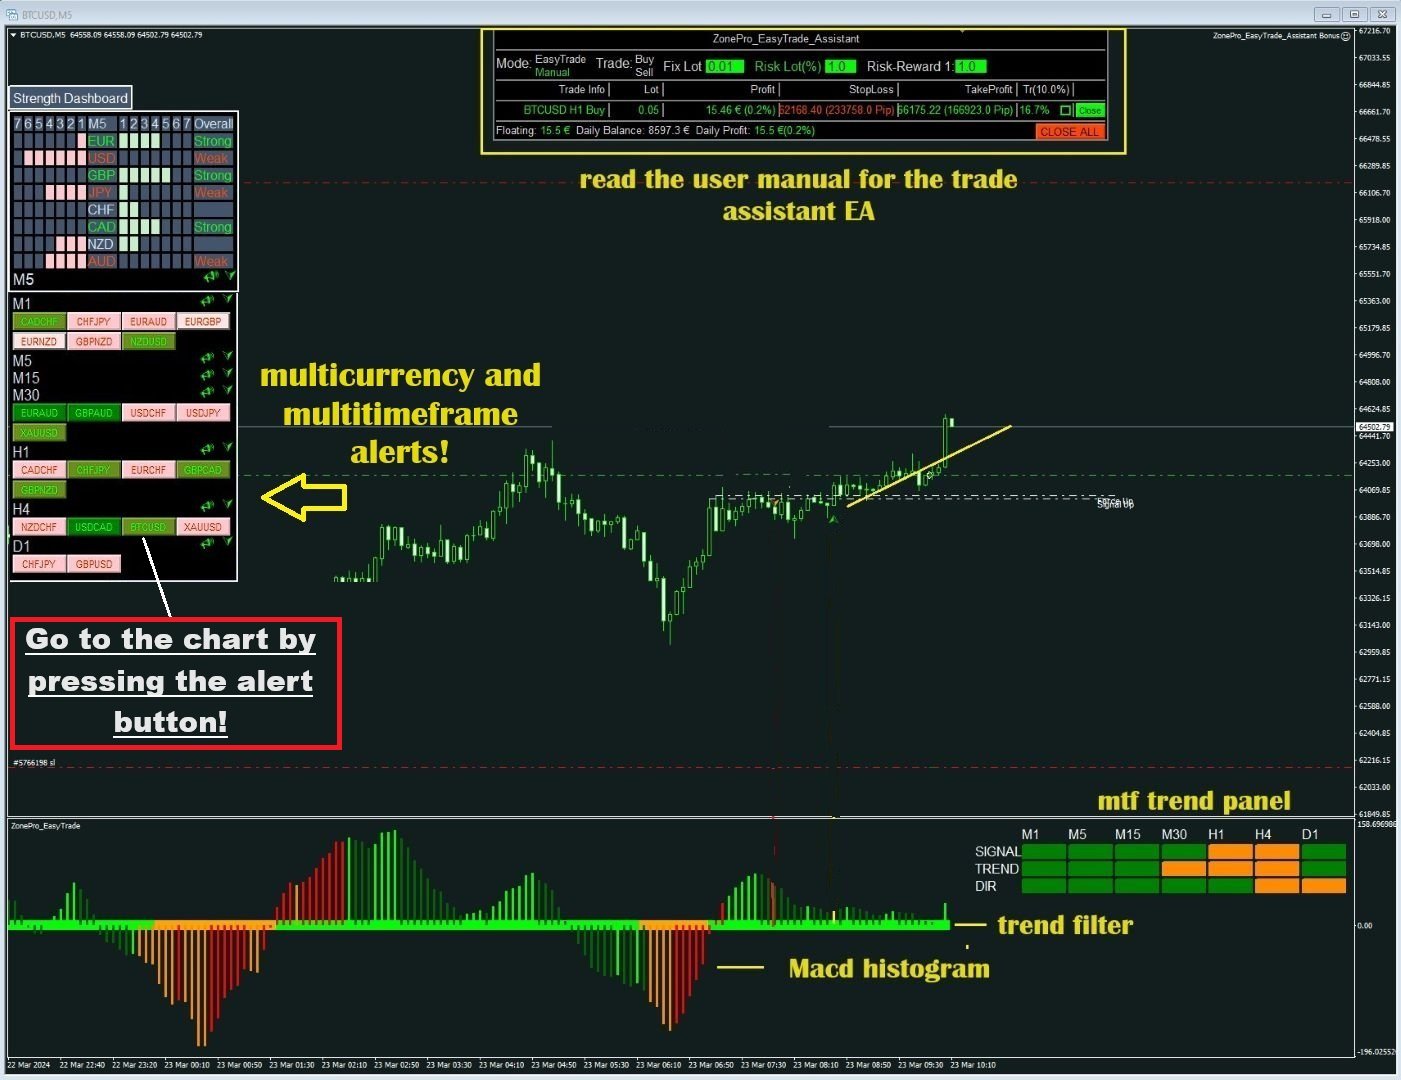
複数通貨と複数フレームの売買に関するアラート。 自動トレーリングストップとリスク報酬で利益を獲得! インジケーターが市場をスキャンして分析するため、何もする必要はありません。 1 つのチャートですべての通貨を取引しましょう!
購入後、コメントを残して私に連絡してください。トレードアシスタントEAをお送りします。
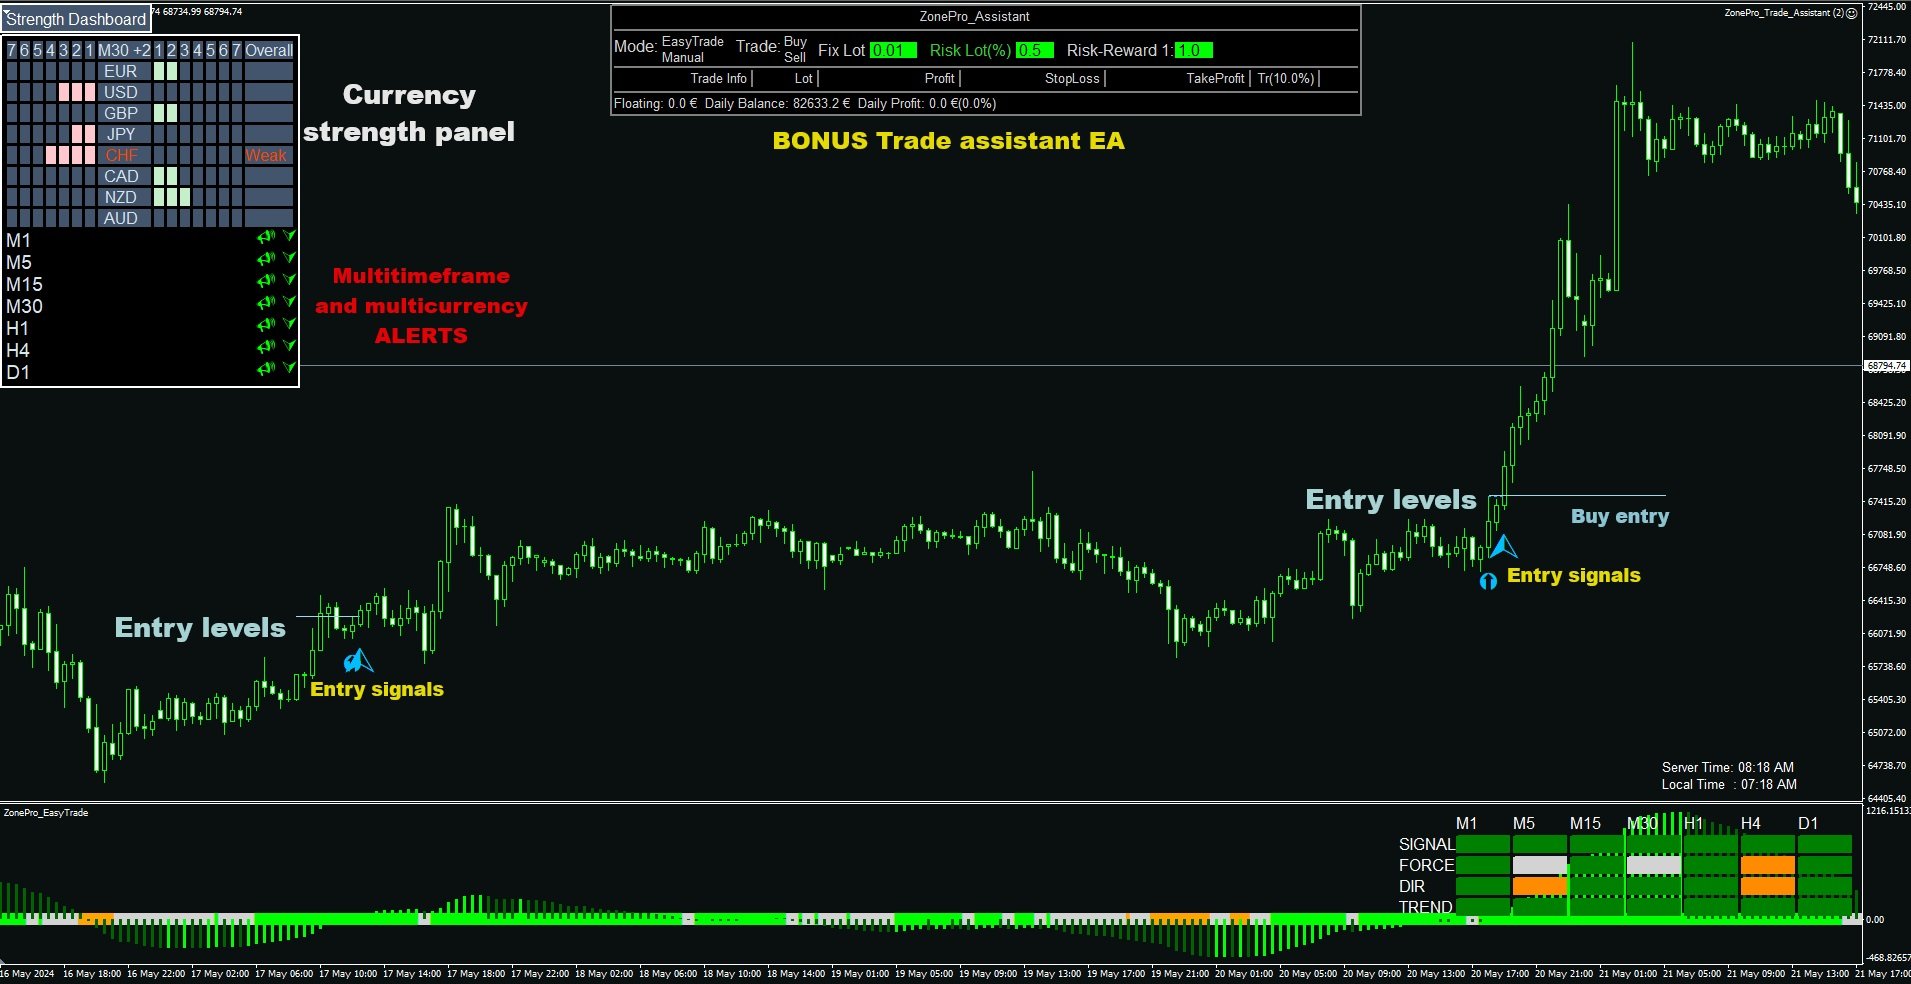
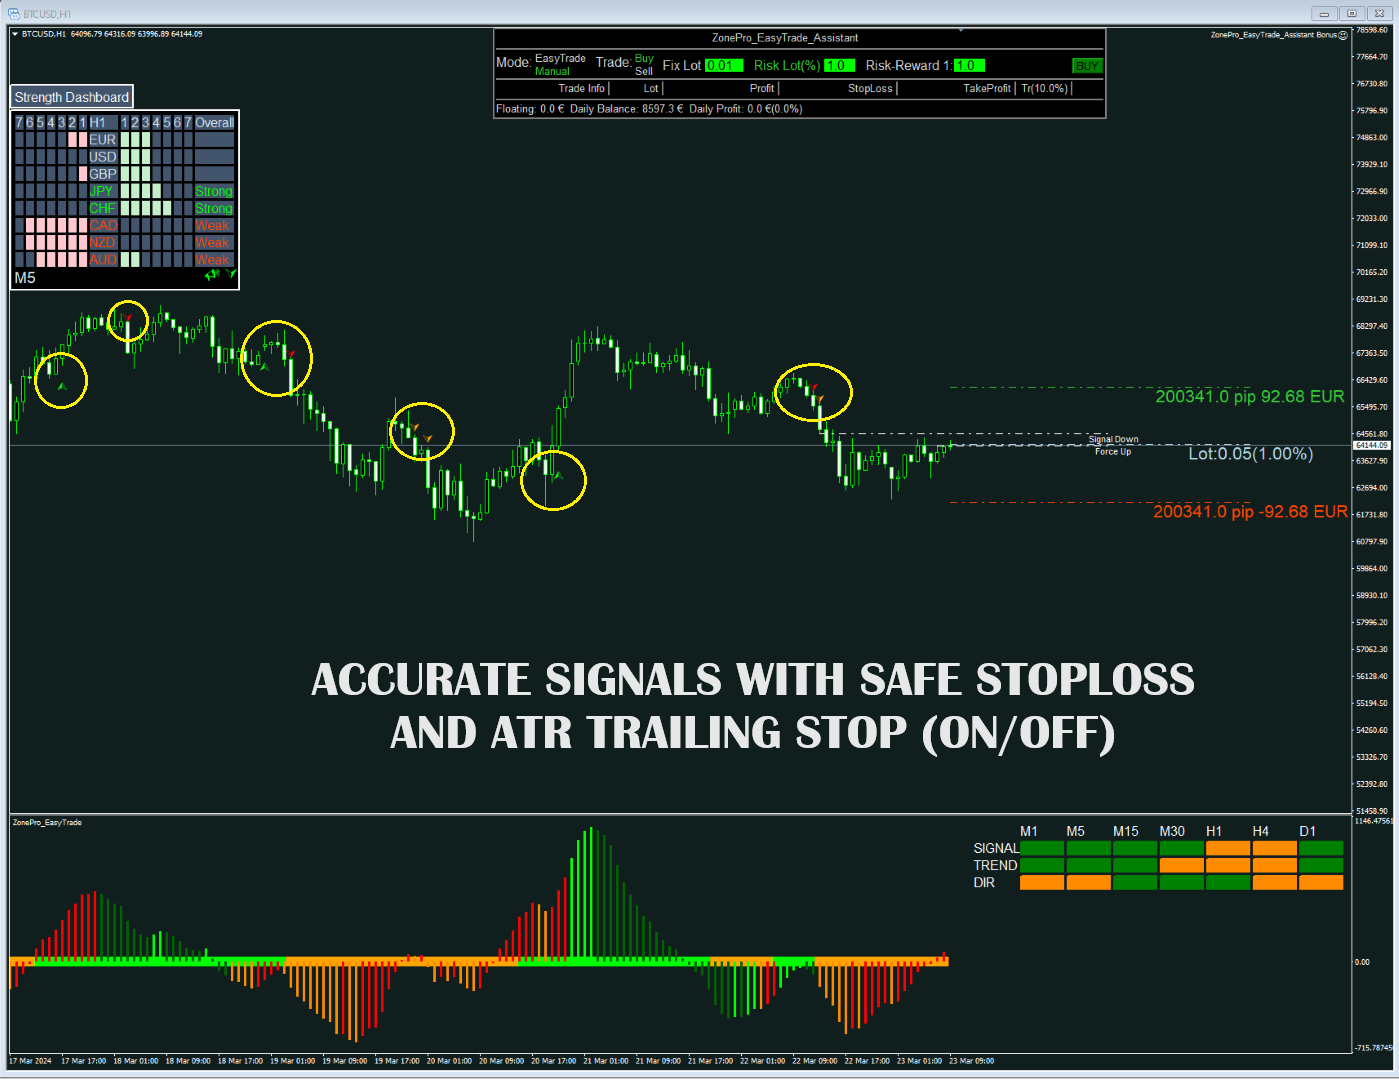
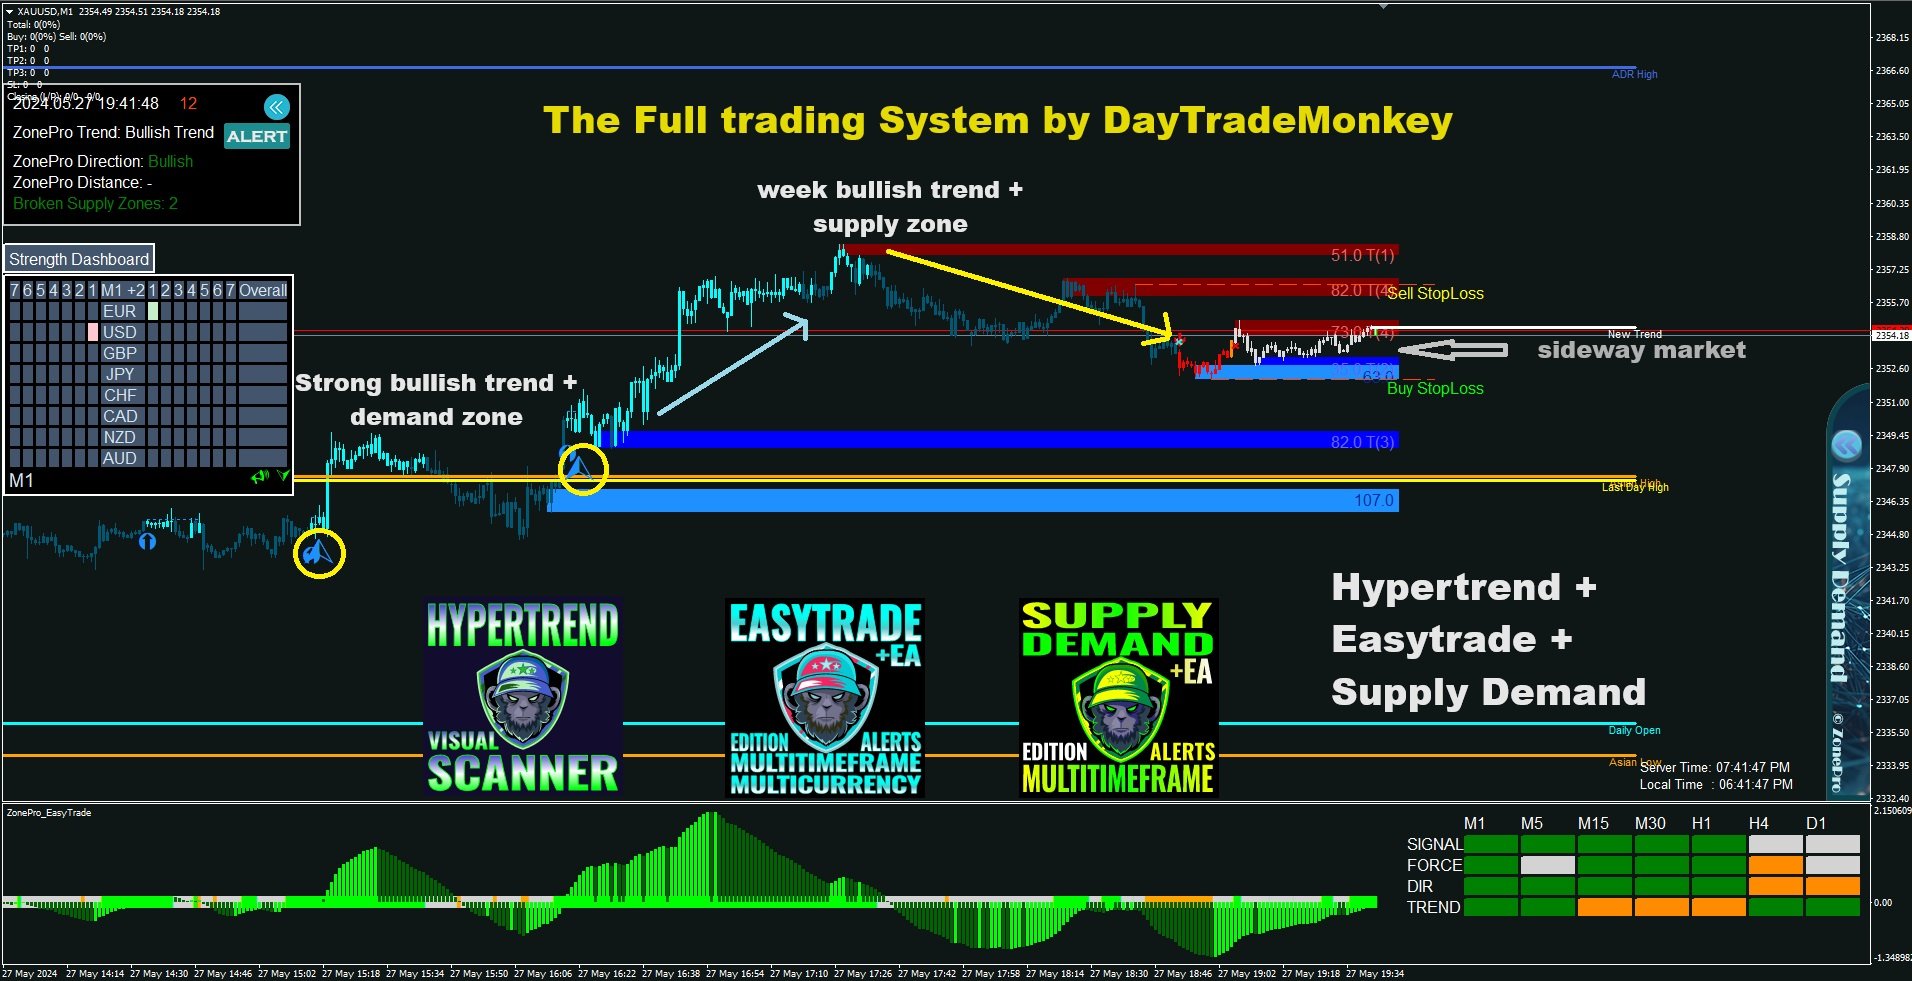
このインジケーターはいくつかのオシレーターと付属のフィルターを使用して、最良の確認されたエントリーポイントを見つけますので、それについて心配する必要はありません。 警告が表示され、監視することを選択したすべての時間枠と通貨のボタンが描画されます。 ボタンを押すだけでチャートに移動し、取引を開始できます。
このインジケーターは、すべての基本通貨と市場監視通貨の強さパネルも描画します (設定で調整可能)。これにより、すべてのペアの通貨と選択されたより高い時間枠が表示されます。
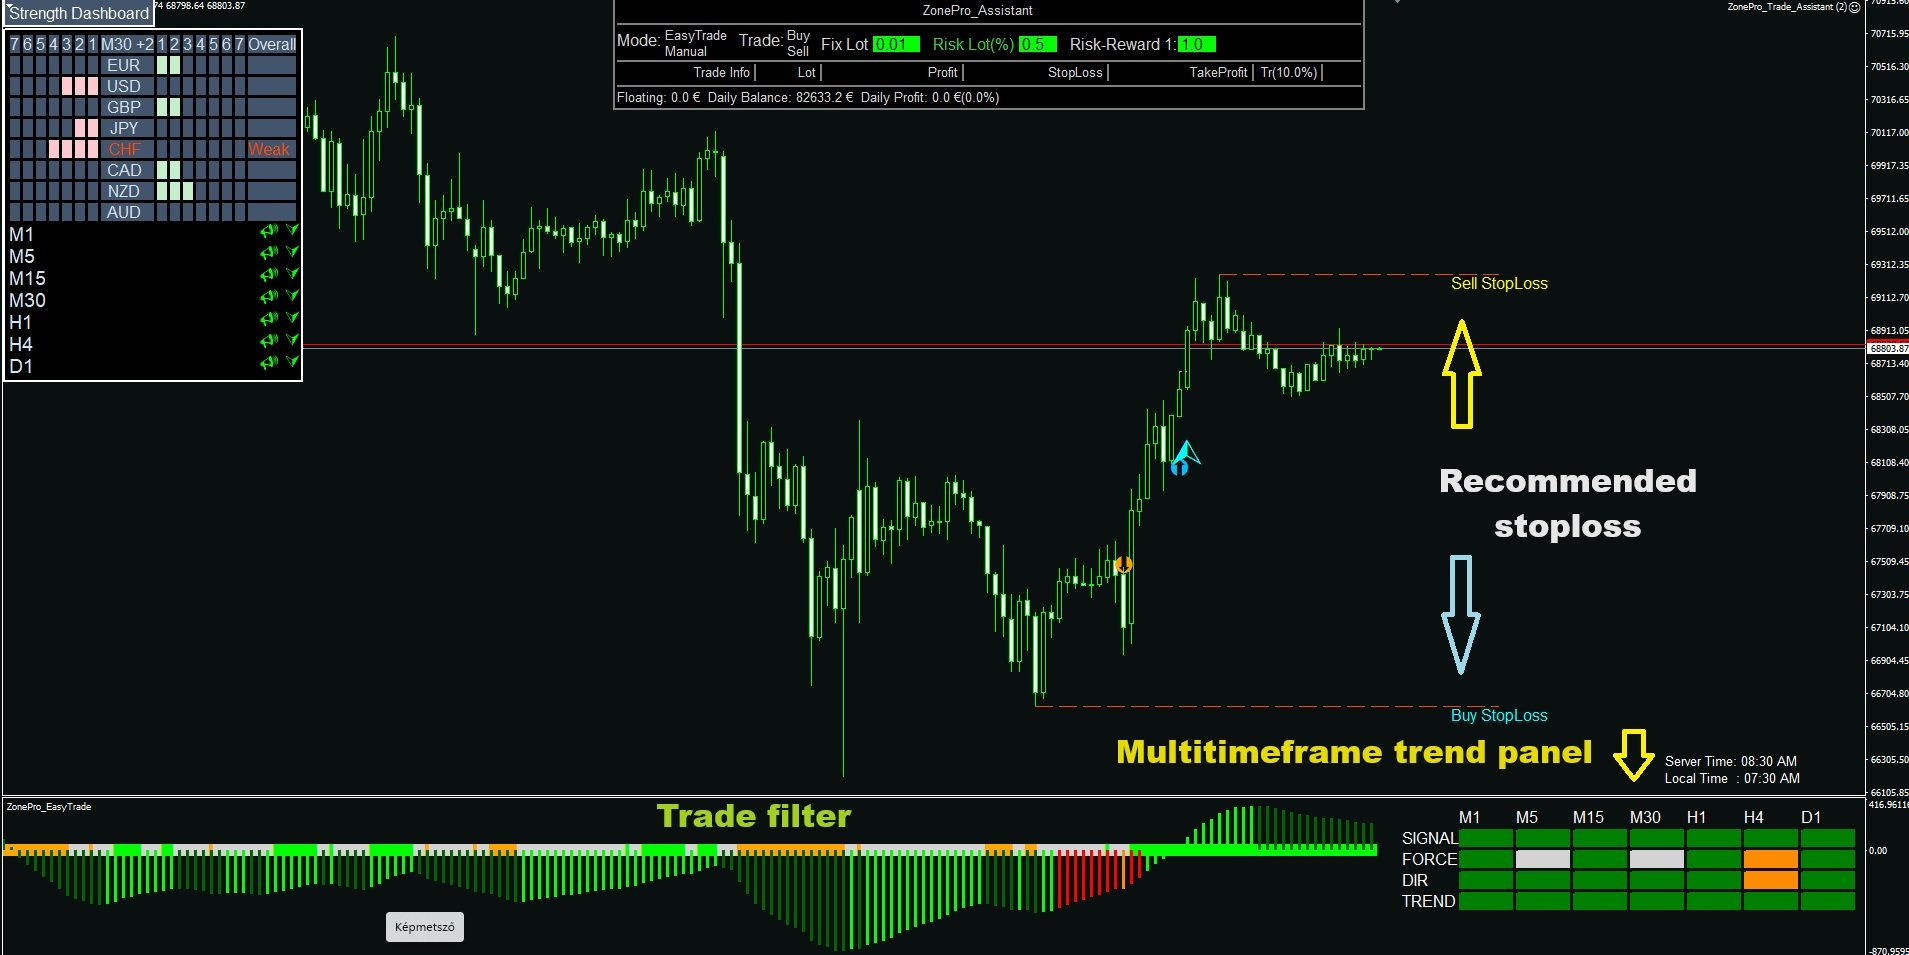
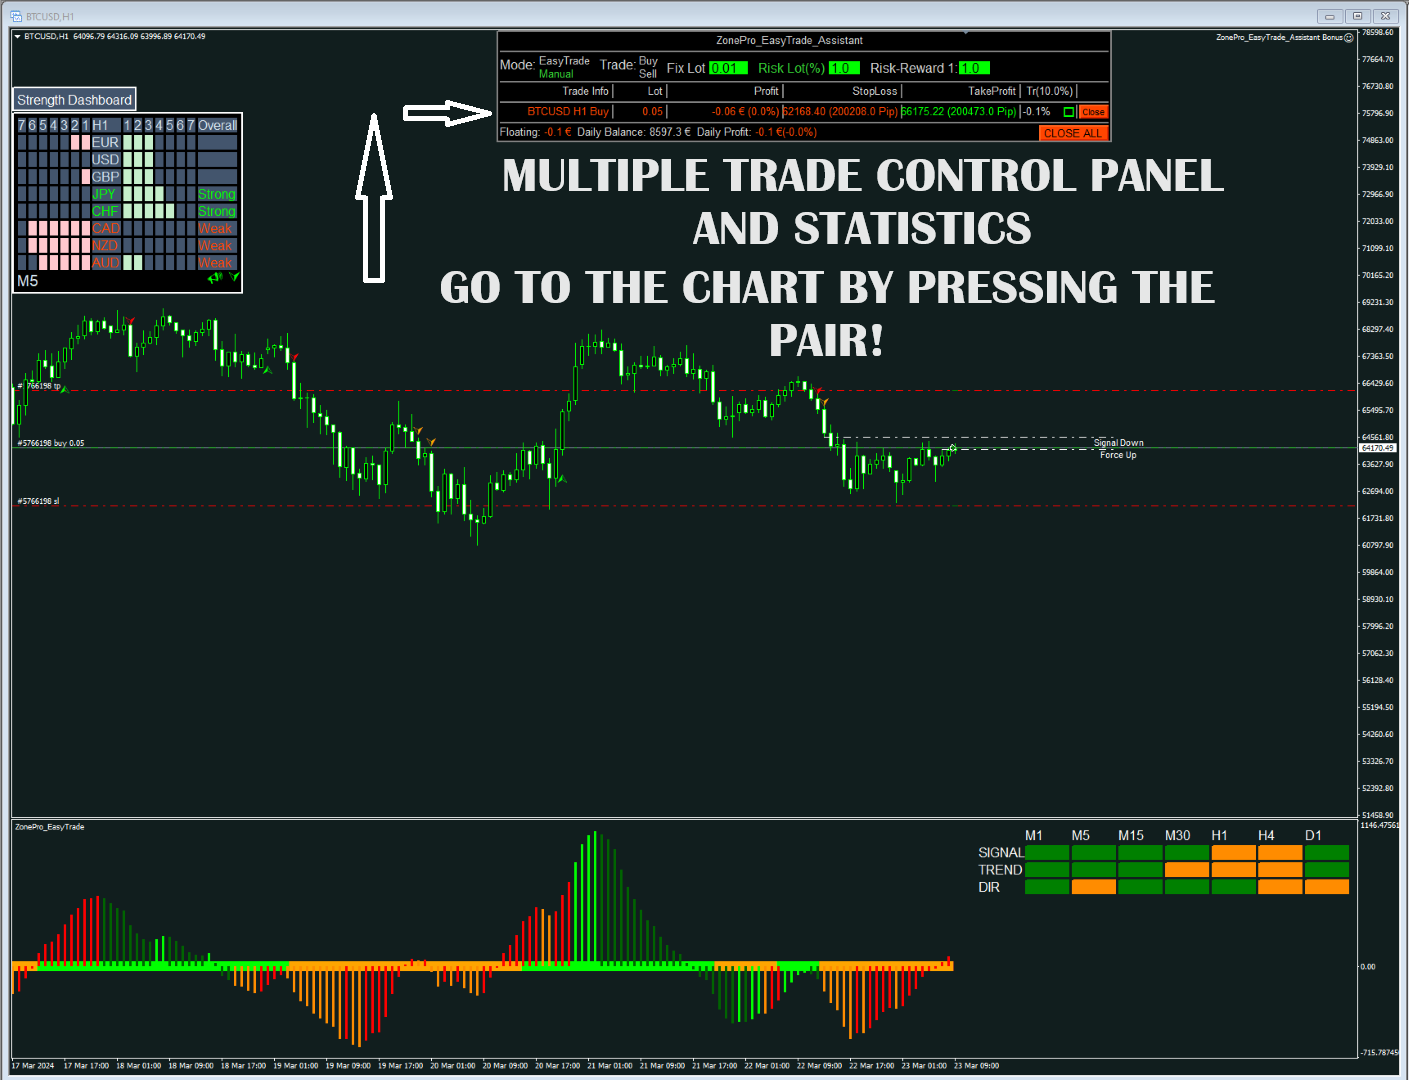
インジケーターウィンドウ: チャート通貨のトレンドフィルターとマルチタイムフレームトレンドパネルを備えた特別なMACDヒストグラム!
すべての通貨と時間枠の取引アラートを提供し、ボタンを押すだけでチャートに移動します。
画面:
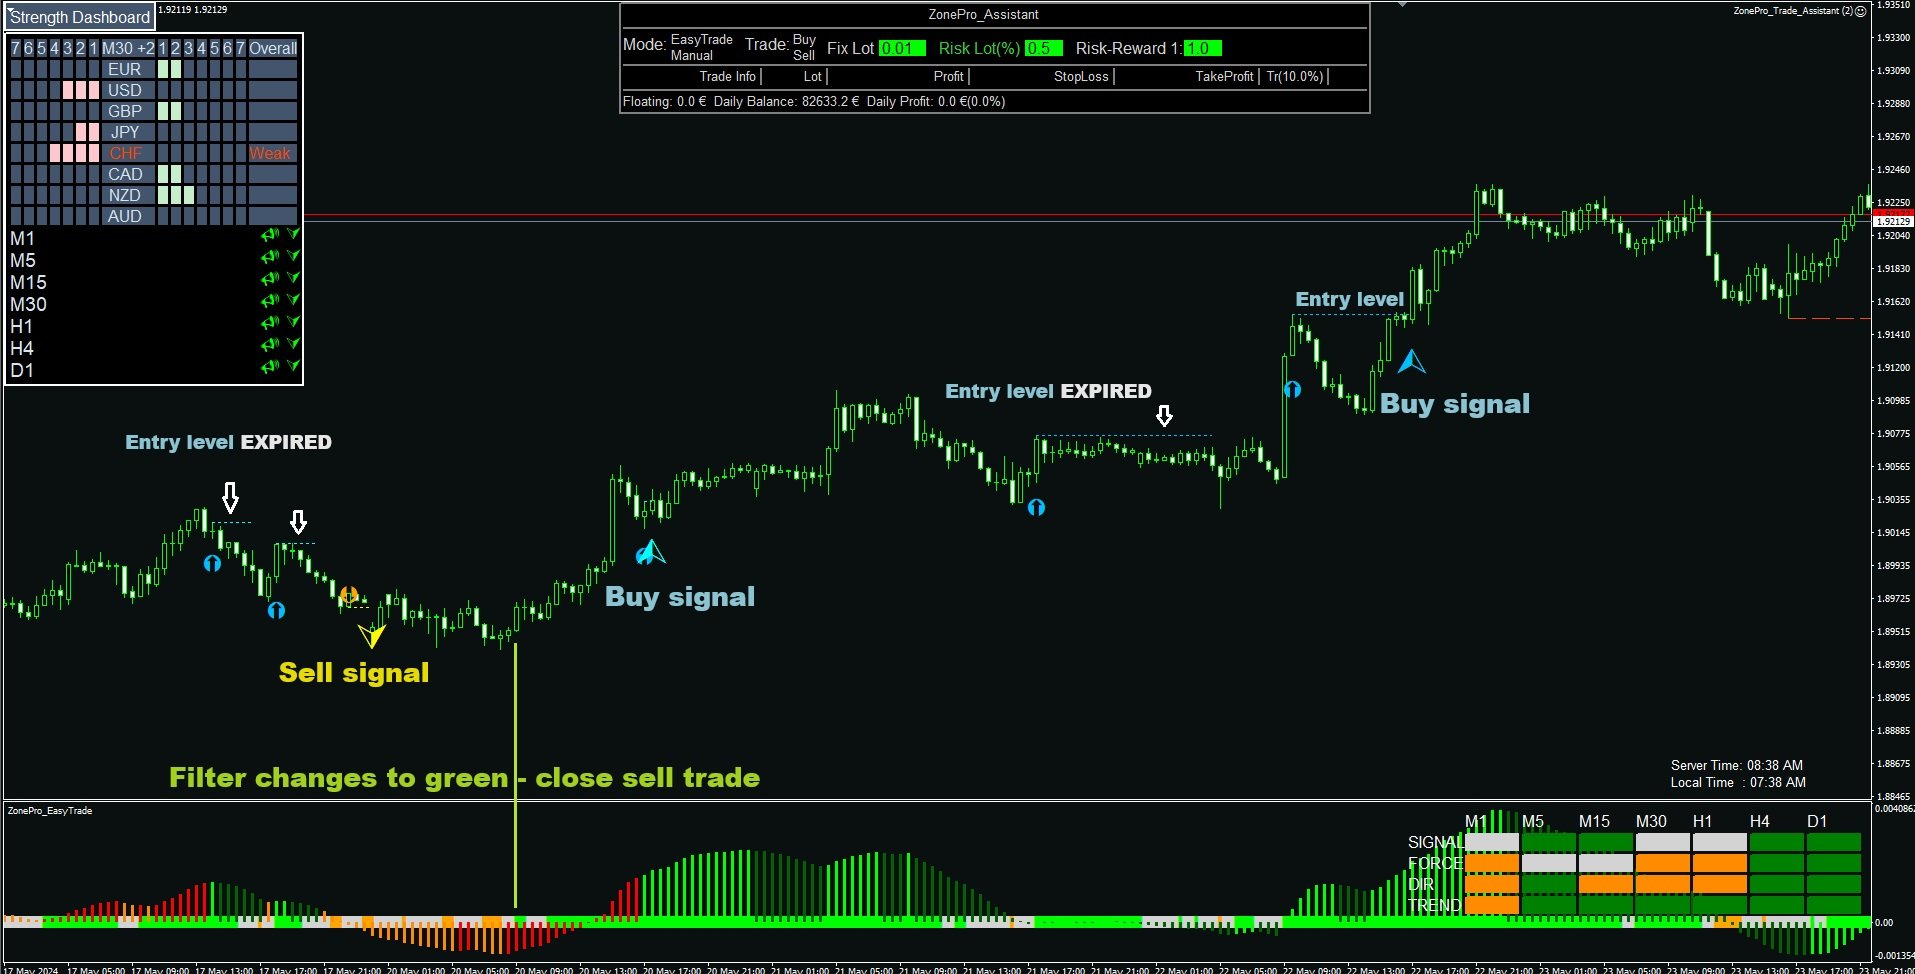
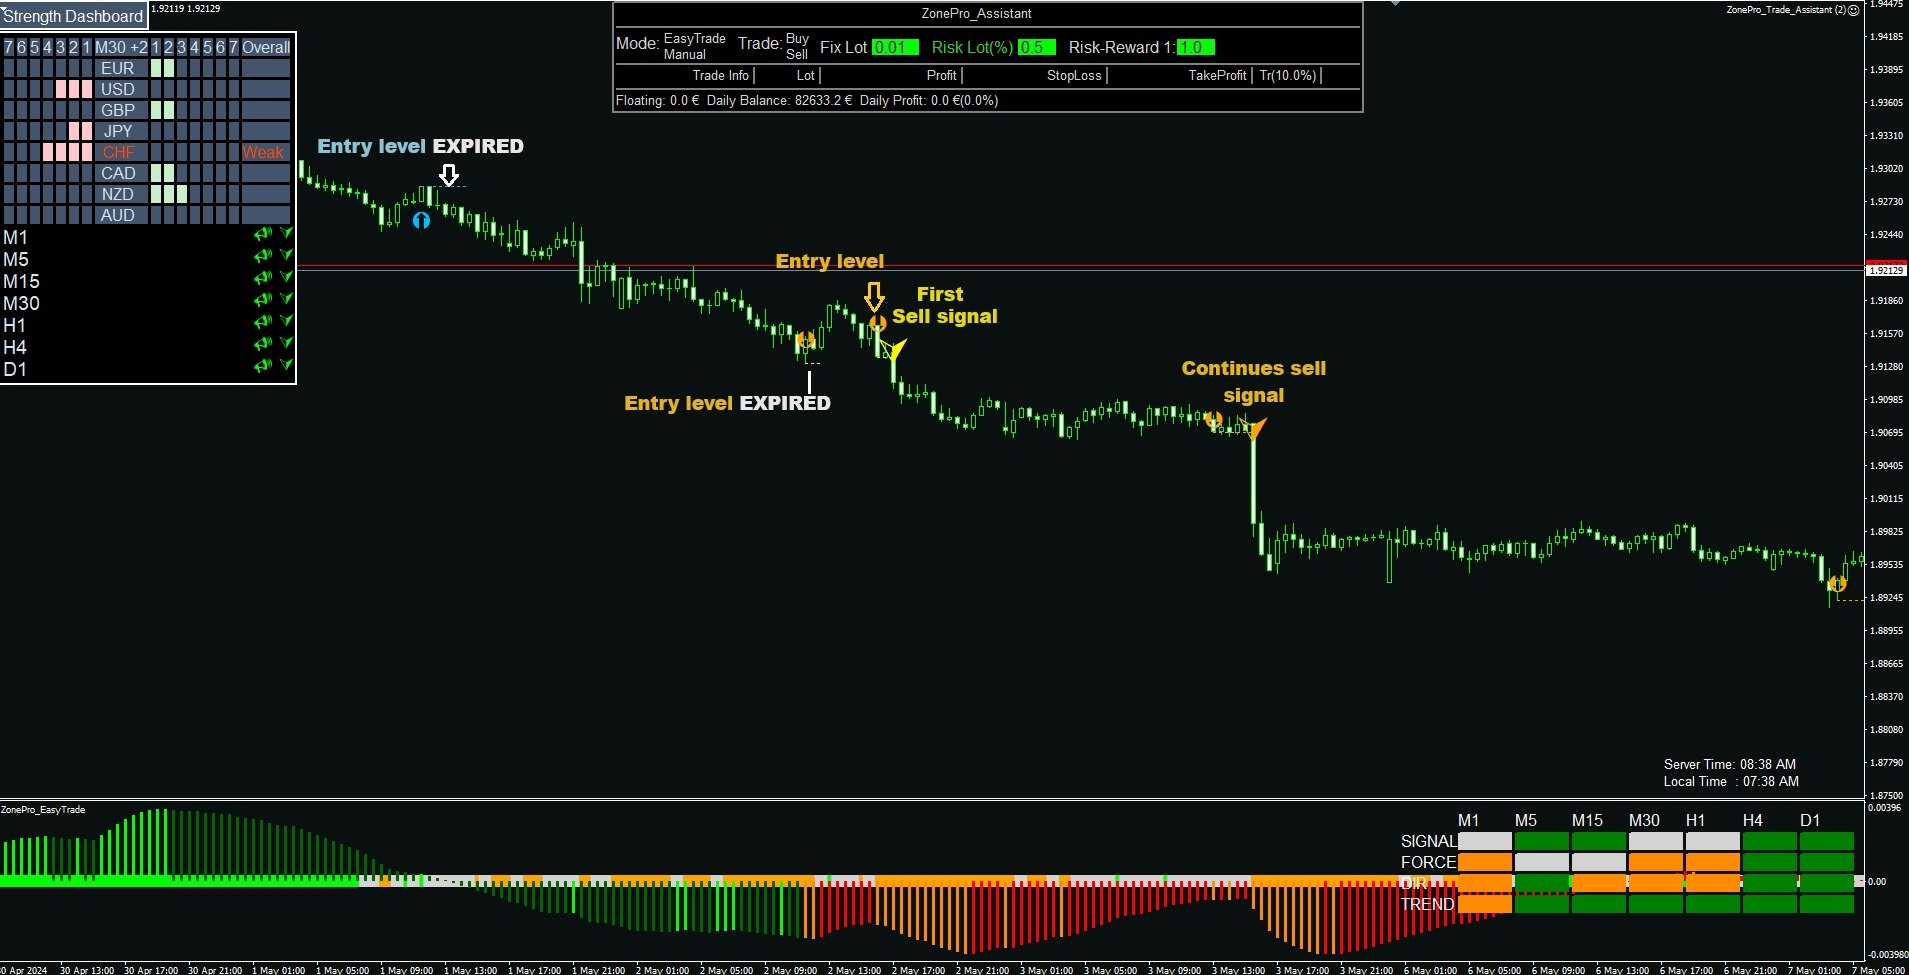
緑の矢印: 買いシグナル
赤い矢印 : 売りシグナル
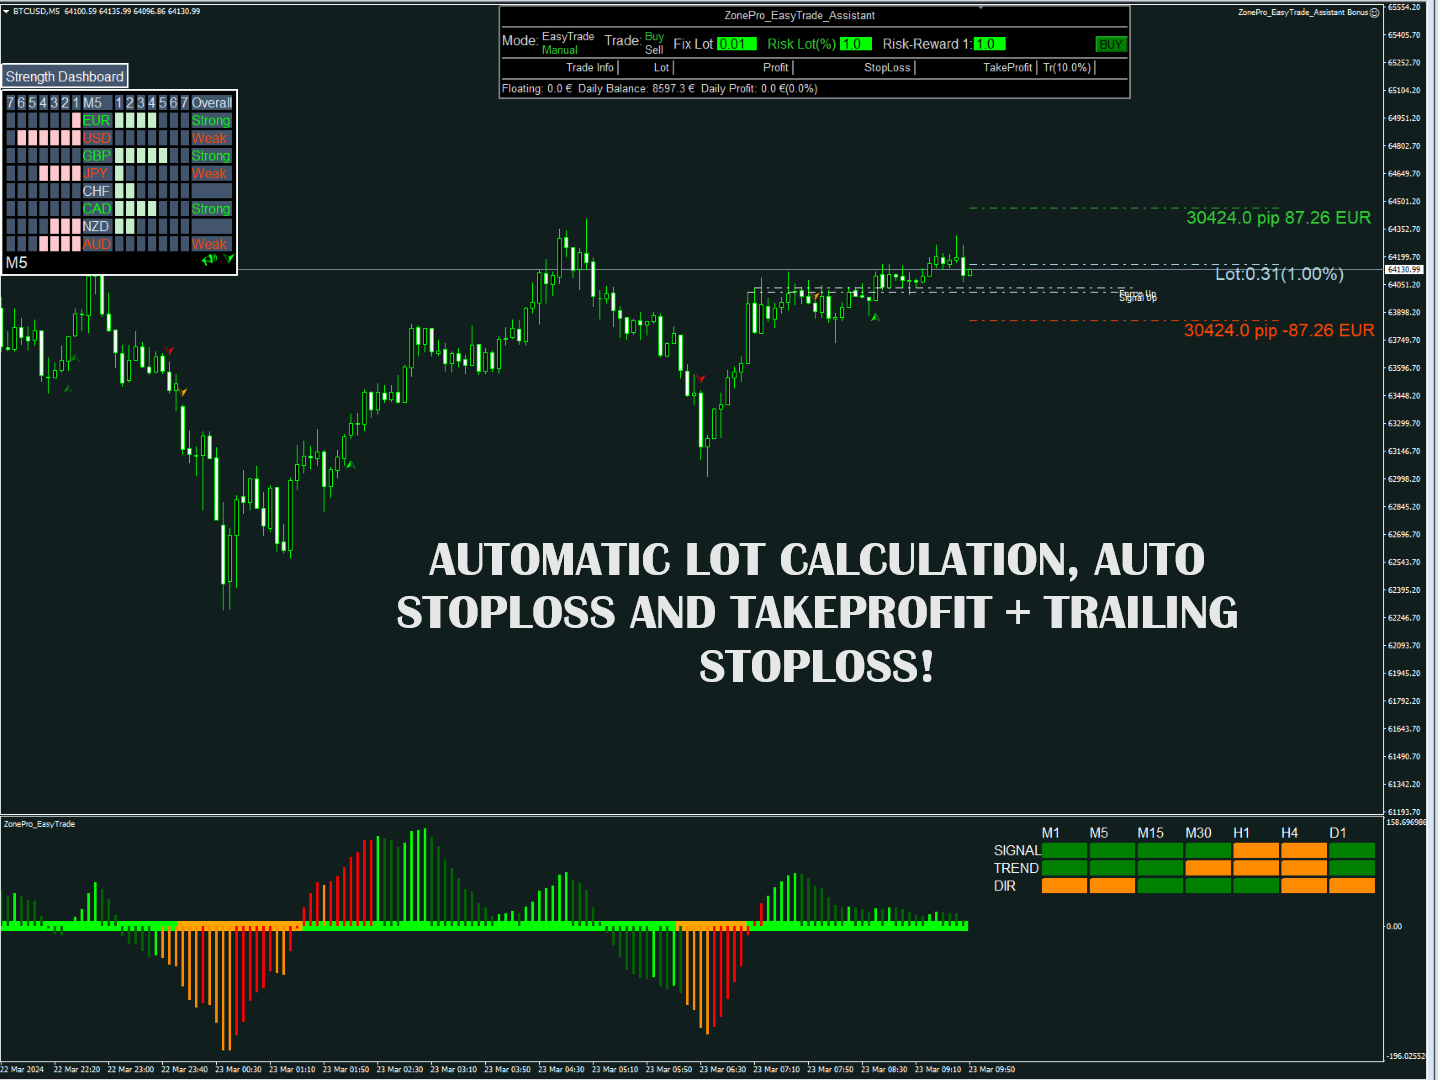
買いまたは売りシグナルが表示されたら、エキスパートアドバイザーのEASYTRADEボタンを押すだけで、自動計算されたロットサイズ、ストップロス、テイクプロフィットが表示されます。
インジケーターウィンドウのフィルターをチェックしてください。ロングトレードの場合は緑色、ショートトレードの場合はオレンジ色でなければなりません。
専門アドバイザーのセットアップ:https://www.mql5.com/en/blogs/post/756792
エキスパートアドバイザー用ユーザーマニュアル: https://www.mql5.com/en/blogs/post/756806
Fukusū tsūka to fukusū furēmu no baibai ni kansuru arāto. Jidō torēringusutoppu to risuku hōshū de rieki o kakutoku! Injikētā ga ichiba o sukyan shite bunseki suru tame, nani mo suru hitsuyō wa arimasen. 1-Tsu no chāto de subete no tsūka o torihiki shimashou! Kōnyū-go, komento o nokoshite watashi ni renraku shite kudasai. Torēdoashisutanto EA o ookuri shimasu. Kono injikētā wa ikutsu ka no oshirētā to fuzoku no firutā o shiyō shite, sairyō no kakunin sa reta entorīpointo o mitsukemasunode, sore ni tsuite shinpai suru hitsuyō wa arimasen. Keikoku ga hyōji sa re, kanshi suru koto o sentaku shita subete no jikan-waku to tsūka no botan ga byōga sa remasu. Botanwoosu dake de chāto ni idō shi, torihiki o kaishi dekimasu. Kono injikētā wa, subete no kihon tsūka to ichiba kanshi tsūka no tsuyo-sa paneru mo byōga shimasu (settei de chōsei kanō). Kore ni yori, subete no pea no tsūka to sentaku sa reta yori takai jikan-waku ga hyōji sa remasu. Injikētāu~indou: Chāto tsūka no torendofirutā to maruchitaimufurēmutorendopaneru o sonaeta tokubetsuna MACD hisutoguramu! Subete no tsūka to jikan-waku no torihiki arāto o teikyō shi, botanwoosu dake de chāto ni idō shimasu. Gamen: Midori no yajirushi: Kai shigunaru akai yajirushi: Uri shigunaru-gai matawa uri shigunaru ga hyōji sa retara, ekisupātoadobaizā no EASYTRADE botanwoosu dake de, jidō keisan sa reta rotto saizu, sutoppurosu, teikupurofitto ga hyōji sa remasu. Injikētāu~indou no firutā o chekku shite kudasai. Rongutorēdo no baai wa midoriiro, shōtotorēdo no baai wa orenji-irodenakereba narimasen. Senmon adobaizā no settoappu: Https: / / Www. Mql 5. Komu/ en/ blogs/ post/ 756792 ekisupātoadobaizā-yō yūzāmanyuaru: Https: / / Www. Mql 5. Komu/ en/ blogs/ post/ 756806


I look :)
Update.
I think its Strong, have Profit
I have rarely seen such a patient and informative salesman.
I am very grateful for his help.
I will continue to use and buy his products in the future