• Тип индикатора
  • Цена
     - 
  • Сбросить
Смотри обучающее видео по маркету на YouTube
Как купить торгового робота или индикатор
Запусти робота на
виртуальном хостинге
Протестируй индикатор/робота перед покупкой
Хочешь зарабатывать в Маркете?
Как подать продукт, чтобы его покупали

Новые технические индикаторы для MetaTrader 5 - 61

icon На основании сигналов технических индикаторов принимаются решения относительно открытия или закрытия сделки на фондовом и форекс-рынках. Суть индикаторов заключается в математическом преобразовании цены и/или объемов финансового инструмента для прогнозирования изменений цен в будущем. Протестируйте технические индикаторы, чтобы лучше предсказывать поведение рынка и зарабатывать на этом.
Divergence Wave
Alexandre Moraes De Souza Lima
Ondas de Divergência. Antes do mercado tomar um sentido e se manter em tendencia, existem sinais que podem ser lidos, nos permitindo assim entender o "lado mas forte", e realizar trades de maior probabilidade de acerto com risco reduzido, esses movimentos são persistentes e contínuos, proporcionando excelente rentabilidade. Ondas de Divergência é um histograma que acumula a divergência de  entre preço e volume a cada tick, permitindo assim encontrar pontos de absorção, áreas de acumulo e distrib
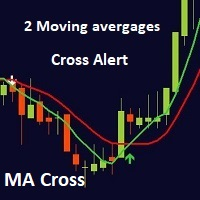
MA cross ALERT MT5   This indicator is a full 2 moving averages cross Alert ( email and push notification "mobile" ), 2 MA with full control of MA method and applied price for each moving average "slow and fast", -simple, exponential, smoothed, linear weighted. - close, open, high, low, median price, typical price, weighted price. you can modify periods as well for both MA. For any suggestions don't hesitate, thanks
Индикатор показывает на графике Зоны прибыли (Profit Zone) отображая начало и конец локального тренда Profit Zone PRO идеально подходит для всех символов Meta Trader:  валют, металлов, криптовалют, акций и индексов Преимущества индикатора Profit Zone PRO: Сигналы на вход без перерисовки Алгоритмы индикатора позволяют находить идеальные моменты для входа в сделку (покупки или продажи актива), повышающие успешность сделок у 100% трейдеров. Индикатор имеет два уровня профита, что позволяет частич
This indicator is based on the ICCI. If a long pattern is detected, the indicator displays a buy arrow. If a short pattern is detected, the indicator displays a sell arrow. Settings CCI Period - default set to (14) Features Works on all currency pairs and timeframes Draws Arrows on chart Colors Line Color Line Width Line Style Arrow Color This tool can help you analyse the market and indicates market entry.
AW Breakout Catcher MT5
AW Trading Software Limited
5 (9)
Пробои ценовых уровней, продвинутая статистика, расчет ТейкПрофита и 3 вида уведомлений. Преимущества: Не перерисовывает свои результаты Сигнал строго на закрытии свечи Алгоритм фильтрации ложных пробоев Отлично сочетается с любой трендовой стратегией Работает на всех инструментах и таймсериях Руководство пользователя и инструкция ->  ЗДЕСЬ  /Решение проблем ->   ЗДЕСЬ  / МТ4 версия ->  ЗДЕСЬ Как торговать с индикатором: Торговля с AW Breakout Catcher всего в три простых шага: Шаг 1 - Открытие п
Start Vwap Custom Midas
Ricardo Almeida Branco
5 (3)
Attention: New update - 4 major practicality improvements! 1) Alarm 2) Midas text value 3) Click panel 4) Can be connected to an EA to operate in semi-automatic mode Attention - This indicator does not work perfectly in backtest due to MT5 peculiarities (Reading hotkeys or panel clicks) . My suggestion is that you test Automatic Vwap Midas which has automatic operation to analyze the calculation and then buy Start if you think the indicator will match your operating.     This indicator i
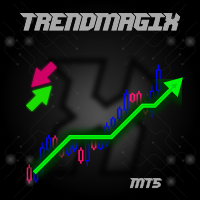
Unique trend trading algorithm with advanced filtering and many features which should become a part of your trading arsenal. This indicator can give you also trading advisors (with take profit target), success rate scanner and much more. Important information For additional detailed information you can visit the 747Developments website. Features Easy to use (just drag and drop to the chart) Possible to use with any trading instrument Possible to use on any time-frame Take profit advisors S
Market Momentum
Flavio Javier Jarabeck
3.86 (7)
The Market Momentum indicator is based on the Volume Zone Oscillator (VZO), presented by Waleed Aly Khalil in the 2009 edition of the International Federation of Technical Analysts journal, and presents a fresh view of this market valuable data that is oftenly misunderstood and neglected: VOLUME. With this new approach of "seeing" Volume data, traders can infer more properly market behavior and increase their odds in a winning trade. "The VZO is a leading volume oscillator; its basic usefulnes
FREE
Color Levels  - удобный инструмент для тех, кто использует технический анализ с использованием таких инструментов, как Трендовая линия и Прямоугольник. Имеется возможность настройки двух пустых прямоугольников, трех закрашенных и двух трендовых линий. Настройки индикатора крайне просты и делятся на пронумерованные блоки: С цифрами 1 и 2 вначале - настройки пустых прямоугольников (рамок); С цифрами 3, 4 и 5 - настройки закрашенных прямоугольников; С цифрами 6 и 7 - настройки трендовых линий. Объ
1. Why did I develop this series of indicators I found that most traders need to use multiple time frame indicators. They usually switch time frame to see indicators. However, once the timeframe is switched, you cannot see the  corresponding relationship  between  the price in the smaller timeframe  and  the indicator in the larger timeframe . For example: if your price chart is in H1 timeframe, you can see H4, D1 and W1 indicators in H1 timeframe Chart. This is more helpful for you to find t
YKL DinDX
Ygor Keller Luccas
5 (2)
Dynamic Indicator --> YKL_DinDX Dynamic Indicator that creates a Band based on the distance from moving average specified by the user. The indicator considers the period entered by the user in order to calculate the average distance from moving average, creating an upper band and a lower band. This indicator is utilized by EA YKL_Scalper, version 2.0 or superior.
FREE
1. Why did I develop this series of indicators I found that most traders need to use multiple time frame indicators. They usually switch time frame to see indicators. However, once the timeframe is switched, you cannot see the  corresponding relationship  between  the price in the smaller timeframe  and  the indicator in the larger timeframe . For example: if your price chart is in H1 timeframe, you can see H4, D1 and W1 indicators in H1 timeframe Chart. This is more helpful for you to find t
Displays previous months Highs & Lows. You can set the number of months to display levels for, also the line style, color and width. This is very useful for traders using the BTMM and other methods like ICT. I'll be creating more indicators for MT5 for the BTMM. Send me your suggestions to my Telegram: https://t.me/JDelgadoCR Take a look at my other products at: https://www.mql5.com/en/users/jdelgadocr/seller
FREE
Just $10 for six months!!! Displays previous weeks Highs & Lows. You can set the number of weeks to display levels for, also the line style, color and width. This is very useful for traders using the BTMM and other methods like ICT. I'll be creating more indicators for MT5 for the BTMM. Send me your suggestions to my Telegram: https://t.me/JDelgadoCR Take a look at my other products at: https://www.mql5.com/en/users/jdelgadocr/seller
Just $10 for six months!!! Displays previous days Highs & Lows. You can set the number of days to display levels for, also the line style, color and width. This is very useful for traders using the BTMM and other methods like ICT. I'll be creating more indicators for MT5 for the BTMM. Send me your suggestions to my Telegram: https://t.me/JDelgadoCR Take a look at my other products at: https://www.mql5.com/en/users/jdelgadocr/seller
Go Binary
Fabio Oliveira Magalhaes
The main idea of this product is to generate statistics based on signals from 5 different strategies for the Binary Options traders, showing how the results would be and the final balance based on broker's payout. Strategy 1: The calculation is secret. Strategy 2: The signal is based on a sequence of same side candles (same color). Strategy 3: The signal is based on a sequence of interspersed candles (opposite colors). Strategy 4: The signal consists of the indicators bollinger (we have 3 typ
Go Ferramentas
Fabio Oliveira Magalhaes
This product is a set of tools that help the trader to make decisions, bringing information from different categories that complement each other: trend, support / resistance and candle patterns. It also has a panel with information about the balance. The trend has two different calculations and is shown as colored candles. Strategy 1 is longer, having 3 different states: up, down and neutral trend. Strategy 2 has a faster response and has only 2 states: up and down trend. Support and resistance
Indicador Taurus All4   Taurus All4 O Taurus All4 é um indicador de alto desempenho, que indica a força da tendência e você pode observar a força da vela. Nosso indicador tem mais de 4 confirmações de tendência. É muito simples e fácil de usar. Modos de confirmação Confirmações de tendências de velas: Quando a vela muda para verde claro, a tendência é alta. Quando a vela muda para vermelho, a tendência está voltando para baixo. Quando a vela muda para vermelho escuro, a tendência é baixa.
Индикатор для торговли по сигналам гармонического паттерна AB=CD. Даёт сигналы и показывает уровни входа в рынок, а так же, уровни для выставления стоп приказов, что позволяет трейдеру своевременно принимать решения по входу в рынок, а также эффективно управлять позициями и ордерами. Поддерживается отправка push-уведомлений на мобильное устройство, и-мейл, а так же алерты. Данный индикатор был портирован с версии для MetaTrader 4. Больше информации, а также подробное описание и видео с демонстра
Rectangle Detector Alert About Rectangle Detector Alert Indicator Rectangle detector alert detects manually drawn rectangle shapes on charts and sends out push notifications also auto extending the rectangles at the same time as new candles form. The concept behind this indicator is based on the manual trading of supply and demand zones. Most  traders prefer  to draw their supply (resistance) and demand (support) zones manually instead of  depending on indicators to auto draw  the
This indicator measures the largest distance between a price (high or low) and a moving average. It also shows the average distance above and below the moving average. It may come in handy for strategies that open reverse positions as price moves away from a moving average within a certain range, awaiting it to return so the position can be closed. It just works on any symbol and timeframe. Parameters: Moving average period : Period for moving average calculation. Moving average method : You can
This incicator shows you when a pin bar is formed, and aid you perform a inversion strategy or a trend continuation based on resistence support and or channel. Typically a pin bar shows you a price rejection from the market and the signal most of time is profitable. So i suggest to use buy/sell limit order over ratrace SL little bit over or below bar and take profit based on your strategy and money management. Best timeframe are D H4 H1
The Candlestick Patterns indicator for MT5 includes 12 types of candlestick signales in only one indicator. - DoubleTopsAndBottoms - SmallerGettingBars - BiggerGettingBars - ThreeBarsPlay - TwoBarsStrike - Hammers - InsideBars - OutsideBars - LongCandles - TwoGreenTwoRed Candles - ThreeGreenThreeRed Candles The indicator creats a arrow above or under the signal candle and a little character inside the candle to display the type of the signal. For long candles the indicator can display the exac
Fibonacci Múltiple 12, utiliza la serie fibonacci plasmado en el indicador fibonacci, aumentadolo 12 veces según su secuencia. El indicador fibonacci normalmente muestra una vez, el presente indicador se mostrara 12 veces empezando el numero que le indique siguiendo la secuencia. Se puede utilizar para ver la tendencia en periodos cortos y largos, de minutos a meses, solo aumentado el numero MULTIPLICA.
Bar Data Printer
Alessandro Partesotti
5 (2)
This Price indicator aid you to read prices of a bar without using native MT5 instuments like crosshair. The indicator gives you the OPEN HIGH LOW CLOSE and 50% bar prices of the current or one of the previous bar. Parameter setting are: TimeShift: Used for bar selection (0 stand for current 1 for previous 2 for 2 bars ago) Other parameter are using for esthetics. Each Label can be moved away from its initial position. FEEL FREE TO REPORT BUG AND REVIEW THIS INDICATOR. THANKS
FREE
AW Trend Predictor MT5
AW Trading Software Limited
4.78 (58)
Сочетание тренда и пробоя уровней в одной системе. Продвинутый алгоритм индикатора фильтрует рыночный шум, определяет тренд, точки входа, а также возможные уровни выхода из позиции. Сигналы индикатора записываются в статистический модуль, который позволяет выбирать наиболее подходящие инструменты, показывая эффективность истории сигналов. Индикатор рассчитывает отметки ТейкПрофитов и стоплосса. Руководство пользователя ->  ЗДЕСЬ  / MT4 версия ->  ЗДЕСЬ Как торговать с индикатором: Торговля с Tr
Этот мульти-таймфрейм и мультисимвольный индикатор идентифицирует двойную вершину / основание, голову и плечо, вымпел / треугольник и образцы флагов. Также можно настроить оповещения только тогда, когда произошел прорыв линии шеи / треугольника / флагштока (прорыв линии шеи = подтвержденный сигнал для вершины / оснований и головы и плеч).       Индикатор также можно использовать в режиме одиночного графика. Подробнее об этой опции читайте в разделе продукта.   блог . В сочетании с вашими собстве
Индикатор тренда Carina . Реализация индикатора тренда простая - в виде линий двух цветов. В оаснове алгоритма индикатора лежат стандартные индикаторы а также собственные математические расчеты. Индикатор поможет пользователям определиться с направлением тренда. Также станет незаменимым советчиком для входа в рынок или для закрытия позиции. Этот индикатор рекомендуется для всех, как для новичков так и для профессионалов. Как трактовать информацию от индикатора. Покупаем, когда происходит смен
Индикатор горизонтальных объемов ( Horizontal Volumes ) - отражает с помощью гистограммы, объем заключенных сделок по определенной цене без привязки за временем. При этом гистограмма появляется непосредственно в окне терминала, а каждый столбик объема легко сопоставить со значением котировки валютной пары. Индикатор практически не требует изменения настроек, а при желании с ними может разобраться любой трейдер. Объемы заключенных сделок имеют большое значение в биржевой торговле, обычно увели
The ShowSessions indicator for MT5 shows up to two, self-selected, time intervals, for a free choosen number of days past and a few future days. Weekends are marked with an additional red vertical line. The indicator makes manuel backtesting of strategies more easily, but you can use ist for daily trading as well. Please note that the server time does not always correspond to the actual time.
FREE
Free version of  https://www.mql5.com/en/market/product/44815 Simple indicator to calculate profit on fibonacci retracement levels with fixed lot size, or calculate lot size on fibonacci levels with fixed profit. Add to chart and move trend line to set the fibonacci retracement levels. Works similar as default fibonacci retracement line study in Metatrader. Inputs Fixed - select what value will be fix, lot or profit  (available in full version, lot is set on free version) Fixed value - value tha
FREE
This app supports customer investments with equipment financing and leasing solutions as well with structured chat Our success is built on a unique combination of risk competence, technological expertise and reliable financial resources. Following topics are covered in the Trading Support Chat -CUSTOMISATION -WORKFLOW -CHARTING TIPS -TRADE ANALYSIS PLEASE NOTE That when the market is closed, several Brokers/Metatrader servers do not update ticks from other timeframes apart from the current
*Non-Repainting Indicator Arrow Indicator with Push Notification based on the Synthethic Savages strategy for synthethic indices on binary broker. Signals will only fire when the Synthethic Savages Strategy Criteria is met BUT MUST be filtered. Best Signals on Fresh Alerts after our Savage EMA's Cross. Synthethic Savage Alerts is an indicator that shows entry signals with the trend. A great tool to add to any chart.  Best Signals occur on Fresh Alerts after our Savage EMA's Cross + Signal

MetaTrader Маркет позволяет максимально безопасно покупать программы для платформы MetaTrader. Вы можете скачать демо-версии понравившихся роботов и индикаторов прямо из терминала и проверить их в тестере стратегий.

Протестируйте программы в различных режимах перед покупкой для получения максимального представления о продукте и оплатите понравившийся продукт через платежную систему MQL5.community.

Платежная система MQL5.community обеспечивает оплату продавцам, а возможность тестирования программ в различных режимах позволяет покупателям получить максимальное представление о продукте.