Смотри обучающее видео по маркету на YouTube
Как купить торгового робота или индикатор
Запусти робота на
виртуальном хостинге
виртуальном хостинге
Протестируй индикатор/робота перед покупкой
Хочешь зарабатывать в Маркете?
Как подать продукт, чтобы его покупали
Новые технические индикаторы для MetaTrader 5 - 60

A useful dashboard that shows the RSI values for multiple symbols and Time-frames. It can be easily hidden/displayed with a simple click on the X top left of the dashboard. You can input upper and lower RSI values and the colours can be set to show when above/below these values. The default values are 70 and 30. You can choose whether the dashboard is displayed on the right or left of the chart. If you want to have 2 dashboards on the same chart you must input a different name for each. The sca
FREE

Технический индикатор Wave Vision измеряет относительную силу трендовых движений цены от ее средних значений за определенный период времени. Гистограмма показывает силу движения цены относительно линии нулевого уровня. Значения гистограммы, близкие к нулю, указывают на равенство сил между покупателями и продавцами. Выше линии нулевого уровня - бычий тренд (положительные значения гистограммы). Ниже линии нулевого уровня - медвежий тренд (отрицательные значения гистограммы).
Настройки:
S
FREE

Several techniques use volume as an important point in the trade. Whether to indicate strength, exhaustion, pullback weakness, among others.
In chief I quote Richard Wyckoff's theory, which said about the importance of looking price and volume.
However, there are several possibilities to filter what is volume that should be noticed.
PVRSA/PVA users use an indicator with specific colors, which assist in identifying the volume and type of movement that the price has made.
Will the high

Users of PVRSA / PVA certainly already know the Dragon indicator and its use.
The Dragon works as dynamic support and resistance and can be used for scalper or trend follower.
In addition to the Dragon we have the WGT (fast) and EMA (slow) averages that can show immediate movement and also trend movement.
Stay tuned for the Dragon's inclination!
The indicator can be used on any asset/currency pair and can be customized according to the trader's interest.
See also my volume analysi

Several techniques use volume as an important point in the trade. Whether to indicate strength, exhaustion, pullback weakness, among others.
In chief I quote Richard Wyckoff's theory, which said about the importance of looking price and volume.
However, there are several possibilities to filter what is volume that should be noticed.
PVRSA/PVA users use an indicator with specific colors, which assist in identifying the volume and type of movement that the price has made.
Will the high
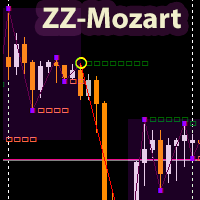
Индикатор ZigZagMozart основан на расчете продвинутого ZigZag-а. Отображает точки перелома тренда (белые квадраты), результирующие точки (желтые круги), флэтовые зоны (фиолетовые точки). Единственный параметр индикатора: "разворот в пунктах" - минимальное плече между вершинами индикатора. В индикаторе используется анализ рынка на основании стратегии известного современного трейдера Mozart. https://www.youtube.com/watch?v=GcXvUmvr0mY. ZigZagMozart - работает на любых валютных парах. При значени
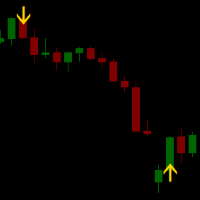
Signal RSI printa no gráfico os melhores momentos de entrada segundo o indicador RSI.
No gráfico aparecerá uma seta indicando o momento e a direção de entrada para a operação. O encerramento da operação se dá ao atingir o lucro esperado ou o stop. Se estiveres com uma operação aberta e aparecer outra seta de sentido inverso, inverta a mão e aproveite! Amplamente testado em gráficos de mini índice e mini dólar, bem como ações e FIIs.
Gráficos recomendados: 5, 10, 15 min.

Получайте ежедневную информацию о рынке с подробностями и скриншотами в нашем утреннем брифинге здесь, на mql5 , и в Telegram ! FX Volume - это ПЕРВЫЙ и ЕДИНСТВЕННЫЙ индикатор объема, который дает РЕАЛЬНОЕ представление о настроении рынка с точки зрения брокера. Он дает потрясающее представление о том, как институциональные участники рынка, такие как брокеры, позиционируют себя на рынке Forex, гораздо быстрее, чем отчеты COT.
Видеть эту информацию прямо на своем графике - это настоящий геймчей

Измеритель силы валюты дает вам краткое наглядное представление о том, какие валюты в настоящее время сильны, а какие - слабые. Измеритель измеряет силу всех кросс-пар форекс и применяет к ним вычисления для определения общей силы для каждой отдельной валюты. Мы рассчитываем силу валюты на основе тренда 28 пар.
Зайдя в наш блог MQL5, вы можете скачать бесплатную версию индикатора. Попробуйте перед покупкой без ограничений тестера Metatrader: нажмите здесь
1. Документация Вся документа

Этот индикатор отображает волновую структуру рынка в виде нескольких волновых уровней, вложенных друг в друга. Для каждого из этих уровней создается автоматическая предварительная (черновая) разметка волн в стиле Эллиотта (123..., ABC ... и т.д.). Эта разметка является полностью автоматической и абсолютно однозначной. Индикатор особенно полезен для начинающих волновых аналитиков, поскольку среди всех возможных вариантов волновой разметки позволяет сразу взять за основу наиболее адекв

Индикатор Mono Waves предназначен для отображения на графике волнового поведения рынка. Его внешний вид представлен на слайде 1. Этот индикатор использует в своей работе индикатор PPPC ( Point - Percent Price Channel ), который можно бесплатно скачать в Маркете . Когда рынок движется вверх верхняя граница ценового канала строится по ценам High свечей (более подробно см. описание индикатора PPPC по ссылке данной выше). Чем выше поднимаются цены High , тем выше под
FREE

The TRIXs Indicator is the combination of the TRIX (Triple Exponential Moving Average) indicator with the addition of a SMA (Simple Moving Average) signal. It provides signs of trend continuity and the start of a new trend.
The entry and exit points of operations occur when the indicator curves cross.
It performs better when combined with other indicators.
FREE

Преимуществом индикатора Price Surfing является алгоритм поиска экстремумов цены инструмента. Большинство сигналов индикатора расположены на локальных максимумах и минимумах цены . Для удобства трейдера потенциальная прибыль каждого сигнала выводится на график. Индикатор не перерисовывается, сигнал появляется после закрытия бара. Версия для МТ4 https://www.mql5.com/ru/market/product/46054 Описание параметров SendAlert - включение уведомления о новом сигнале SendEMail - включение отправки у

The TRIXe Indicator is the combination of the TRIX indicator (Triple Exponential Moving Average) with the addition of an EMA (Exponential Moving Average) signal. It provides signs of trend continuity and the start of a new trend.
The entry and exit points of operations occur when the indicator curves cross.
It performs better when combined with other indicators.
FREE

Индикатор Point-Percent Price Channel (PPPC или PP Price Channel) предназначен для отображения на графике канала, ширина которого задаётся как в процентах от текущей цены так и в пунктах. Его внешний вид представлен на слайде 1. При движении рынка вверх верхняя граница канала строится по ценам High свечей. При этом нижняя граница движется вслед за верхней на строго указанном расстоянии. При касании ценой нижней границы канала индикатор переключается на построение тепер
FREE

Приседающий бар (Squat bar).
Один из элементов системы "Торговый хаос" Билла Вильямса.
Расчитывается исходя из разницы в изменении цены и тикового обьема.
Усиливает сигнал "Медвежьего/Бычьего Дивергентного разворотоного бара (Первый Мудрец)"если совпадает с ним или находится рядом.
Протестирован в сравнении с оригинальной программой "Investror's Dream".
Для более эффективного освоения системы читайте и смотрите материалы Билла Вильямса.
В настройках можо выбрать цвет бара.
Learning to trade on indicators can be a tricky process. Volatility Index indicator makes it easy by reducing visible indicators and providing signal alerts Entry and Exiting the market made possible through signal change Works well with high time frame to reduce market noise simplicity in trading guarantees success and minimal losses Our system creates confidence in trading in case of any difficulties or questions please send message

Tabajara Rules for MT5 , baseado em Setup Tabajara do professor André Machado, indica a direção do mercado com base em médias móveis quando tem velas na mesma direção da média móvel.
O indicador contém a regra de coloração aplicada aos candles e a média móvel.
O indicador permite a alteração dos parâmetros: período e método de suavização da média móvel.
O indicador permite a alteração das cores dos candles ( contornos e preenchimento) e da média móvel.
O modelo do professor André Machado c
FREE

This is RSI with alarm and push notification -is a indicator based on the popular Relative Strength Index (RSI) indicator with Moving Average and you can use it in Forex, Crypto, Traditional, Indices, Commodities. You can change colors to see how it fits you. Back test it, and find what works best for you. This product is an oscillator with dynamic overbought and oversold levels, while in the standard RSI, these levels are static and do not change.
This allows RSI with alarm and push notific
FREE
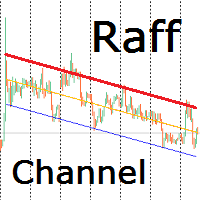
Индикатор строит канал Раффа на основе линейной регрессии. Красная линия тренда может использоваться для принятия решения о покупке или продаже внутрь канала при подходе цены к ней. Настройками можно задать ширину канала по коэффициенту отклонения от базовой линии или по максимальному и минимальному экстремуму. Так же можно включить продолжение канала вправо от текущих цен. Индикатор канала регрессии Раффа – удобный инструмент, значительно облегчающий работу современного трейдера. Он может быть

One of the Best Volume Indicators, with the addition of a Moving Average for weighting volume over time average.
If the "Current Candle" Volume is X% greater than the Moving Average value, we will have a sign of increasing volume.
It can be a sign of Beginning, Continuity, Reversal or Exhaustion of the Movement.
Fully configurable and all options open, you can color and set ALL values as you see fit.
The 'Volume Break' shows volume bars in the same color as the candlestick, in addition

*Non-Repainting Indicator Bruce Webb Explains How To Use Bruce's Price Predictor In Detail And Free Forex Strategy https://youtu.be/hfoB1tZZpTo Bruce's Price Predictor is an indicator that shows precise price reversals. A great arsenal to add to any chart. Bruce's Price Predictor points price reversals with high degree of accuracy and it is great for scalping on the 1min time frame, Or swing trading on the 1hr time frame. Buy and sell arrows are shown on the chart as for entry signals. They do

Combining the best of Price Action , Directional Movement , and Divergence / Convergence analysis, the Candle Color Trend is the easy and reliable way to identify the direction of the trend. The indicator automatically paints the candles according to the premise that the upward trend is defined by prices that form a series of ascending tops and bottoms. On the other hand, the downward trend is defined by prices that form a series of descending tops and bottoms.
Color Trend is certainly one
FREE
Индикатор разворота тренда
Этот индикатор отлично работает на начальных стадиях тренда, обнаруживая его разворот.
Рекомендации по торговле : - Сигнал формируется на текущей свече. - Вход в сделку рекомендуется на следующей свече. - Целевая прибыль составляет 20-30 пунктов. - Есть три варианта установки стоп-лосса: 1. Выход из сделки при противоположном сигнале. 2. Установка стоп-лосса непосредственно за сигналом. 3. Установка стоп-лосса на ближайшем максимуме или минимуме. - Рекоменду

Медвежий/Бычий дивергентный бар. Один из сигналов системы "Торговый хаос" Билла Вильямса. (Первый мудрец)
При отдалении от индикатора "Аллигатор" и наличии дивергенции на индикаторе "Awesome Oscillator" показывает потенциальную точку смены движения.
Строится исходя из открытия/закрытия бара, положения относительно предыдущих, Аллигатора и АО.
При торговле вход осуществляется на пробитии бара (шорт - лоу бара, лонг - хай бара), а стоп лосс ставится за крайнюю точку бара.
Для более эффективног
Forex Driver - отличный инструмент для обнаружения пиков и впадин на графике. Данный индикатор использует модифицированный алгоритм обнаружения пиков и впадин. Этот алгоритм включают в себя индикатор Fractals и индикатор ZigZag.
Этот инструмент нужно использовать для анализа пиков и впадин, а также для обнаружения паттернов, или для других целей.Вы можете использовать этот мощный инструмент в своих целях на свой страх и риск.

Индикатор Price Control определяет краткосрочный и долгосрочный тренд. Анализ основан на выбраном таймфрейме. Индикатор показывает точки открытия сделок на продажу или покупку, а также указывает направление тренда на:
Краткосрочном периоде Долгосрочном периоде
Индикатор не только сигнализирует о немедленной покупке или продаже. Он указывает краткосрочный и долгосрочный тренд. Индикатор позволяет вам подробнее изучить реальный и исторический рыночный тренды!

Benefits: A new and innovative way of looking across multiple timeframes and multiple indicators on any chart. Provides instant multi-timeframe analysis of any market. i.e. forex currency pairs, cryptocurrency pairs, commodities, etc. It offers precise indications across multiple timeframes of volatility as measured by RSI, ADX and STOCH within one chart. Helps you determine high probability trading setups. See example strategy in comments. Can see bullish/bearish volatility building across mult

Индикатор отображает (на выбор): коэффициент ранговой корреляции Спирмена, линейный коэффициент корреляции Пирсона, коэффициент ранговой корреляции Кендалла, коэффициент корреляции знаков Фехнера. Этот осциллятор показывает точки возможного разворота рынка, когда цена выходит за уровни перекупленности и перепроданности. Доступно 4 метода дополнительной фильтрации полученных значений: простой, экспотенциальный, сглаженный, линейно-взвешенный. После закрытия бара значения фиксируются и не перерис

The HammerStar indicator is designed to search for the Hammer and Shooting Star patterns on charts of any currency pairs.
Hammer Downward trend.
The lower shadow is not less than 2 and no more than 3 times larger than the body.
There is no upper shadow, or it is very short (no more than 10% of the candlestick range).
The color of the body in the long game is not important, with the short - white hammer is much stronger than the black one.
Confirmation is suggested.
Shooting Star Uptrend.
FREE

Volume pressure and oscillator overbougth - oversold condition togedther. Signals appears on chart. Turnig points, trading ranges, support- resistance levels also. Change parameters in the trendscalp settings. TTF bars can be set: 8, or, 15, or 45, 150. Greather periods are very useful at strong support - resistance areas. IF ONE OF OUR FREE INDICATOR IS NICE TO YOU, FEEL FREE TO BUY AT LEAST OUR CHIEPST PRODUCT TO DONATE US. "Lots of small peace can be a mountain" ( nathan rothschild, john len
FREE

reference:
"High Frequency Trading, A Pratical Guide to Algorithmic Strategies and Trading Systems (Aldridge, Irene)"
Characteristics The calculation of VWAP is in accordance with the literature. 4 types of VWAPs, daily, monthly, yearly, moving. Note: Daily is the most popular form, the calculation is performed from the beginning to the end of each trading session (Market benchmark). In the moving, the calculation is carried out from n periods past to the current period, as with the famou

With this indicator user can determine not just pivot like turning points. User able to spot trading ranges boundaries and support-resistance levels. In a strong trend the reverse signals also gives us excellent entry points. Recommended user settings: In the Attis volume: look back period : 1 or (3) MA_Lenght 99. ( of course one can play with the settings and get tailored signals... as you need)
FREE

Multi time frame, multy currency special swing volume indicator with engulfing waves too. Simpler to use compare to Weis Wave. User don't need to adjust wave size. Just use of the basic or the upper time frames. As a multi time frame indikator user can do very complex time frame analysyses. As well as a multy currency indicator one can make market sector-segment analysyses. Use with Wckoff principles.
FREE

Sentiment Liner This is a steroidised Daily-Weakly-Monthly high-low and open, must have indicator. With this stuff user can determine the average of (daily-weakly-montly) open levels. 4 example: if you in day mode switch the average to 5, you get the 5 day sentiment. In weakly mode turn the average to 4, than you get the 4 weak sentiment,...so on. Naturally one can us as a simple day-week-month high and low indikator. S1: high S2: low Pivot: open, Average: averager
FREE
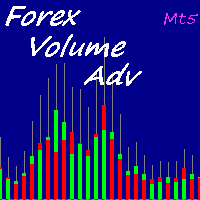
Forex is the most liquid market in the world. For this reason real volumes are not available. Some indicators use the number of ticks, in other cases the broker can supply volumes informations but they will be only data about that broker. Volumes are important becase they will form the price and volatility of the market. Using an algorithm this indicator can give you a very good approximation of the volumes for each candle.
How to read the indicators?
This version provides you many visualiza
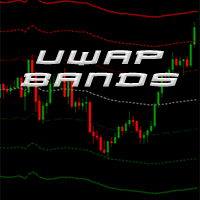
This indicator plots VWAP with 4 Standard Deviation bands. In finance, volume-weighted average price (VWAP) is the ratio of the value traded to total volume traded over a particular time horizon (usually one day). It is a measure of the average price at which a stock is traded over the trading horizon. VWAP is often used as a trading benchmark by investors who aim to be as passive as possible in their execution. Many pension funds, and some mutual funds, fall into this category. The aim of usi
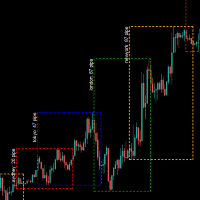
Индикаторы времени на рынке Forex, включая Сидней, Токио, Лондон, Нью-Йорк. 4 рыночные времена. Учитывая переключение летнего времени на сервере и переключение летнего времени на каждом рынке
input ENUM_DST_ZONE InpServerDSTChangeRule = DST_ZONE_US; // Правила перехода на летнее время на стороне сервера согласно Нью-Йорку или Европе
input int InpBackDays = 100; // максимальное количество дней прорисовки по соображениям производительности
input bool InpShowTextLabel = true; // отображать т

Мультивалютный, мультитаймфреймный, индикатор гармонического паттерна AB=CD. Поддерживает отправку push-уведомлений о сигналах на мобильное устройство, сообщений на и-меил, а также, сообщений с помощью алертов, на всех доступных валютных парах и таймфреймах. Данный индикатор был создан на основе индикатора Harmonic ABCD Universal . Версия для MetaTrader 5: https://www.mql5.com/ru/market/product/44972 . Смотре также: Harmonic ABCD Universal для MetaTrader 4 . Использование современных методов ра

Индикатор Scaner.
Валютные пары никогда не растут и не падают по прямой. Их подъемы и падения перемежаются откатами и разворотами. Каждый рост и каждое падение отражается и на вашем эмоциональном состоянии: надежда сменяется страхом, а когда он проходит, снова появляется надежда. Рынок использует ваш страх для того, чтобы не дать вам воспользоваться сильной позицией. В такие моменты вы наиболее уязвимы.
Все изменится, если вы будете использовать индикатор Scaner.
Индикатор Scaner был созд

Market tops are characterized by Volume Climax Up bars, High Volume Churn and Low Volume Up bars (also called Testing). Market bottoms are characterized by Volume Climax Down bars, High Volume Churn and Low Volume Down bars (Testing). Pullbacks, in either up or down trends, are similar to market topping or bottoming patterns, but shorter in duration and with simpler volume patterns.
FREE
This indicator improves the "DMI Trend" so that the trend signal reacts faster than before.
---The indicator allows you to simplify the interpretation of signals produced by the classical ADX indicator.
The position of the hight bars of the histogram relative to zero and the histogram coloring indicate the direction of price movement determined by the intersection of DI+ / DI-.
The position of the hight bars of the histogram relative to zero and the color indicate the strength of the pric
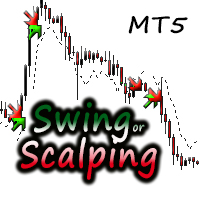
Continuous Coloured dot lines under and above price when conditions are met. Arrows Red and Green for entry Points. User can change the colours of the arrows in the colour section of the indicator. It is consider a great scalping tool on lower time-frames, while higher time frames will have fewer opportunities but trades will possibly last longer. There is an input for Alert on or off. This can be used effectively on M15/M30 Chart until up to H4 chart time. It is best if the user has some

If you consider the extremes of the daily price as important points, this indicator will help in your trades.
Now, instead of manually drawing lines that mark daily highs and lows, you can use the O (HL) ² C Lines indicator.
Thus, the OHLC Lines indicator automatically plots the lines O (Open for the current day), H (High for the current day), L (Low for the current day) and C (Close for the previous day). Plot also the high and low of the previous day.
Thus, we have 4 static lines

BinaWin NoTouch - это индикатор, который посылает сигнал тревоги, когда сделка находится в правильной позиции, чтобы дождаться пробоя бокового рынка.
Он специально разработан для торговли по стратегии «без касания» платформы Binary.Com с синтетическими индексами N.10, N.25, N.50, N.75 и N.100.
Аналогичным образом, торговля может быть осуществлена с помощью обычной стратегии CALL и PUT любой платформы бинарных опционов.
Требования к использованию индикатора:
1. Иметь учетную запись на
FREE

Introduction to Fractal Moving Average Fractal Moving Average indicator was designed as part of Fractal Pattern Scanner. Inside Fractal Pattern Scanner, Fractal Moving Average Indicator was implemented as multiple of chart objects. With over thousands of chart object, we find that it was not the best and efficient ways to operate the indicator. It was computationally too heavy for the indicator. Hence, we decide to implement the indicator version of Fractal Moving Average indicator to benefit ou
FREE

KT Trend Trading Suite is a multi-featured indicator that incorporates a trend following strategy combined with multiple breakout points as the entry signals.
Once a new trend is established, it provides several entry opportunities to ride the established trend successfully. A pullback threshold is used to avoid the less significant entry points.
MT4 Version is available here https://www.mql5.com/en/market/product/46268
Features
It combines several market dynamics into a single equati
Se considera la secuencia de la serie Fibonacci (2,3,5,8,13) que sera multiplicado por un periodo (11 o 33 o 70 etc.), de las 5 lineas se sacara una sola que sera contendrá el máximo y mínimo de las 5, a esta linea se le aplicara un suavizador de 3....y a esta linea suavizada se le volverá a aplicar un suavizador de 3. obteniéndose 2 lineas suavizadas. A simple vista se ve las intersecciones que hacen las lineas que pueden ser usadas para comprar o vender. Cambien se puede usar con apoyo de otro
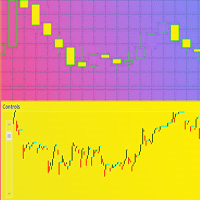
Индикатор для отображения свеч размером меньше одной минуты, вплоть до размера в одну секунду, для детализированного просмотра графика . Имеется ряд необходимых настроек для удобной визуализации. Настройка размера хранения истории ценовых данных транслируемых инструментов. Размер видимых свеч. Настройка отображения неподвижности на курсах графика. Возможность отображения на различных торговых инструментах. Удачной всем торговли.

Inspired from, Time is the most important factor in determining market movements and by studying past price records you will be able to prove to yourself history does repeat and by knowing the past you can tell the future. There is a definite relation between price and time. -William Delbert Gann Caution: It's not HolyGrail System, It's a tool to give you insight of current market structure. The decision to trade is made only with combination of economical understanding of underlying instru

DYNAMIC SR TREND CHANNEL
Dynamic SR Trend Channel is a simple indicator for trend detection as well as resistance/support levels on the current timeframe. It shows you areas where to expect possible change in trend direction and trend continuation. It works with any trading system (both price action and other trading system that use indicators) and is also very good for renko charting system as well. In an uptrend, the red line (main line) serves as the support and the blue line serves as the

Индикатор позволяет отобразить на экране уменьшенные графики любой валютной пары любого таймфрейма. Максимальное количество отображаемых графиков 28. Графики можно размещать как в основном окне, так и в "подвале". Два режима отображения: свечи и бары. Количество отображаемых данных (баров и свеч) и размеры графиков регулируются. Для работы с миничартом необходимо сначала нанести нужный индикатор(ы) на обычный график, потом сохранить в виде шаблона и применить для мини чарта шаблон через соответс
FREE

Indicator that allows the maximum and minimum of days to be marked, with real time update, closing of the previous day and beginning of the day. It is possible to define which markings will be made and also the colors for each mark. The values of each tick are displayed in the upper left corner of the screen, below the trading panel within the chart. Maximum and Minimum of the Day and Closing of the Previous Day are marked with a horizontal line, while the beginning of the day with a
FREE
Fractal Reverse MTF - Индикатор определения фрактального сигнала на разворот для МetaТrader 5
Сигнал определяется по правилам, описанным в 3ей книге Б.Вильямса: - Для того, чтобы стать сигналом к ПОКУПКЕ, фрактал должен СРАБОТАТЬ ВЫШЕ красной линии - Для того, чтобы стать сигналом к ПРОДАЖЕ, фрактал должен СРАБОТАТЬ НИЖЕ красной линии - Сигналы - не перерисовываются
Основная идея индикатора:
Определить смену направления тренда с помощью фрактала и Аллигатора и сделать это максимально

The indicator shows when there are overprice and divergences on the RSI. In addition, it has configurable alerts, dynamic overprice levels and a special “RSI cleaner” function. The indicator that automatically calculates the premium rates! RSImaxmin is an indicator based on the Relative Strength Index (RSI) oscillator that effectively identifies changes in price trends as it reflects the relative strength of bullish movements compared to bearish movements. It is widely used by traders to measur

The indicator allows you to simplify the interpretation of signals produced by the classical ADX indicator.
The position of the hight bars of the histogram relative to zero and the histogram coloring indicate the direction of price movement determined by the intersection of DI+ / DI-.
The position of the hight bars of the histogram relative to zero and the color indicate the strength of the price movement.
The indicator is a logical continuation of the series of indicators using this class
FREE
DSeize
DSeize - это индикатор для совершения покупки/продажи в MetaTrader 5. Простой и понятный индикатор, показывающий точки входа в рынок. Прекрасно подходит как для начинающих, так и для профессиональных трейдеров. Рекомендуемый таймфрейм H1. Рекомендуемые валютные пары: Мультивалютный. Работает как на 4-х, так и на 5-и значных котировках. Сигналы индикатора не перерисовываются. Особенности Вход совершается при закрытии часовой свечи и появлении индикатора.
Сигналы не перерисовываются. С
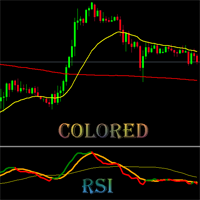
This is Colored RSI Scalper Free MT5 -is a professional indicator based on the popular Relative Strength Index (RSI) indicator with Moving Average and you can use it in Forex, Crypto, Traditional, Indices, Commodities. Colors are made to make trend, and changing trend more easily. Back test it, and find what works best for you. This product is an oscillator with dynamic overbought and oversold levels, while in the standard RSI, these levels are static and do not change.
This allows Colored RS

Expert Market Edge is scalping, trending, reversal indicator, with alerts . You can use it all and fit with your strategy whatever it fits you. My recommendation is to combine with my Colored RSI , and when 2 signals are matched, and pointing same direction (for example buy on this indicator, and green on RSI, you can take a long position, stop loss should be last local low, if you want to be more conservative, add ATR. ) you can take position. If you using moving averages, that's even better i

The indicator allows you to simplify the interpretation of signals produced by the classical MACD indicator.
It is based on the double-smoothed rate of change (ROC).
Bollinger Bands is made from EMA line.
The indicator is a logical continuation of the series of indicators using this classical and efficient technical indicator.
The strength of the trend is determined by Bands and main line.
If the bands width are smaller than the specified value, judge it as suqueeze and do not recommen
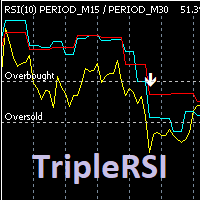
Индикатор отображает на графике данные RSI рабочего и двух старших тайм-фреймов, формирует сигналы выхода из зоны перекупленности / перепроданности кривой среднего временного периода. Опционально используется фильтр по данным старшего тайм-фрейма (расположение медленной линии выше средней для продажи и ниже средней - для покупки). Сигналы "подвального" индикатора дублируются на главном окне, отправляются сообщения во всплывающее окно, на почту и на мобильное устройство. Параметры индикатора: RSI
Pattern Finder 2 is a MULTICURRENCY indicator that scans the entire market seeking for up to 62 candlestick patterns in 15 different pairs/currencies all in one chart. It will help you to make the right decision in the right moment. You can filter the scanning following the trend by a function based on exponential moving average. You can setup parameters by an interface that appears by clicking the arrow that appear on the upperleft part of the window after you place the indicator. Parameters ar
this indicator works on all pairs of Binary.com. we recommend using it on the M5 and M15 timeframe. when a blue arrow appears you must take the purchase and red you sell. you will withdraw your profit at the next resistance or support zone. please use risk management. its very important! without this, you can't make money on long term. if there any question ask it.

This is Heiken Ashi smoothed version, where you can choose on what type smoothness you want to make your strategy base. You can choose between EMA or MA, on the period you want. And you can choose colors.
Definition:
The Heikin-Ashi technique averages price data to create a Japanese candlestick chart that filters out market noise. Heikin-Ashi charts, developed by Munehisa Homma in the 1700s, share some characteristics with standard candlestick charts but differ based on the values used to
FREE

Наверное, почти каждый трейдер хоть раз, но мечтал про незапаздывающие МА. Я воплотил эту мечту в своем индикаторе. При помощи этого индикатора можно прогнозировать будущие значения. Но основное применение индикатора заключается в генерации сигналов на покупку и продажу.
Определение рыночного тренда является важной задачей трейдеров. Индикатор Trendometer реализует усовершенствованный алгоритм для визуализации рыночного тренда. Основной целью индикатора является оценка рынка. Индикатор предн

Esse indicador é a combinação do RSI (IFR) com Média Móvel Simples aplicada o RSI em um único indicador para facilitar a criação de alguma estratégia. Fiz esse indicador para que um único indicador contenha os buffer necessários para implementar alguma EA.
Descrição dos Buffers para o EA,
Buffer 0 -> Valor do RSI Buffer 1 -> Valor da média móvel aplicada ao RSI
FREE

THE GOAT INDICATOR ON THE MQL5 MARKET! ️ GET THIS INDICATOR AND STOP LOOKING FOR ANOTHER INDICATOR ️ ️ GET IT NOW BEFORE PRICE INCREASE! ️ SPECIAL DISCOUNT FROM 138$ -> NOW ONLY 88$!!! 2020 Breakthrough Indicator! Imagine that indicators can move the price/market! This indicator use for predict price movement! Using special algorithm for predicting the next price movement! This indicator can be used in any timeframes and any symbols! You can use it for binary option signal

Индикатор показывает: Среднее значение ATR за выбранное количество периодов Пройденный ATR за текущий период (указанный для расчёта ATR)
Оставшийся ATR на текущий период (указанный для расчёта ATR) Оставшееся время до закрытия текущей свечи Спред Цену одного пункта за один лот В настройках указываются: ТаймФрейм для расчёта ATR (зависит от вашей торговой стратегии) Количество периодов для расчёта ATR Угол окна графика для отображения Смещение по горизонтали Смещение по вертикали Размер шрифта Ц

Thermo MAP is a multicurrency and multitimeframe indicator that display a smart heat map based on proprietary calculations. Watch how Forex market moved and is currently moving with a single dashboard and have a consistent and good idea of what is happening!
It can be suitable for both scalping or medium/long term, just select options that better fit your trading style Symbols list are automatically sorted based on the preferred column. There is the possibility to click on: First row, timefram
FREE
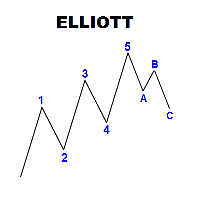
Панель с набором меток, для разметки волновой структуры Эллиотта. Вызывается панель по клавише Q, если нажать два раза, то можно перемещать панель по графику. Панель состоит из семи рядов, трёх цветных кнопок, каждая из которых создаёт 5 или 3 метки волновой разметки.
Коррекционные, состоят из 3 меток, или пять по шифту, можно обрывать цепочку меток при установке нажатием на клавишу Esc Видео инструкция: https://www.youtube.com/watch?v=nsinCM3THu4 Если обратитесь к автору в скайп: miax01, то п
А знаете ли вы, почему MetaTrader Market - лучшее место для продажи торговых стратегий и технических индикаторов? Разработчику у нас не нужно тратить время и силы на рекламу, защиту программ и расчеты с покупателями. Всё это уже сделано.
Вы упускаете торговые возможности:
- Бесплатные приложения для трейдинга
- 8 000+ сигналов для копирования
- Экономические новости для анализа финансовых рынков
Регистрация
Вход
Если у вас нет учетной записи, зарегистрируйтесь
Для авторизации и пользования сайтом MQL5.com необходимо разрешить использование файлов Сookie.
Пожалуйста, включите в вашем браузере данную настройку, иначе вы не сможете авторизоваться.