
Plantillas listas para conectar indicadores en asesores (Parte 2): Indicadores de volumen y Bill Williams

Contenido
- Introducción
- Indicadores de volumen
- Indicadores de Bill Williams
- Accelerator Oscillator
- Alligator
- Awesome Oscillator
- Fractals
- Gator Oscillator
- Market Facilitation Index
- Perfeccionamiento de las clases de panel informativo. Panorama
- Conclusión
Introducción
Este artículo es una continuación del tema de las plantillas ya preparadas para usar indicadores en asesores. Hoy veremos la conexión con asesores y el uso de indicadores de volumen e indicadores de Bill Williams. Como ejemplo, mostraremos los datos obtenidos de los indicadores en el panel informativo, que creamos en el primer artículo de esta serie. También hemos retocado el panel: al final del artículo echaremos un breve vistazo a dichos retoques.
Para cada indicador analizado, el artículo presentará plantillas ya preparadas para usar en nuestros propios programas:
- Variables de entrada y globales,
- Inicialización de las variables y creación del manejador de indicador,
- Desinicialización,
- Obtención de datos en el asesor desde el indicador,
- Ejemplo sobre cómo mostrar en el panel informativo los datos obtenidos.
Indicadores de volumen
Los indicadores de volumen son aquellos que consideran los volúmenes en sus cálculos. En el mercado de divisas, los volúmenes se refieren al número de ticks (cambios de precio) que se han producido durante un intervalo temporal. Para los instrumentos comerciados en la bolsa, los volúmenes se refieren a los volúmenes de operaciones ejecutadas (en contratos o en términos monetarios).
Acumulación/Distribución
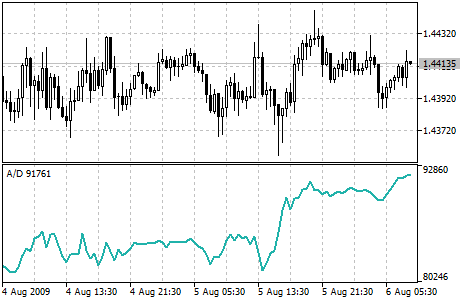
El indicador técnico de acumulación/distribución (Accumulation Distribution, A/D) está determinado por los cambios de precio y volumen. El volumen actuará como coeficiente de ponderación de las variaciones de precio: cuanto mayor sea el coeficiente (volumen), más significativa será la contribución de las variaciones de precio (en un periodo de tiempo determinado) al valor del indicador.
De hecho, este indicador supone una variante del indicador más común de volumen de balance Balance Volume). Ambos se utilizan para confirmar los cambios de precios midiendo el volumen comercial correspondiente.
Un aumento del indicador Accumulation/Distribution (A/D) significará la acumulación (compra) de un valor, ya que la mayor parte del volumen comercial se vincula con un movimiento al alza de los precios. Cuando el indicador descienda, significará la distribución (venta) del valor, ya que la gran mayoría del volumen comercial se vincula con un movimiento de precios a la baja.
Las divergencias entre el indicador Accumulation/Distribution y la cotización del valor indicarán un cambio próximo en los precios. Normalmente, en caso de divergencia, la tendencia del precio cambiará en la dirección del movimiento del indicador. Por ello, si el indicador está aumentando y el precio del valor está disminuyendo, deberíamos esperar una inversión del precio.
Parámetros
La función iAD() se utiliza para crear el manejador del indicador:
Retorna el manejador del indicador Accumulation/Distribution. Solo un búfer.
int  iAD(
   string               symbol,             // symbol name
   ENUM_TIMEFRAMES      period,             // period
   ENUM_APPLIED_VOLUME  applied_volume      // type of volume used for calculations
   );
symbol
[in] Nombre simbólico del instrumento sobre cuyos datos se calculará el indicador. NULL indicará el símbolo actual.
period
[in] El valor del periodo puede ser uno de los valores de la enumeración ENUM_TIMEFRAMES, 0 indicará el marco temporal actual.
applied_volume
[in] Volumen utilizado. Puede ser cualquiera de ENUM_APPLIED_VOLUME.
Retorna el manejador del indicador técnico especificado, en caso de fallo retornará INVALID_HANDLE. Para liberar la memoria del ordenador de un indicador que ya no se utiliza, se utilizará la función IndicatorRelease(), a la que se le transmitirá el manejador de este indicador.
Para crear un indicador en el asesor, declararemos las variables de entrada y globales:
//+------------------------------------------------------------------+
//|                                                 TestVolumeAD.mq5 |
//|                                  Copyright 2023, MetaQuotes Ltd. |
//|                                             https://www.mql5.com |
//+------------------------------------------------------------------+
#property copyright "Copyright 2023, MetaQuotes Ltd."
#property link      "https://www.mql5.com"
#property version   "1.00"
//--- enums
enum ENUM_LINE_STATE
  {
   LINE_STATE_NONE,        // Undefined state
   LINE_STATE_UP,          // Upward
   LINE_STATE_DOWN,        // Downward
   LINE_STATE_TURN_UP,     // Upward reversal
   LINE_STATE_TURN_DOWN,   // Downward reversal
   LINE_STATE_STOP_UP,     // Upward stop
   LINE_STATE_STOP_DOWN,   // Downward stop
   LINE_STATE_ABOVE,       // Above value
   LINE_STATE_UNDER,       // Below value
   LINE_STATE_CROSS_UP,    // Crossing value upwards
   LINE_STATE_CROSS_DOWN,  // Crossing value downwards
   LINE_STATE_TOUCH_BELOW, // Touching value from below
   LINE_STATE_TOUCH_ABOVE, // Touch value from above
   LINE_STATE_EQUALS,      // Equal to value
  };
//--- input parameters
input ENUM_APPLIED_VOLUME  InpVolume   =  VOLUME_TICK;   /* Applied Volume */
//--- global variables
int      handle=INVALID_HANDLE;  // Indicator handle
int      ind_digits=0;           // Number of decimal places in the indicator values
string   ind_title;              // Indicator description
La enumeración ENUM_LINE_STATE se creará para simplificar la obtención del estado de la línea de indicador: su forma (figura) y ubicación relativa a la línea de otro indicador o de algún nivel.
Podrá leer más información sobre la enumeración en la sección de los parámetros del indicador ATR en el último artículo.
Al utilizar el panel informativo en el asesor, también deberemos declarar las variables globales para él y conectar el archivo de la clase de panel:
//+------------------------------------------------------------------+
//|                                                 TestVolumeAD.mq5 |
//|                                  Copyright 2023, MetaQuotes Ltd. |
//|                                             https://www.mql5.com |
//+------------------------------------------------------------------+
#property copyright "Copyright 2023, MetaQuotes Ltd."
#property link      "https://www.mql5.com"
#property version   "1.00"
//--- includes
#include <Dashboard\Dashboard.mqh>
//--- enums
enum ENUM_LINE_STATE
  {
   LINE_STATE_NONE,        // Undefined state
   LINE_STATE_UP,          // Upward
   LINE_STATE_DOWN,        // Downward
   LINE_STATE_TURN_UP,     // Upward reversal
   LINE_STATE_TURN_DOWN,   // Downward reversal
   LINE_STATE_STOP_UP,     // Upward stop
   LINE_STATE_STOP_DOWN,   // Downward stop
   LINE_STATE_ABOVE,       // Above value
   LINE_STATE_UNDER,       // Below value
   LINE_STATE_CROSS_UP,    // Crossing value upwards
   LINE_STATE_CROSS_DOWN,  // Crossing value downwards
   LINE_STATE_TOUCH_BELOW, // Touching value from below
   LINE_STATE_TOUCH_ABOVE, // Touch value from above
   LINE_STATE_EQUALS,      // Equal to value
  };
//--- input parameters
input ENUM_APPLIED_VOLUME  InpVolume   =  VOLUME_TICK;   /* Applied Volume */
//--- global variables
int      handle=INVALID_HANDLE;  // Indicator handle
int      ind_digits=0;           // Number of decimal places in the indicator values
string   ind_title;              // Indicator description
//--- variables for the panel
int      mouse_bar_index;        // Index of the bar the data is taken from
CDashboard *panel=NULL;          // Pointer to the panel object
Inicialización
Establecimiento de los valores de las variables globales para el indicador y creación de su manejador:
//+------------------------------------------------------------------+
//| Expert initialization function                                   |
//+------------------------------------------------------------------+
int OnInit()
  {
//--- create timer
   EventSetTimer(60);

//--- Indicator
//--- Set the indicator name and the number of decimal places
   ind_title="A/D";
   ind_digits=0;
//--- Create indicator handle
   ResetLastError();
   handle=iAD(Symbol(),PERIOD_CURRENT,InpVolume);
   if(handle==INVALID_HANDLE)
     {
      PrintFormat("%s: Failed to create indicator handle %s. Error %ld",__FUNCTION__,ind_title,GetLastError());
      return INIT_FAILED;
     }

//--- Successful initialization
   return(INIT_SUCCEEDED);
  }
Al utilizar un panel informativo en el asesor, crearemos un panel:
//+------------------------------------------------------------------+
//| Expert initialization function                                   |
//+------------------------------------------------------------------+
int OnInit()
  {
//--- create timer
   EventSetTimer(60);

//--- Indicator
//--- Set the indicator name and the number of decimal places
   ind_title="A/D";
   ind_digits=0;
//--- Create indicator handle
   ResetLastError();
   handle=iAD(Symbol(),PERIOD_CURRENT,InpVolume);
   if(handle==INVALID_HANDLE)
     {
      PrintFormat("%s: Failed to create indicator handle %s. Error %ld",__FUNCTION__,ind_title,GetLastError());
      return INIT_FAILED;
     }

//--- Dashboard
//--- Create the panel
   panel=new CDashboard(1,20,20,199,225);
   if(panel==NULL)
     {
      Print("Error. Failed to create panel object");
      return INIT_FAILED;
     }
//--- Set font parameters
   panel.SetFontParams("Calibri",9);
//--- Display the panel with the "Symbol, Timeframe description" header text
   panel.View(Symbol()+", "+StringSubstr(EnumToString(Period()),7));
//--- Create a table with ID 0 to display bar data in it
   panel.CreateNewTable(0);
//--- Draw a table with ID 0 on the panel background
   panel.DrawGrid(0,2,20,6,2,18,97);

//--- Create a table with ID 1 to display indicator data in it
   panel.CreateNewTable(1);
//--- Get the Y2 table coordinate with ID 0 and
//--- set the Y1 coordinate for the table with ID 1
   int y1=panel.TableY2(0)+22;
//--- Draw a table with ID 1 on the panel background
   panel.DrawGrid(1,2,y1,3,2,18,97);

//--- Display tabular data in the journal
   panel.GridPrint(0,2);
   panel.GridPrint(1,2);
//--- Initialize the variable with the index of the mouse cursor bar
   mouse_bar_index=0;
//--- Display the data of the current bar on the panel
   DrawData(mouse_bar_index,TimeCurrent());

//--- Successful initialization
   return(INIT_SUCCEEDED);
  }
//+------------------------------------------------------------------+
Desinicialización
En el manejador OnDeinit() del asesor liberaremos el manejador del indicador:
//+------------------------------------------------------------------+
//| Expert deinitialization function                                 |
//+------------------------------------------------------------------+
void OnDeinit(const int reason)
  {
//--- destroy timer
   EventKillTimer();

//--- Release handle of the indicator
   ResetLastError();
   if(!IndicatorRelease(handle))
      PrintFormat("%s: IndicatorRelease failed. Error %ld",__FUNCTION__,GetLastError());
//--- Clear all comments on the chart
   Comment("");
  }
Al utilizar un panel informativo, eliminaremos el objeto de panel creado:
//+------------------------------------------------------------------+
//| Expert deinitialization function                                 |
//+------------------------------------------------------------------+
void OnDeinit(const int reason)
  {
//--- destroy timer
   EventKillTimer();

//--- Release handle of the indicator
   ResetLastError();
   if(!IndicatorRelease(handle))
      PrintFormat("%s: IndicatorRelease failed. Error %ld",__FUNCTION__,GetLastError());
//--- Clear all comments on the chart
   Comment("");

//--- If the panel object exists, delete it
   if(panel!=NULL)
      delete panel;
  }
Obtención de datos
A continuación se presentarán las funciones generales de la obtención de datos usando el manejador del indicador. Ya analizamos dichas funciones en el artículo sobre la conexión de osciladores en asesores. Podrá utilizar las funciones presentadas "tal cual" en sus programas:
//+------------------------------------------------------------------+
//| Return the indicator data on the specified bar                   |
//+------------------------------------------------------------------+
double IndicatorValue(const int ind_handle,const int index,const int buffer_num)
  {
   double array[1]={0};
   ResetLastError();
   if(CopyBuffer(ind_handle,buffer_num,index,1,array)!=1)
     {
      PrintFormat("%s: CopyBuffer failed. Error %ld",__FUNCTION__,GetLastError());
      return EMPTY_VALUE;
     }
   return array[0];
  }
//+------------------------------------------------------------------+
//| Return the state of the indicator line                           |
//+------------------------------------------------------------------+
ENUM_LINE_STATE LineState(const int ind_handle,const int index,const int buffer_num)
  {
//--- Get the values of the indicator line with the shift (0,1,2) relative to the passed index
   const double value0=IndicatorValue(ind_handle,index,  buffer_num);
   const double value1=IndicatorValue(ind_handle,index+1,buffer_num);
   const double value2=IndicatorValue(ind_handle,index+2,buffer_num);
//--- If at least one of the values could not be obtained, return an undefined value
   if(value0==EMPTY_VALUE || value1==EMPTY_VALUE || value2==EMPTY_VALUE)
      return LINE_STATE_NONE;
//--- Line upward reversal (value2>value1 && value0>value1)
   if(NormalizeDouble(value2-value1,ind_digits)>0 && NormalizeDouble(value0-value1,ind_digits)>0)
      return LINE_STATE_TURN_UP;
//--- Line upward direction (value2<=value1 && value0>value1)
   else if(NormalizeDouble(value2-value1,ind_digits)<=0 && NormalizeDouble(value0-value1,ind_digits)>0)
      return LINE_STATE_UP;
//--- Line upward stop (value2<=value1 && value0==value1)
   else if(NormalizeDouble(value2-value1,ind_digits)<=0 && NormalizeDouble(value0-value1,ind_digits)==0)
      return LINE_STATE_STOP_UP;
//--- Line downward reversal (value2<value1 && value0<value1)
   if(NormalizeDouble(value2-value1,ind_digits)<0 && NormalizeDouble(value0-value1,ind_digits)<0)
      return LINE_STATE_TURN_DOWN;
//--- Line downward direction (value2>=value1 && value0<value1)
   else if(NormalizeDouble(value2-value1,ind_digits)>=0 && NormalizeDouble(value0-value1,ind_digits)<0)
      return LINE_STATE_DOWN;
//--- Line downward stop (value2>=value1 && value0==value1)
   else if(NormalizeDouble(value2-value1,ind_digits)>=0 && NormalizeDouble(value0-value1,ind_digits)==0)
      return LINE_STATE_STOP_DOWN;
//--- Undefined state
   return LINE_STATE_NONE;
  }
//+------------------------------------------------------------------+
//| Return the state of the line relative to the specified level     |
//+------------------------------------------------------------------+
ENUM_LINE_STATE LineStateRelative(const int ind_handle,const int index,const int buffer_num,const double level0,const double level1=EMPTY_VALUE)
  {
//--- Get the values of the indicator line with the shift (0,1) relative to the passed index
   const double value0=IndicatorValue(ind_handle,index,  buffer_num);
   const double value1=IndicatorValue(ind_handle,index+1,buffer_num);
//--- If at least one of the values could not be obtained, return an undefined value
   if(value0==EMPTY_VALUE || value1==EMPTY_VALUE)
      return LINE_STATE_NONE;
//--- Define the second level to compare
   double level=(level1==EMPTY_VALUE ? level0 : level1);
//--- The line is below the level (value1<level && value0<level0)
   if(NormalizeDouble(value1-level,ind_digits)<0 && NormalizeDouble(value0-level0,ind_digits)<0)
      return LINE_STATE_UNDER;
//--- The line is above the level (value1>level && value0>level0)
   if(NormalizeDouble(value1-level,ind_digits)>0 && NormalizeDouble(value0-level0,ind_digits)>0)
      return LINE_STATE_ABOVE;
//--- The line crossed the level upwards (value1<=level && value0>level0)
   if(NormalizeDouble(value1-level,ind_digits)<=0 && NormalizeDouble(value0-level0,ind_digits)>0)
      return LINE_STATE_CROSS_UP;
//--- The line crossed the level downwards (value1>=level && value0<level0)
   if(NormalizeDouble(value1-level,ind_digits)>=0 && NormalizeDouble(value0-level0,ind_digits)<0)
      return LINE_STATE_CROSS_DOWN;
//--- The line touched the level from below (value1<level0 && value0==level0)
   if(NormalizeDouble(value1-level,ind_digits)<0 && NormalizeDouble(value0-level0,ind_digits)==0)
      return LINE_STATE_TOUCH_BELOW;
//--- The line touched the level from above (value1>level0 && value0==level0)
   if(NormalizeDouble(value1-level,ind_digits)>0 && NormalizeDouble(value0-level0,ind_digits)==0)
      return LINE_STATE_TOUCH_BELOW;
//--- Line is equal to the level value (value1==level0 && value0==level0)
   if(NormalizeDouble(value1-level,ind_digits)==0 && NormalizeDouble(value0-level0,ind_digits)==0)
      return LINE_STATE_EQUALS;
//--- Undefined state
   return LINE_STATE_NONE;
  }
//+------------------------------------------------------------------+
//| Return the indicator line state description                      |
//+------------------------------------------------------------------+
string LineStateDescription(const ENUM_LINE_STATE state)
  {
   switch(state)
     {
      case LINE_STATE_UP         :  return "Up";
      case LINE_STATE_STOP_UP    :  return "Stop Up";
      case LINE_STATE_TURN_UP    :  return "Turn Up";
      case LINE_STATE_DOWN       :  return "Down";
      case LINE_STATE_STOP_DOWN  :  return "Stop Down";
      case LINE_STATE_TURN_DOWN  :  return "Turn Down";
      case LINE_STATE_ABOVE      :  return "Above level";
      case LINE_STATE_UNDER      :  return "Under level";
      case LINE_STATE_CROSS_UP   :  return "Crossing Up";
      case LINE_STATE_CROSS_DOWN :  return "Crossing Down";
      case LINE_STATE_TOUCH_BELOW:  return "Touch from Below";
      case LINE_STATE_TOUCH_ABOVE:  return "Touch from Above";
      case LINE_STATE_EQUALS     :  return "Equals";
      default                    :  return "Unknown";
     }
  }
Al utilizar el panel informativo, los datos se mostrarán en el panel utilizando la función:
//+------------------------------------------------------------------+
//| Display data from the specified timeseries index to the panel    |
//+------------------------------------------------------------------+
void DrawData(const int index,const datetime time)
  {
//--- Declare the variables to receive data in them
   MqlTick  tick={0};
   MqlRates rates[1];

//--- Exit if unable to get the current prices
   if(!SymbolInfoTick(Symbol(),tick))
      return;
//--- Exit if unable to get the bar data by the specified index
   if(CopyRates(Symbol(),PERIOD_CURRENT,index,1,rates)!=1)
      return;

//--- Set font parameters for bar and indicator data headers
   int  size=0;
   uint flags=0;
   uint angle=0;
   string name=panel.FontParams(size,flags,angle);
   panel.SetFontParams(name,9,FW_BOLD);
   panel.DrawText("Bar data ["+(string)index+"]",3,panel.TableY1(0)-16,clrMaroon,panel.Width()-6);
   panel.DrawText("Indicator data ["+(string)index+"]",3,panel.TableY1(1)-16,clrGreen,panel.Width()-6);
//--- Set font parameters for bar and indicator data
   panel.SetFontParams(name,9);

//--- Display the data of the specified bar in table 0 on the panel
   panel.DrawText("Date",  panel.CellX(0,0,0)+2, panel.CellY(0,0,0)+2); panel.DrawText(TimeToString(  rates[0].time,TIME_DATE),     panel.CellX(0,0,1)+2, panel.CellY(0,0,1)+2,clrNONE,90);
   panel.DrawText("Time",  panel.CellX(0,1,0)+2, panel.CellY(0,1,0)+2); panel.DrawText(TimeToString(  rates[0].time,TIME_MINUTES),  panel.CellX(0,1,1)+2, panel.CellY(0,1,1)+2,clrNONE,90);
   panel.DrawText("Open",  panel.CellX(0,2,0)+2, panel.CellY(0,2,0)+2); panel.DrawText(DoubleToString(rates[0].open,Digits()),      panel.CellX(0,2,1)+2, panel.CellY(0,2,1)+2,clrNONE,90);
   panel.DrawText("High",  panel.CellX(0,3,0)+2, panel.CellY(0,3,0)+2); panel.DrawText(DoubleToString(rates[0].high,Digits()),      panel.CellX(0,3,1)+2, panel.CellY(0,3,1)+2,clrNONE,90);
   panel.DrawText("Low",   panel.CellX(0,4,0)+2, panel.CellY(0,4,0)+2); panel.DrawText(DoubleToString(rates[0].low,Digits()),       panel.CellX(0,4,1)+2, panel.CellY(0,4,1)+2,clrNONE,90);
   panel.DrawText("Close", panel.CellX(0,5,0)+2, panel.CellY(0,5,0)+2); panel.DrawText(DoubleToString(rates[0].close,Digits()),     panel.CellX(0,5,1)+2, panel.CellY(0,5,1)+2,clrNONE,90);

//--- Display the indicator data from the specified bar on the panel in table 1
   panel.DrawText(ind_title, panel.CellX(1,0,0)+2, panel.CellY(1,0,0)+2);
   double value=IndicatorValue(handle,index,0);
   string value_str=(value!=EMPTY_VALUE ? DoubleToString(value,ind_digits) : "");
   panel.DrawText(value_str,panel.CellX(1,0,1)+2,panel.CellY(1,0,1)+2,clrNONE,90);

//--- Display a description of the indicator line state
   panel.DrawText("Line state", panel.CellX(1,1,0)+2, panel.CellY(1,1,0)+2);
   ENUM_LINE_STATE state=LineState(handle,index,0);
   panel.DrawText(LineStateDescription(state),panel.CellX(1,1,1)+2,panel.CellY(1,1,1)+2,clrNONE,90);

//--- Redraw the chart to immediately display all changes on the panel
   ChartRedraw(ChartID());
  }
Además, al utilizar un panel informativo, el manejador de eventos OnChartEvent() del asesor llamará al manejador de eventos del panel informativo y procesará los eventos para obtener el índice de la barra bajo el cursor:
//+------------------------------------------------------------------+
//| ChartEvent function                                              |
//+------------------------------------------------------------------+
void OnChartEvent(const int id,
                  const long &lparam,
                  const double &dparam,
                  const string &sparam)
  {
//--- Handling the panel
//--- Call the panel event handler
   panel.OnChartEvent(id,lparam,dparam,sparam);

//--- If the cursor moves or a click is made on the chart
   if(id==CHARTEVENT_MOUSE_MOVE || id==CHARTEVENT_CLICK)
     {
      //--- Declare the variables to record time and price coordinates in them
      datetime time=0;
      double price=0;
      int wnd=0;
      //--- If the cursor coordinates are converted to date and time
      if(ChartXYToTimePrice(ChartID(),(int)lparam,(int)dparam,wnd,time,price))
        {
         //--- write the bar index where the cursor is located to a global variable
         mouse_bar_index=iBarShift(Symbol(),PERIOD_CURRENT,time);
         //--- Display the bar data under the cursor on the panel
         DrawData(mouse_bar_index,time);
        }
     }

//--- If we received a custom event, display the appropriate message in the journal
   if(id>CHARTEVENT_CUSTOM)
     {
      //--- Here we can implement handling a click on the close button on the panel
      PrintFormat("%s: Event id=%ld, object id (lparam): %lu, event message (sparam): %s",__FUNCTION__,id,lparam,sparam);
     }
  }
Tras compilar y ejecutar el asesor en el gráfico, podremos controlar el valor y el estado de la línea de indicador en el panel informativo:
Podrá ver el archivo del asesor de pruebas "TestVolumeAD.mq5" en los archivos adjuntos.
Money Flow Index
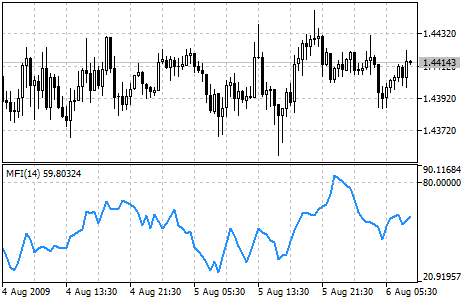
El indicador técnico Índice de flujos monetarios Money Flow Index (MFI) muestra la intensidad con la que se invierte dinero en un valor o se retira del mismo. La construcción e interpretación del indicador resulta similar al Relative Strength Index, con la única diferencia de que el MFI tiene en cuenta el volumen.
Al analizar el MFI, deberemos considerar:
- las divergencias entre el indicador y los movimientos del precio. Si los precios suben y el valor del MFI baja (o viceversa), existirá una alta probabilidad de que se produzca una inversión de los precios;
- Los valores del MFI superiores a 80 e inferiores a 20 señalarán un posible máximo y mínimo del mercado, respectivamente.
Parámetros
La función iMFI() se utiliza para crear el manejador del indicador:
int  iMFI(
   string               symbol,             // symbol name
   ENUM_TIMEFRAMES      period,             // period
   int                  ma_period,          // averaging period
   ENUM_APPLIED_VOLUME  applied_volume      // type of volume used for calculations
   );
symbol
[in] Nombre simbólico del instrumento sobre cuyos datos se calculará el indicador. NULL indicará el símbolo actual.
period
[in] El valor del periodo puede ser uno de los valores de la enumeración ENUM_TIMEFRAMES, 0 indicará el marco temporal actual.
ma_period
[in] Periodo (número de barras) de cálculo del indicador.
applied_volume
[in] Volumen usado. Puede ser cualquiera de ENUM_APPLIED_VOLUME.
Retorna el manejador del indicador técnico especificado, en caso de fallo retornará INVALID_HANDLE. Para liberar la memoria del ordenador de un indicador que ya no se utiliza, se utilizará la función IndicatorRelease(), a la que se le transmitirá el manejador de este indicador.
Para crear un indicador en el asesor, declararemos las variables de entrada y globales:
//+------------------------------------------------------------------+
//|                                                TestVolumeMFI.mq5 |
//|                                  Copyright 2023, MetaQuotes Ltd. |
//|                                             https://www.mql5.com |
//+------------------------------------------------------------------+
#property copyright "Copyright 2023, MetaQuotes Ltd."
#property link      "https://www.mql5.com"
#property version   "1.00"
//--- enums
enum ENUM_LINE_STATE
  {
   LINE_STATE_NONE,        // Undefined state
   LINE_STATE_UP,          // Upward
   LINE_STATE_DOWN,        // Downward
   LINE_STATE_TURN_UP,     // Upward reversal
   LINE_STATE_TURN_DOWN,   // Downward reversal
   LINE_STATE_STOP_UP,     // Upward stop
   LINE_STATE_STOP_DOWN,   // Downward stop
   LINE_STATE_ABOVE,       // Above value
   LINE_STATE_UNDER,       // Below value
   LINE_STATE_CROSS_UP,    // Crossing value upwards
   LINE_STATE_CROSS_DOWN,  // Crossing value downwards
   LINE_STATE_TOUCH_BELOW, // Touching value from below
   LINE_STATE_TOUCH_ABOVE, // Touch value from above
   LINE_STATE_EQUALS,      // Equal to value
  };
//--- input parameters
input uint                 InpPeriod   =  14;            /* Period         */
input ENUM_APPLIED_VOLUME  InpVolume   =  VOLUME_TICK;   /* Applied Volume */
input double               InpOverbough=  80;            /* Overbough level*/
input double               InpOversold =  20;            /* Oversold level */
//--- global variables
int      handle=INVALID_HANDLE;  // Indicator handle
int      period=0;               // RSI calculation period
int      ind_digits=0;           // Number of decimal places in the indicator values
double   overbough=0;            // Overbought level
double   oversold=0;             // Oversold level
string   ind_title;              // Indicator description
Al utilizar el panel informativo en el asesor, también declararemos las variables globales para él y conectaremos el archivo de clases del panel:
//+------------------------------------------------------------------+
//|                                                TestVolumeMFI.mq5 |
//|                                  Copyright 2023, MetaQuotes Ltd. |
//|                                             https://www.mql5.com |
//+------------------------------------------------------------------+
#property copyright "Copyright 2023, MetaQuotes Ltd."
#property link      "https://www.mql5.com"
#property version   "1.00"
//--- includes
#include <Dashboard\Dashboard.mqh>
//--- enums
enum ENUM_LINE_STATE
  {
   LINE_STATE_NONE,        // Undefined state
   LINE_STATE_UP,          // Upward
   LINE_STATE_DOWN,        // Downward
   LINE_STATE_TURN_UP,     // Upward reversal
   LINE_STATE_TURN_DOWN,   // Downward reversal
   LINE_STATE_STOP_UP,     // Upward stop
   LINE_STATE_STOP_DOWN,   // Downward stop
   LINE_STATE_ABOVE,       // Above value
   LINE_STATE_UNDER,       // Below value
   LINE_STATE_CROSS_UP,    // Crossing value upwards
   LINE_STATE_CROSS_DOWN,  // Crossing value downwards
   LINE_STATE_TOUCH_BELOW, // Touching value from below
   LINE_STATE_TOUCH_ABOVE, // Touch value from above
   LINE_STATE_EQUALS,      // Equal to value
  };
//--- input parameters
input uint                 InpPeriod   =  14;            /* Period         */
input ENUM_APPLIED_VOLUME  InpVolume   =  VOLUME_TICK;   /* Applied Volume */
input double               InpOverbough=  80;            /* Overbough level*/
input double               InpOversold =  20;            /* Oversold level */
//--- global variables
int      handle=INVALID_HANDLE;  // Indicator handle
int      period=0;               // RSI calculation period
int      ind_digits=0;           // Number of decimal places in the indicator values
double   overbough=0;            // Overbought level
double   oversold=0;             // Oversold level
string   ind_title;              // Indicator description
//--- variables for the panel
int      mouse_bar_index;        // Index of the bar the data is taken from
CDashboard *panel=NULL;          // Pointer to the panel object
Inicialización
Establecimiento de los valores de las variables globales para el indicador y creación de su manejador:
//+------------------------------------------------------------------+
//| Expert initialization function                                   |
//+------------------------------------------------------------------+
int OnInit()
  {
//--- create timer
   EventSetTimer(60);

//--- Indicator
//--- Set and adjust the calculation period and levels if necessary
   period=int(InpPeriod<1 ? 14 : InpPeriod);
   overbough=InpOverbough;
   oversold=(InpOversold>=overbough ? overbough-0.01 : InpOversold);
//--- Set the indicator name and the number of decimal places
   ind_title=StringFormat("MFI(%lu)",period);
   ind_digits=Digits();
//--- Create indicator handle
   ResetLastError();
   handle=iMFI(Symbol(),PERIOD_CURRENT,period,InpVolume);
   if(handle==INVALID_HANDLE)
     {
      PrintFormat("%s: Failed to create indicator handle %s. Error %ld",__FUNCTION__,ind_title,GetLastError());
      return INIT_FAILED;
     }

//--- Successful initialization
   return(INIT_SUCCEEDED);
  }
Al utilizar un panel informativo en el asesor, crearemos un panel:
//+------------------------------------------------------------------+
//| Expert initialization function                                   |
//+------------------------------------------------------------------+
int OnInit()
  {
//--- create timer
   EventSetTimer(60);

//--- Indicator
//--- Set and adjust the calculation period and levels if necessary
   period=int(InpPeriod<1 ? 14 : InpPeriod);
   overbough=InpOverbough;
   oversold=(InpOversold>=overbough ? overbough-0.01 : InpOversold);
//--- Set the indicator name and the number of decimal places
   ind_title=StringFormat("MFI(%lu)",period);
   ind_digits=Digits();
//--- Create indicator handle
   ResetLastError();
   handle=iMFI(Symbol(),PERIOD_CURRENT,period,InpVolume);
   if(handle==INVALID_HANDLE)
     {
      PrintFormat("%s: Failed to create indicator handle %s. Error %ld",__FUNCTION__,ind_title,GetLastError());
      return INIT_FAILED;
     }

//--- Dashboard
//--- Create the panel
   panel=new CDashboard(1,20,20,229,243);
   if(panel==NULL)
     {
      Print("Error. Failed to create panel object");
      return INIT_FAILED;
     }
//--- Set font parameters
   panel.SetFontParams("Calibri",9);
//--- Display the panel with the "Symbol, Timeframe description" header text
   panel.View(Symbol()+", "+StringSubstr(EnumToString(Period()),7));
//--- Create a table with ID 0 to display bar data in it
   panel.CreateNewTable(0);
//--- Draw a table with ID 0 on the panel background
   panel.DrawGrid(0,2,20,6,2,18,112);

//--- Create a table with ID 1 to display indicator data in it
   panel.CreateNewTable(1);
//--- Get the Y2 table coordinate with ID 0 and
//--- set the Y1 coordinate for the table with ID 1
   int y1=panel.TableY2(0)+22;
//--- Draw a table with ID 1 on the panel background
   panel.DrawGrid(1,2,y1,4,2,18,112);

//--- Display tabular data in the journal
   panel.GridPrint(0,2);
   panel.GridPrint(1,2);
//--- Initialize the variable with the index of the mouse cursor bar
   mouse_bar_index=0;
//--- Display the data of the current bar on the panel
   DrawData(mouse_bar_index,TimeCurrent());

//--- Successful initialization
   return(INIT_SUCCEEDED);
  }
Desinicialización
En el manejador OnDeinit() del asesor liberaremos el manejador del indicador:
//+------------------------------------------------------------------+
//| Expert deinitialization function                                 |
//+------------------------------------------------------------------+
void OnDeinit(const int reason)
  {
//--- destroy timer
   EventKillTimer();

//--- Release handle of the indicator
   ResetLastError();
   if(!IndicatorRelease(handle))
      PrintFormat("%s: IndicatorRelease failed. Error %ld",__FUNCTION__,GetLastError());
//--- Clear all comments on the chart
   Comment("");
  }
Al utilizar un panel informativo, eliminaremos el objeto de panel creado:
//+------------------------------------------------------------------+
//| Expert deinitialization function                                 |
//+------------------------------------------------------------------+
void OnDeinit(const int reason)
  {
//--- destroy timer
   EventKillTimer();

//--- Release handle of the indicator
   ResetLastError();
   if(!IndicatorRelease(handle))
      PrintFormat("%s: IndicatorRelease failed. Error %ld",__FUNCTION__,GetLastError());
//--- Clear all comments on the chart
   Comment("");

//--- If the panel object exists, delete it
   if(panel!=NULL)
      delete panel;
  }
Obtención de datos
A continuación se presentarán las funciones generales de la obtención de datos usando el manejador del indicador. Ya analizamos dichas funciones en el artículo sobre la conexión de osciladores en asesores. Podrá utilizar las funciones presentadas "tal cual" en sus programas:
//+------------------------------------------------------------------+
//| Return the indicator data on the specified bar                   |
//+------------------------------------------------------------------+
double IndicatorValue(const int ind_handle,const int index,const int buffer_num)
  {
   double array[1]={0};
   ResetLastError();
   if(CopyBuffer(ind_handle,buffer_num,index,1,array)!=1)
     {
      PrintFormat("%s: CopyBuffer failed. Error %ld",__FUNCTION__,GetLastError());
      return EMPTY_VALUE;
     }
   return array[0];
  }
//+------------------------------------------------------------------+
//| Return the state of the indicator line                           |
//+------------------------------------------------------------------+
ENUM_LINE_STATE LineState(const int ind_handle,const int index,const int buffer_num)
  {
//--- Get the values of the indicator line with the shift (0,1,2) relative to the passed index
   const double value0=IndicatorValue(ind_handle,index,  buffer_num);
   const double value1=IndicatorValue(ind_handle,index+1,buffer_num);
   const double value2=IndicatorValue(ind_handle,index+2,buffer_num);
//--- If at least one of the values could not be obtained, return an undefined value
   if(value0==EMPTY_VALUE || value1==EMPTY_VALUE || value2==EMPTY_VALUE)
      return LINE_STATE_NONE;
//--- Line upward reversal (value2>value1 && value0>value1)
   if(NormalizeDouble(value2-value1,ind_digits)>0 && NormalizeDouble(value0-value1,ind_digits)>0)
      return LINE_STATE_TURN_UP;
//--- Line upward direction (value2<=value1 && value0>value1)
   else if(NormalizeDouble(value2-value1,ind_digits)<=0 && NormalizeDouble(value0-value1,ind_digits)>0)
      return LINE_STATE_UP;
//--- Line upward stop (value2<=value1 && value0==value1)
   else if(NormalizeDouble(value2-value1,ind_digits)<=0 && NormalizeDouble(value0-value1,ind_digits)==0)
      return LINE_STATE_STOP_UP;
//--- Line downward reversal (value2<value1 && value0<value1)
   if(NormalizeDouble(value2-value1,ind_digits)<0 && NormalizeDouble(value0-value1,ind_digits)<0)
      return LINE_STATE_TURN_DOWN;
//--- Line downward direction (value2>=value1 && value0<value1)
   else if(NormalizeDouble(value2-value1,ind_digits)>=0 && NormalizeDouble(value0-value1,ind_digits)<0)
      return LINE_STATE_DOWN;
//--- Line downward stop (value2>=value1 && value0==value1)
   else if(NormalizeDouble(value2-value1,ind_digits)>=0 && NormalizeDouble(value0-value1,ind_digits)==0)
      return LINE_STATE_STOP_DOWN;
//--- Undefined state
   return LINE_STATE_NONE;
  }
//+------------------------------------------------------------------+
//| Return the state of the line relative to the specified level     |
//+------------------------------------------------------------------+
ENUM_LINE_STATE LineStateRelative(const int ind_handle,const int index,const int buffer_num,const double level0,const double level1=EMPTY_VALUE)
  {
//--- Get the values of the indicator line with the shift (0,1) relative to the passed index
   const double value0=IndicatorValue(ind_handle,index,  buffer_num);
   const double value1=IndicatorValue(ind_handle,index+1,buffer_num);
//--- If at least one of the values could not be obtained, return an undefined value
   if(value0==EMPTY_VALUE || value1==EMPTY_VALUE)
      return LINE_STATE_NONE;
//--- Define the second level to compare
   double level=(level1==EMPTY_VALUE ? level0 : level1);
//--- The line is below the level (value1<level && value0<level0)
   if(NormalizeDouble(value1-level,ind_digits)<0 && NormalizeDouble(value0-level0,ind_digits)<0)
      return LINE_STATE_UNDER;
//--- The line is above the level (value1>level && value0>level0)
   if(NormalizeDouble(value1-level,ind_digits)>0 && NormalizeDouble(value0-level0,ind_digits)>0)
      return LINE_STATE_ABOVE;
//--- The line crossed the level upwards (value1<=level && value0>level0)
   if(NormalizeDouble(value1-level,ind_digits)<=0 && NormalizeDouble(value0-level0,ind_digits)>0)
      return LINE_STATE_CROSS_UP;
//--- The line crossed the level downwards (value1>=level && value0<level0)
   if(NormalizeDouble(value1-level,ind_digits)>=0 && NormalizeDouble(value0-level0,ind_digits)<0)
      return LINE_STATE_CROSS_DOWN;
//--- The line touched the level from below (value1<level0 && value0==level0)
   if(NormalizeDouble(value1-level,ind_digits)<0 && NormalizeDouble(value0-level0,ind_digits)==0)
      return LINE_STATE_TOUCH_BELOW;
//--- The line touched the level from above (value1>level0 && value0==level0)
   if(NormalizeDouble(value1-level,ind_digits)>0 && NormalizeDouble(value0-level0,ind_digits)==0)
      return LINE_STATE_TOUCH_BELOW;
//--- Line is equal to the level value (value1==level0 && value0==level0)
   if(NormalizeDouble(value1-level,ind_digits)==0 && NormalizeDouble(value0-level0,ind_digits)==0)
      return LINE_STATE_EQUALS;
//--- Undefined state
   return LINE_STATE_NONE;
  }
//+------------------------------------------------------------------+
//| Return the indicator line state description                      |
//+------------------------------------------------------------------+
string LineStateDescription(const ENUM_LINE_STATE state)
  {
   switch(state)
     {
      case LINE_STATE_UP         :  return "Up";
      case LINE_STATE_STOP_UP    :  return "Stop Up";
      case LINE_STATE_TURN_UP    :  return "Turn Up";
      case LINE_STATE_DOWN       :  return "Down";
      case LINE_STATE_STOP_DOWN  :  return "Stop Down";
      case LINE_STATE_TURN_DOWN  :  return "Turn Down";
      case LINE_STATE_ABOVE      :  return "Above level";
      case LINE_STATE_UNDER      :  return "Under level";
      case LINE_STATE_CROSS_UP   :  return "Crossing Up";
      case LINE_STATE_CROSS_DOWN :  return "Crossing Down";
      case LINE_STATE_TOUCH_BELOW:  return "Touch from Below";
      case LINE_STATE_TOUCH_ABOVE:  return "Touch from Above";
      case LINE_STATE_EQUALS     :  return "Equals";
      default                    :  return "Unknown";
     }
  }
Al utilizar el panel informativo, los datos se mostrarán en el panel utilizando la función:
//+------------------------------------------------------------------+
//| Display data from the specified timeseries index to the panel    |
//+------------------------------------------------------------------+
void DrawData(const int index,const datetime time)
  {
//--- Declare the variables to receive data in them
   MqlTick  tick={0};
   MqlRates rates[1];

//--- Exit if unable to get the current prices
   if(!SymbolInfoTick(Symbol(),tick))
      return;
//--- Exit if unable to get the bar data by the specified index
   if(CopyRates(Symbol(),PERIOD_CURRENT,index,1,rates)!=1)
      return;

//--- Set font parameters for bar and indicator data headers
   int  size=0;
   uint flags=0;
   uint angle=0;
   string name=panel.FontParams(size,flags,angle);
   panel.SetFontParams(name,9,FW_BOLD);
   panel.DrawText("Bar data ["+(string)index+"]",3,panel.TableY1(0)-16,clrMaroon,panel.Width()-6);
   panel.DrawText("Indicator data ["+(string)index+"]",3,panel.TableY1(1)-16,clrGreen,panel.Width()-6);
//--- Set font parameters for bar and indicator data
   panel.SetFontParams(name,9);

//--- Display the data of the specified bar in table 0 on the panel
   panel.DrawText("Date",  panel.CellX(0,0,0)+2, panel.CellY(0,0,0)+2); panel.DrawText(TimeToString(  rates[0].time,TIME_DATE),     panel.CellX(0,0,1)+2, panel.CellY(0,0,1)+2,clrNONE,90);
   panel.DrawText("Time",  panel.CellX(0,1,0)+2, panel.CellY(0,1,0)+2); panel.DrawText(TimeToString(  rates[0].time,TIME_MINUTES),  panel.CellX(0,1,1)+2, panel.CellY(0,1,1)+2,clrNONE,90);
   panel.DrawText("Open",  panel.CellX(0,2,0)+2, panel.CellY(0,2,0)+2); panel.DrawText(DoubleToString(rates[0].open,Digits()),      panel.CellX(0,2,1)+2, panel.CellY(0,2,1)+2,clrNONE,90);
   panel.DrawText("High",  panel.CellX(0,3,0)+2, panel.CellY(0,3,0)+2); panel.DrawText(DoubleToString(rates[0].high,Digits()),      panel.CellX(0,3,1)+2, panel.CellY(0,3,1)+2,clrNONE,90);
   panel.DrawText("Low",   panel.CellX(0,4,0)+2, panel.CellY(0,4,0)+2); panel.DrawText(DoubleToString(rates[0].low,Digits()),       panel.CellX(0,4,1)+2, panel.CellY(0,4,1)+2,clrNONE,90);
   panel.DrawText("Close", panel.CellX(0,5,0)+2, panel.CellY(0,5,0)+2); panel.DrawText(DoubleToString(rates[0].close,Digits()),     panel.CellX(0,5,1)+2, panel.CellY(0,5,1)+2,clrNONE,90);

//--- Display the indicator data from the specified bar on the panel in table 1
   panel.DrawText(ind_title, panel.CellX(1,0,0)+2, panel.CellY(1,0,0)+2);
   double value=IndicatorValue(handle,index,0);
   string value_str=(value!=EMPTY_VALUE ? DoubleToString(value,ind_digits) : "");
   panel.DrawText(value_str,panel.CellX(1,0,1)+2,panel.CellY(1,0,1)+2,clrNONE,100);

//--- Display a description of the indicator line state relative to the overbought level
   string ovb=StringFormat("%+.2f",overbough);
   panel.DrawText("Overbough", panel.CellX(1,2,0)+2, panel.CellY(1,2,0)+2);
   panel.DrawText(ovb, panel.CellX(1,2,0)+66, panel.CellY(1,2,0)+2);
   ENUM_LINE_STATE state_ovb=LineStateRelative(handle,index,0,overbough);
//--- The label color changes depending on the value of the line relative to the level
   color clr=(state_ovb==LINE_STATE_CROSS_DOWN ? clrRed : clrNONE);
   string ovb_str=(state_ovb==LINE_STATE_ABOVE ? "Inside the area" : LineStateDescription(state_ovb));
   panel.DrawText(ovb_str,panel.CellX(1,2,1)+2,panel.CellY(1,2,1)+2,clr,100);

//--- Display a description of the indicator line state relative to the oversold level
   panel.DrawText("Oversold", panel.CellX(1,3,0)+2, panel.CellY(1,3,0)+2);
   string ovs=StringFormat("%+.2f",oversold);
   panel.DrawText(ovs, panel.CellX(1,3,0)+68, panel.CellY(1,3,0)+2);
   ENUM_LINE_STATE state_ovs=LineStateRelative(handle,index,0,oversold);
//--- The label color changes depending on the value of the line relative to the level
   clr=(state_ovs==LINE_STATE_CROSS_UP ? clrBlue : clrNONE);
   string ovs_str=(state_ovs==LINE_STATE_UNDER ? "Inside the area" : LineStateDescription(state_ovs));
   panel.DrawText(ovs_str,panel.CellX(1,3,1)+2,panel.CellY(1,3,1)+2,clr,100);

//--- Display a description of the indicator line state
   panel.DrawText("Line state", panel.CellX(1,1,0)+2, panel.CellY(1,1,0)+2);
   ENUM_LINE_STATE state=LineState(handle,index,0);
//--- The label color changes depending on the location of the line in the overbought/oversold areas
   clr=(state_ovb==LINE_STATE_ABOVE || state_ovb==LINE_STATE_CROSS_DOWN ? clrRed : state_ovs==LINE_STATE_UNDER || state_ovs==LINE_STATE_CROSS_UP ? clrBlue : clrNONE);
   panel.DrawText(LineStateDescription(state),panel.CellX(1,1,1)+2,panel.CellY(1,1,1)+2,clr,100);

//--- Redraw the chart to immediately display all changes on the panel
   ChartRedraw(ChartID());
  }
La ubicación de la línea del indicador en las zonas de sobrecompra/sobreventa se marcará en el panel usando el color del texto.
Además, al utilizar un panel informativo, el manejador de eventos OnChartEvent() del asesor llamará al manejador de eventos del panel informativo y procesará los eventos para obtener el índice de la barra bajo el cursor:
//+------------------------------------------------------------------+
//| ChartEvent function                                              |
//+------------------------------------------------------------------+
void OnChartEvent(const int id,
                  const long &lparam,
                  const double &dparam,
                  const string &sparam)
  {
//--- Handling the panel
//--- Call the panel event handler
   panel.OnChartEvent(id,lparam,dparam,sparam);

//--- If the cursor moves or a click is made on the chart
   if(id==CHARTEVENT_MOUSE_MOVE || id==CHARTEVENT_CLICK)
     {
      //--- Declare the variables to record time and price coordinates in them
      datetime time=0;
      double price=0;
      int wnd=0;
      //--- If the cursor coordinates are converted to date and time
      if(ChartXYToTimePrice(ChartID(),(int)lparam,(int)dparam,wnd,time,price))
        {
         //--- write the bar index where the cursor is located to a global variable
         mouse_bar_index=iBarShift(Symbol(),PERIOD_CURRENT,time);
         //--- Display the bar data under the cursor on the panel
         DrawData(mouse_bar_index,time);
        }
     }

//--- If we received a custom event, display the appropriate message in the journal
   if(id>CHARTEVENT_CUSTOM)
     {
      //--- Here we can implement handling a click on the close button on the panel
      PrintFormat("%s: Event id=%ld, object id (lparam): %lu, event message (sparam): %s",__FUNCTION__,id,lparam,sparam);
     }
  }
Tras compilar y ejecutar el asesor en el gráfico, podremos supervisar el valor y el estado de la línea de indicador en el panel informativo:
Podrá ver el archivo del asesor de pruebas "TestVolumeMFI.mq5" en los archivos adjuntos.
On Balance Volume
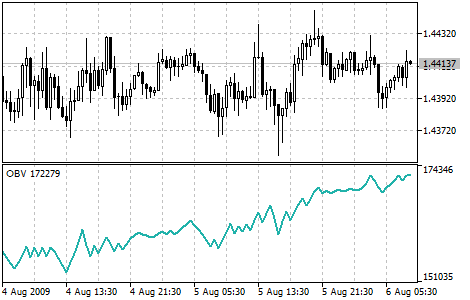
El indicador técnico de Volumen de Balance On Balance Volume (OBV) vincula el volumen y el cambio de precio que acompaña a ese volumen. El significado de este indicador, inventado por Joseph Granville, es sencillo. Si el precio de cierre de la barra actual es superior al cierre de la barra anterior, el valor del volumen de la barra actual se sumará al valor OBV anterior; si el cierre de la barra actual es inferior al de la barra anterior, el volumen actual se restará del valor OBV anterior.
La interpretación del indicador OBV se basará en el principio de que las variaciones del OBV superarán a las del precio. Según este principio, un aumento en el volumen del balance indicará que los profesionales están invirtiendo en el instrumento. Cuando, más tarde, el público en general empiece también a invertir, tanto el precio como las lecturas del indicador OBV empezarán a dispararse.
Si el precio se adelanta en su movimiento al indicador OBV, se producirá la llamada "ausencia de confirmación". Esto puede observarse en el pico de un mercado alcista (cuando el precio asciende sin el aumento correspondiente en el OBV o por delante de él) o en el valle de un mercado bajista (cuando el precio desciende sin la disminución correspondiente en el OBV o por delante de él).
Podemos hablar de una tendencia alcista del OBV si cada nuevo máximo es superior al anterior y cada nuevo mínimo es superior al anterior. Por analogía, una tendencia a la baja del OBV implicará picos y valles sucesivamente más bajos. Cuando el OBV se mueve en un corredor horizontal sin picos ni caídas constantes, nos encontraremos ante una tendencia incierta.
Si se establece una tendencia, esta se mantendrá hasta que se invierta. Las rupturas en la tendencia del indicador OBV pueden ocurrir de dos maneras. En el primer caso, la tendencia cambiará de alcista a bajista, o de bajista a alcista.
En el segundo caso de ruptura, la tendencia OBV se volverá incierta y permanecerá así durante más de tres periodos. Por consiguiente, si una tendencia alcista cambia a una tendencia incierta y se mantiene así durante solo dos periodos y luego vuelve a cambiar a una tendencia alcista, deberemos suponer que la tendencia OBV ha sido alcista todo el tiempo.
Cuando la tendencia del indicador On Balance Volume cambia a una tendencia alcista o bajista, se producirá la denominada "ruptura". Como las rupturas de los indicadores suelen preceder a las rupturas de los precios, los inversores deberían tomar posiciones largas en las rupturas al alza del OBV y, en consecuencia, vender en las rupturas a la baja del OBV. Las posiciones abiertas deberán mantenerse hasta que cambie la dirección de la tendencia.
Parámetros
La función iOBV() se utiliza para crear el manejador del indicador:
Retorna el manejador del indicador de volumen en balance. Solo un búfer.
int  iOBV(
   string                symbol,             // symbol name
   ENUM_TIMEFRAMES       period,             // period
   ENUM_APPLIED_VOLUME   applied_volume      // type of volume used for calculations
   );
[in] Nombre simbólico del instrumento sobre cuyos datos se calculará el indicador. NULL indicará el símbolo actual.
period
[in] El valor del periodo puede ser uno de los valores de la enumeración ENUM_TIMEFRAMES, 0 indicará el marco temporal actual.
applied_volume
[in] Volumen usado. Puede ser cualquiera de los valores de la enumeración ENUM_APPLIED_VOLUME.
Retorna el manejador del indicador técnico especificado, en caso de fallo retornará INVALID_HANDLE. Para liberar la memoria del ordenador de un indicador que ya no se utiliza, se utilizará la función IndicatorRelease(), a la que se le transmitirá el manejador de este indicador.
Para crear un indicador en el asesor, declararemos las variables de entrada y las variables globales:
//+------------------------------------------------------------------+
//|                                                TestVolumeOBV.mq5 |
//|                                  Copyright 2023, MetaQuotes Ltd. |
//|                                             https://www.mql5.com |
//+------------------------------------------------------------------+
#property copyright "Copyright 2023, MetaQuotes Ltd."
#property link      "https://www.mql5.com"
#property version   "1.00"
//--- enums
enum ENUM_LINE_STATE
  {
   LINE_STATE_NONE,        // Undefined state
   LINE_STATE_UP,          // Upward
   LINE_STATE_DOWN,        // Downward
   LINE_STATE_TURN_UP,     // Upward reversal
   LINE_STATE_TURN_DOWN,   // Downward reversal
   LINE_STATE_STOP_UP,     // Upward stop
   LINE_STATE_STOP_DOWN,   // Downward stop
   LINE_STATE_ABOVE,       // Above value
   LINE_STATE_UNDER,       // Below value
   LINE_STATE_CROSS_UP,    // Crossing value upwards
   LINE_STATE_CROSS_DOWN,  // Crossing value downwards
   LINE_STATE_TOUCH_BELOW, // Touching value from below
   LINE_STATE_TOUCH_ABOVE, // Touch value from above
   LINE_STATE_EQUALS,      // Equal to value
  };
//--- input parameters
input ENUM_APPLIED_VOLUME  InpVolume   =  VOLUME_TICK;   /* Applied Volume */
//--- global variables
int      handle=INVALID_HANDLE;  // Indicator handle
int      ind_digits=0;           // Number of decimal places in the indicator values
string   ind_title;              // Indicator description
Al utilizar el panel informativo en el asesor, también declararemos las variables globales para él y conectaremos el archivo de clases del panel:
//+------------------------------------------------------------------+
//|                                                TestVolumeOBV.mq5 |
//|                                  Copyright 2023, MetaQuotes Ltd. |
//|                                             https://www.mql5.com |
//+------------------------------------------------------------------+
#property copyright "Copyright 2023, MetaQuotes Ltd."
#property link      "https://www.mql5.com"
#property version   "1.00"
//--- includes
#include <Dashboard\Dashboard.mqh>
//--- enums
enum ENUM_LINE_STATE
  {
   LINE_STATE_NONE,        // Undefined state
   LINE_STATE_UP,          // Upward
   LINE_STATE_DOWN,        // Downward
   LINE_STATE_TURN_UP,     // Upward reversal
   LINE_STATE_TURN_DOWN,   // Downward reversal
   LINE_STATE_STOP_UP,     // Upward stop
   LINE_STATE_STOP_DOWN,   // Downward stop
   LINE_STATE_ABOVE,       // Above value
   LINE_STATE_UNDER,       // Below value
   LINE_STATE_CROSS_UP,    // Crossing value upwards
   LINE_STATE_CROSS_DOWN,  // Crossing value downwards
   LINE_STATE_TOUCH_BELOW, // Touching value from below
   LINE_STATE_TOUCH_ABOVE, // Touch value from above
   LINE_STATE_EQUALS,      // Equal to value
  };
//--- input parameters
input ENUM_APPLIED_VOLUME  InpVolume   =  VOLUME_TICK;   /* Applied Volume */
//--- global variables
int      handle=INVALID_HANDLE;  // Indicator handle
int      ind_digits=0;           // Number of decimal places in the indicator values
string   ind_title;              // Indicator description
//--- variables for the panel
int      mouse_bar_index;        // Index of the bar the data is taken from
CDashboard *panel=NULL;          // Pointer to the panel object
Inicialización
Establecimiento de los valores de las variables globales para el indicador y creación de su manejador:
//+------------------------------------------------------------------+
//| Expert initialization function                                   |
//+------------------------------------------------------------------+
int OnInit()
  {
//--- create timer
   EventSetTimer(60);

//--- Indicator
//--- Set the indicator name and the number of decimal places
   ind_title="OBV";
   ind_digits=0;
//--- Create indicator handle
   ResetLastError();
   handle=iOBV(Symbol(),PERIOD_CURRENT,InpVolume);
   if(handle==INVALID_HANDLE)
     {
      PrintFormat("%s: Failed to create indicator handle %s. Error %ld",__FUNCTION__,ind_title,GetLastError());
      return INIT_FAILED;
     }

//--- Successful initialization
   return(INIT_SUCCEEDED);
  }
Al utilizar un panel informativo en el asesor, crearemos un panel:
//+------------------------------------------------------------------+
//| Expert initialization function                                   |
//+------------------------------------------------------------------+
int OnInit()
  {
//--- create timer
   EventSetTimer(60);

//--- Indicator
//--- Set the indicator name and the number of decimal places
   ind_title="OBV";
   ind_digits=0;
//--- Create indicator handle
   ResetLastError();
   handle=iOBV(Symbol(),PERIOD_CURRENT,InpVolume);
   if(handle==INVALID_HANDLE)
     {
      PrintFormat("%s: Failed to create indicator handle %s. Error %ld",__FUNCTION__,ind_title,GetLastError());
      return INIT_FAILED;
     }

//--- Dashboard
//--- Create the panel
   panel=new CDashboard(1,20,20,199,225);
   if(panel==NULL)
     {
      Print("Error. Failed to create panel object");
      return INIT_FAILED;
     }
//--- Set font parameters
   panel.SetFontParams("Calibri",9);
//--- Display the panel with the "Symbol, Timeframe description" header text
   panel.View(Symbol()+", "+StringSubstr(EnumToString(Period()),7));
//--- Create a table with ID 0 to display bar data in it
   panel.CreateNewTable(0);
//--- Draw a table with ID 0 on the panel background
   panel.DrawGrid(0,2,20,6,2,18,97);

//--- Create a table with ID 1 to display indicator data in it
   panel.CreateNewTable(1);
//--- Get the Y2 table coordinate with ID 0 and
//--- set the Y1 coordinate for the table with ID 1
   int y1=panel.TableY2(0)+22;
//--- Draw a table with ID 1 on the panel background
   panel.DrawGrid(1,2,y1,3,2,18,97);

//--- Display tabular data in the journal
   panel.GridPrint(0,2);
   panel.GridPrint(1,2);
//--- Initialize the variable with the index of the mouse cursor bar
   mouse_bar_index=0;
//--- Display the data of the current bar on the panel
   DrawData(mouse_bar_index,TimeCurrent());

//--- Successful initialization
   return(INIT_SUCCEEDED);
  }
Desinicialización
En el manejador OnDeinit() del asesor liberaremos el manejador del indicador:
//+------------------------------------------------------------------+
//| Expert deinitialization function                                 |
//+------------------------------------------------------------------+
void OnDeinit(const int reason)
  {
//--- destroy timer
   EventKillTimer();

//--- Release handle of the indicator
   ResetLastError();
   if(!IndicatorRelease(handle))
      PrintFormat("%s: IndicatorRelease failed. Error %ld",__FUNCTION__,GetLastError());
//--- Clear all comments on the chart
   Comment("");
  }
Al utilizar un panel informativo, eliminaremos el objeto de panel creado:
//+------------------------------------------------------------------+
//| Expert deinitialization function                                 |
//+------------------------------------------------------------------+
void OnDeinit(const int reason)
  {
//--- destroy timer
   EventKillTimer();

//--- Release handle of the indicator
   ResetLastError();
   if(!IndicatorRelease(handle))
      PrintFormat("%s: IndicatorRelease failed. Error %ld",__FUNCTION__,GetLastError());
//--- Clear all comments on the chart
   Comment("");

//--- If the panel object exists, delete it
   if(panel!=NULL)
      delete panel;
  }
Obtención de datos
A continuación se presentarán las funciones generales de la obtención de datos usando el manejador del indicador. Ya analizamos dichas funciones en el artículo sobre la conexión de osciladores en asesores. Podrá utilizar las funciones presentadas "tal cual" en sus programas:
//+------------------------------------------------------------------+
//| Return the indicator data on the specified bar                   |
//+------------------------------------------------------------------+
double IndicatorValue(const int ind_handle,const int index,const int buffer_num)
  {
   double array[1]={0};
   ResetLastError();
   if(CopyBuffer(ind_handle,buffer_num,index,1,array)!=1)
     {
      PrintFormat("%s: CopyBuffer failed. Error %ld",__FUNCTION__,GetLastError());
      return EMPTY_VALUE;
     }
   return array[0];
  }
//+------------------------------------------------------------------+
//| Return the state of the indicator line                           |
//+------------------------------------------------------------------+
ENUM_LINE_STATE LineState(const int ind_handle,const int index,const int buffer_num)
  {
//--- Get the values of the indicator line with the shift (0,1,2) relative to the passed index
   const double value0=IndicatorValue(ind_handle,index,  buffer_num);
   const double value1=IndicatorValue(ind_handle,index+1,buffer_num);
   const double value2=IndicatorValue(ind_handle,index+2,buffer_num);
//--- If at least one of the values could not be obtained, return an undefined value
   if(value0==EMPTY_VALUE || value1==EMPTY_VALUE || value2==EMPTY_VALUE)
      return LINE_STATE_NONE;
//--- Line upward reversal (value2>value1 && value0>value1)
   if(NormalizeDouble(value2-value1,ind_digits)>0 && NormalizeDouble(value0-value1,ind_digits)>0)
      return LINE_STATE_TURN_UP;
//--- Line upward direction (value2<=value1 && value0>value1)
   else if(NormalizeDouble(value2-value1,ind_digits)<=0 && NormalizeDouble(value0-value1,ind_digits)>0)
      return LINE_STATE_UP;
//--- Line upward stop (value2<=value1 && value0==value1)
   else if(NormalizeDouble(value2-value1,ind_digits)<=0 && NormalizeDouble(value0-value1,ind_digits)==0)
      return LINE_STATE_STOP_UP;
//--- Line downward reversal (value2<value1 && value0<value1)
   if(NormalizeDouble(value2-value1,ind_digits)<0 && NormalizeDouble(value0-value1,ind_digits)<0)
      return LINE_STATE_TURN_DOWN;
//--- Line downward direction (value2>=value1 && value0<value1)
   else if(NormalizeDouble(value2-value1,ind_digits)>=0 && NormalizeDouble(value0-value1,ind_digits)<0)
      return LINE_STATE_DOWN;
//--- Line downward stop (value2>=value1 && value0==value1)
   else if(NormalizeDouble(value2-value1,ind_digits)>=0 && NormalizeDouble(value0-value1,ind_digits)==0)
      return LINE_STATE_STOP_DOWN;
//--- Undefined state
   return LINE_STATE_NONE;
  }
//+------------------------------------------------------------------+
//| Return the state of the line relative to the specified level     |
//+------------------------------------------------------------------+
ENUM_LINE_STATE LineStateRelative(const int ind_handle,const int index,const int buffer_num,const double level0,const double level1=EMPTY_VALUE)
  {
//--- Get the values of the indicator line with the shift (0,1) relative to the passed index
   const double value0=IndicatorValue(ind_handle,index,  buffer_num);
   const double value1=IndicatorValue(ind_handle,index+1,buffer_num);
//--- If at least one of the values could not be obtained, return an undefined value
   if(value0==EMPTY_VALUE || value1==EMPTY_VALUE)
      return LINE_STATE_NONE;
//--- Define the second level to compare
   double level=(level1==EMPTY_VALUE ? level0 : level1);
//--- The line is below the level (value1<level && value0<level0)
   if(NormalizeDouble(value1-level,ind_digits)<0 && NormalizeDouble(value0-level0,ind_digits)<0)
      return LINE_STATE_UNDER;
//--- The line is above the level (value1>level && value0>level0)
   if(NormalizeDouble(value1-level,ind_digits)>0 && NormalizeDouble(value0-level0,ind_digits)>0)
      return LINE_STATE_ABOVE;
//--- The line crossed the level upwards (value1<=level && value0>level0)
   if(NormalizeDouble(value1-level,ind_digits)<=0 && NormalizeDouble(value0-level0,ind_digits)>0)
      return LINE_STATE_CROSS_UP;
//--- The line crossed the level downwards (value1>=level && value0<level0)
   if(NormalizeDouble(value1-level,ind_digits)>=0 && NormalizeDouble(value0-level0,ind_digits)<0)
      return LINE_STATE_CROSS_DOWN;
//--- The line touched the level from below (value1<level0 && value0==level0)
   if(NormalizeDouble(value1-level,ind_digits)<0 && NormalizeDouble(value0-level0,ind_digits)==0)
      return LINE_STATE_TOUCH_BELOW;
//--- The line touched the level from above (value1>level0 && value0==level0)
   if(NormalizeDouble(value1-level,ind_digits)>0 && NormalizeDouble(value0-level0,ind_digits)==0)
      return LINE_STATE_TOUCH_BELOW;
//--- Line is equal to the level value (value1==level0 && value0==level0)
   if(NormalizeDouble(value1-level,ind_digits)==0 && NormalizeDouble(value0-level0,ind_digits)==0)
      return LINE_STATE_EQUALS;
//--- Undefined state
   return LINE_STATE_NONE;
  }
//+------------------------------------------------------------------+
//| Return the indicator line state description                      |
//+------------------------------------------------------------------+
string LineStateDescription(const ENUM_LINE_STATE state)
  {
   switch(state)
     {
      case LINE_STATE_UP         :  return "Up";
      case LINE_STATE_STOP_UP    :  return "Stop Up";
      case LINE_STATE_TURN_UP    :  return "Turn Up";
      case LINE_STATE_DOWN       :  return "Down";
      case LINE_STATE_STOP_DOWN  :  return "Stop Down";
      case LINE_STATE_TURN_DOWN  :  return "Turn Down";
      case LINE_STATE_ABOVE      :  return "Above level";
      case LINE_STATE_UNDER      :  return "Under level";
      case LINE_STATE_CROSS_UP   :  return "Crossing Up";
      case LINE_STATE_CROSS_DOWN :  return "Crossing Down";
      case LINE_STATE_TOUCH_BELOW:  return "Touch from Below";
      case LINE_STATE_TOUCH_ABOVE:  return "Touch from Above";
      case LINE_STATE_EQUALS     :  return "Equals";
      default                    :  return "Unknown";
     }
  }
Al utilizar el panel informativo, los datos se mostrarán en el panel utilizando la función:
//+------------------------------------------------------------------+
//| Display data from the specified timeseries index to the panel    |
//+------------------------------------------------------------------+
void DrawData(const int index,const datetime time)
  {
//--- Declare the variables to receive data in them
   MqlTick  tick={0};
   MqlRates rates[1];

//--- Exit if unable to get the current prices
   if(!SymbolInfoTick(Symbol(),tick))
      return;
//--- Exit if unable to get the bar data by the specified index
   if(CopyRates(Symbol(),PERIOD_CURRENT,index,1,rates)!=1)
      return;

//--- Set font parameters for bar and indicator data headers
   int  size=0;
   uint flags=0;
   uint angle=0;
   string name=panel.FontParams(size,flags,angle);
   panel.SetFontParams(name,9,FW_BOLD);
   panel.DrawText("Bar data ["+(string)index+"]",3,panel.TableY1(0)-16,clrMaroon,panel.Width()-6);
   panel.DrawText("Indicator data ["+(string)index+"]",3,panel.TableY1(1)-16,clrGreen,panel.Width()-6);
//--- Set font parameters for bar and indicator data
   panel.SetFontParams(name,9);

//--- Display the data of the specified bar in table 0 on the panel
   panel.DrawText("Date",  panel.CellX(0,0,0)+2, panel.CellY(0,0,0)+2); panel.DrawText(TimeToString(  rates[0].time,TIME_DATE),     panel.CellX(0,0,1)+2, panel.CellY(0,0,1)+2,clrNONE,90);
   panel.DrawText("Time",  panel.CellX(0,1,0)+2, panel.CellY(0,1,0)+2); panel.DrawText(TimeToString(  rates[0].time,TIME_MINUTES),  panel.CellX(0,1,1)+2, panel.CellY(0,1,1)+2,clrNONE,90);
   panel.DrawText("Open",  panel.CellX(0,2,0)+2, panel.CellY(0,2,0)+2); panel.DrawText(DoubleToString(rates[0].open,Digits()),      panel.CellX(0,2,1)+2, panel.CellY(0,2,1)+2,clrNONE,90);
   panel.DrawText("High",  panel.CellX(0,3,0)+2, panel.CellY(0,3,0)+2); panel.DrawText(DoubleToString(rates[0].high,Digits()),      panel.CellX(0,3,1)+2, panel.CellY(0,3,1)+2,clrNONE,90);
   panel.DrawText("Low",   panel.CellX(0,4,0)+2, panel.CellY(0,4,0)+2); panel.DrawText(DoubleToString(rates[0].low,Digits()),       panel.CellX(0,4,1)+2, panel.CellY(0,4,1)+2,clrNONE,90);
   panel.DrawText("Close", panel.CellX(0,5,0)+2, panel.CellY(0,5,0)+2); panel.DrawText(DoubleToString(rates[0].close,Digits()),     panel.CellX(0,5,1)+2, panel.CellY(0,5,1)+2,clrNONE,90);

//--- Display the indicator data from the specified bar on the panel in table 1
   panel.DrawText(ind_title, panel.CellX(1,0,0)+2, panel.CellY(1,0,0)+2);
   double value=IndicatorValue(handle,index,0);
   string value_str=(value!=EMPTY_VALUE ? DoubleToString(value,ind_digits) : "");
   panel.DrawText(value_str,panel.CellX(1,0,1)+2,panel.CellY(1,0,1)+2,clrNONE,90);

//--- Display a description of the indicator line state
   panel.DrawText("Line state", panel.CellX(1,1,0)+2, panel.CellY(1,1,0)+2);
   ENUM_LINE_STATE state=LineState(handle,index,0);
   panel.DrawText(LineStateDescription(state),panel.CellX(1,1,1)+2,panel.CellY(1,1,1)+2,clrNONE,90);

//--- Redraw the chart to immediately display all changes on the panel
   ChartRedraw(ChartID());
  }
Además, al utilizar un panel informativo, el manejador de eventos OnChartEvent() del asesor llamará al manejador de eventos del panel informativo y procesará los eventos para obtener el índice de la barra bajo el cursor:
//+------------------------------------------------------------------+
//| ChartEvent function                                              |
//+------------------------------------------------------------------+
void OnChartEvent(const int id,
                  const long &lparam,
                  const double &dparam,
                  const string &sparam)
  {
//--- Handling the panel
//--- Call the panel event handler
   panel.OnChartEvent(id,lparam,dparam,sparam);

//--- If the cursor moves or a click is made on the chart
   if(id==CHARTEVENT_MOUSE_MOVE || id==CHARTEVENT_CLICK)
     {
      //--- Declare the variables to record time and price coordinates in them
      datetime time=0;
      double price=0;
      int wnd=0;
      //--- If the cursor coordinates are converted to date and time
      if(ChartXYToTimePrice(ChartID(),(int)lparam,(int)dparam,wnd,time,price))
        {
         //--- write the bar index where the cursor is located to a global variable
         mouse_bar_index=iBarShift(Symbol(),PERIOD_CURRENT,time);
         //--- Display the bar data under the cursor on the panel
         DrawData(mouse_bar_index,time);
        }
     }

//--- If we received a custom event, display the appropriate message in the journal
   if(id>CHARTEVENT_CUSTOM)
     {
      //--- Here we can implement handling a click on the close button on the panel
      PrintFormat("%s: Event id=%ld, object id (lparam): %lu, event message (sparam): %s",__FUNCTION__,id,lparam,sparam);
     }
  }
Tras compilar y ejecutar el asesor en el gráfico, podremos controlar el valor y el estado de la línea de indicador en el panel informativo:
Podrá ver el archivo del asesor de pruebas "TestVolumeOBV.mq5" en los archivos adjuntos.
Volúmenes
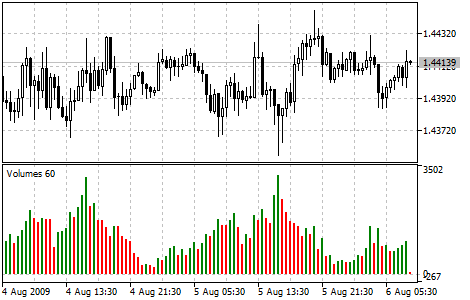
Para el mercado Fórex, el indicador Volumes supone un indicador del número de cambios de precio durante cada periodo del marco temporal seleccionado. Para los instrumentos bursátiles, este indicador representa una medida de los volúmenes reales comerciados (contratos, dinero, piezas, etcétera).
Parámetros
La función iVolumes() se utiliza para crear el manejador del indicador:
Retorna el manejador del indicador que muestra los volúmenes. Solo un búfer.
int  iVolumes(
   string               symbol,             // symbol name
   ENUM_TIMEFRAMES      period,             // period
   ENUM_APPLIED_VOLUME  applied_volume      // volume type
   )
symbol
[in] Nombre simbólico del instrumento sobre cuyos datos se calculará el indicador. NULL indicará el símbolo actual.
period
[in] El valor del periodo puede ser uno de los valores de la enumeración ENUM_TIMEFRAMES, 0 indicará el marco temporal actual.
applied_volume
[in] Volumen usado. Puede ser cualquiera de los valores de la enumeración ENUM_APPLIED_VOLUME.
Retorna el manejador del indicador técnico especificado, en caso de fallo retornará INVALID_HANDLE. Para liberar la memoria del ordenador de un indicador que ya no se utiliza, se utilizará la función IndicatorRelease(), a la que se le transmitirá el manejador de este indicador.
Para crear un indicador en el asesor, declararemos las variables de entrada y las variables globales:
//+------------------------------------------------------------------+
//|                                                TestVolumeOBV.mq5 |
//|                                  Copyright 2023, MetaQuotes Ltd. |
//|                                             https://www.mql5.com |
//+------------------------------------------------------------------+
#property copyright "Copyright 2023, MetaQuotes Ltd."
#property link      "https://www.mql5.com"
#property version   "1.00"
//--- enums
enum ENUM_LINE_STATE
  {
   LINE_STATE_NONE,        // Undefined state
   LINE_STATE_UP,          // Upward
   LINE_STATE_DOWN,        // Downward
   LINE_STATE_TURN_UP,     // Upward reversal
   LINE_STATE_TURN_DOWN,   // Downward reversal
   LINE_STATE_STOP_UP,     // Upward stop
   LINE_STATE_STOP_DOWN,   // Downward stop
   LINE_STATE_ABOVE,       // Above value
   LINE_STATE_UNDER,       // Below value
   LINE_STATE_CROSS_UP,    // Crossing value upwards
   LINE_STATE_CROSS_DOWN,  // Crossing value downwards
   LINE_STATE_TOUCH_BELOW, // Touching value from below
   LINE_STATE_TOUCH_ABOVE, // Touch value from above
   LINE_STATE_EQUALS,      // Equal to value
  };
//--- input parameters
input ENUM_APPLIED_VOLUME  InpVolume   =  VOLUME_TICK;   /* Applied Volume */
//--- global variables
int      handle=INVALID_HANDLE;  // Indicator handle
int      ind_digits=0;           // Number of decimal places in the indicator values
string   ind_title;              // Indicator description
Al utilizar el panel informativo en el asesor, también declararemos las variables globales para él y conectaremos el archivo de clases del panel:
//+------------------------------------------------------------------+
//|                                                TestVolumeOBV.mq5 |
//|                                  Copyright 2023, MetaQuotes Ltd. |
//|                                             https://www.mql5.com |
//+------------------------------------------------------------------+
#property copyright "Copyright 2023, MetaQuotes Ltd."
#property link      "https://www.mql5.com"
#property version   "1.00"
//--- includes
#include <Dashboard\Dashboard.mqh>
//--- enums
enum ENUM_LINE_STATE
  {
   LINE_STATE_NONE,        // Undefined state
   LINE_STATE_UP,          // Upward
   LINE_STATE_DOWN,        // Downward
   LINE_STATE_TURN_UP,     // Upward reversal
   LINE_STATE_TURN_DOWN,   // Downward reversal
   LINE_STATE_STOP_UP,     // Upward stop
   LINE_STATE_STOP_DOWN,   // Downward stop
   LINE_STATE_ABOVE,       // Above value
   LINE_STATE_UNDER,       // Below value
   LINE_STATE_CROSS_UP,    // Crossing value upwards
   LINE_STATE_CROSS_DOWN,  // Crossing value downwards
   LINE_STATE_TOUCH_BELOW, // Touching value from below
   LINE_STATE_TOUCH_ABOVE, // Touch value from above
   LINE_STATE_EQUALS,      // Equal to value
  };
//--- input parameters
input ENUM_APPLIED_VOLUME  InpVolume   =  VOLUME_TICK;   /* Applied Volume */
//--- global variables
int      handle=INVALID_HANDLE;  // Indicator handle
int      ind_digits=0;           // Number of decimal places in the indicator values
string   ind_title;              // Indicator description
//--- variables for the panel
int      mouse_bar_index;        // Index of the bar the data is taken from
CDashboard *panel=NULL;          // Pointer to the panel object
Inicialización
Establecimiento de los valores de las variables globales para el indicador y creación de su manejador:
//+------------------------------------------------------------------+
//| Expert initialization function                                   |
//+------------------------------------------------------------------+
int OnInit()
  {
//--- create timer
   EventSetTimer(60);

//--- Indicator
//--- Set the indicator name and the number of decimal places
   ind_title="Volumes";
   ind_digits=0;
//--- Create indicator handle
   ResetLastError();
   handle=iVolumes(Symbol(),PERIOD_CURRENT,InpVolume);
   if(handle==INVALID_HANDLE)
     {
      PrintFormat("%s: Failed to create indicator handle %s. Error %ld",__FUNCTION__,ind_title,GetLastError());
      return INIT_FAILED;
     }

//--- Successful initialization
   return(INIT_SUCCEEDED);
  }
Al utilizar un panel informativo en el asesor, crearemos un panel:
//+------------------------------------------------------------------+
//| Expert initialization function                                   |
//+------------------------------------------------------------------+
int OnInit()
  {
//--- create timer
   EventSetTimer(60);

//--- Indicator
//--- Set the indicator name and the number of decimal places
   ind_title="Volumes";
   ind_digits=0;
//--- Create indicator handle
   ResetLastError();
   handle=iVolumes(Symbol(),PERIOD_CURRENT,InpVolume);
   if(handle==INVALID_HANDLE)
     {
      PrintFormat("%s: Failed to create indicator handle %s. Error %ld",__FUNCTION__,ind_title,GetLastError());
      return INIT_FAILED;
     }

//--- Dashboard
//--- Create the panel
   panel=new CDashboard(1,20,20,199,225);
   if(panel==NULL)
     {
      Print("Error. Failed to create panel object");
      return INIT_FAILED;
     }
//--- Set font parameters
   panel.SetFontParams("Calibri",9);
//--- Display the panel with the "Symbol, Timeframe description" header text
   panel.View(Symbol()+", "+StringSubstr(EnumToString(Period()),7));
//--- Create a table with ID 0 to display bar data in it
   panel.CreateNewTable(0);
//--- Draw a table with ID 0 on the panel background
   panel.DrawGrid(0,2,20,6,2,18,97);

//--- Create a table with ID 1 to display indicator data in it
   panel.CreateNewTable(1);
//--- Get the Y2 table coordinate with ID 0 and
//--- set the Y1 coordinate for the table with ID 1
   int y1=panel.TableY2(0)+22;
//--- Draw a table with ID 1 on the panel background
   panel.DrawGrid(1,2,y1,3,2,18,97);

//--- Display tabular data in the journal
   panel.GridPrint(0,2);
   panel.GridPrint(1,2);
//--- Initialize the variable with the index of the mouse cursor bar
   mouse_bar_index=0;
//--- Display the data of the current bar on the panel
   DrawData(mouse_bar_index,TimeCurrent());

//--- Successful initialization
   return(INIT_SUCCEEDED);
  }
Desinicialización
En el manejador OnDeinit() del asesor liberaremos el manejador del indicador:
//+------------------------------------------------------------------+
//| Expert deinitialization function                                 |
//+------------------------------------------------------------------+
void OnDeinit(const int reason)
  {
//--- destroy timer
   EventKillTimer();

//--- Release handle of the indicator
   ResetLastError();
   if(!IndicatorRelease(handle))
      PrintFormat("%s: IndicatorRelease failed. Error %ld",__FUNCTION__,GetLastError());
//--- Clear all comments on the chart
   Comment("");
  }
Al utilizar un panel informativo, eliminaremos el objeto de panel creado:
//+------------------------------------------------------------------+
//| Expert deinitialization function                                 |
//+------------------------------------------------------------------+
void OnDeinit(const int reason)
  {
//--- destroy timer
   EventKillTimer();

//--- Release handle of the indicator
   ResetLastError();
   if(!IndicatorRelease(handle))
      PrintFormat("%s: IndicatorRelease failed. Error %ld",__FUNCTION__,GetLastError());
//--- Clear all comments on the chart
   Comment("");

//--- If the panel object exists, delete it
   if(panel!=NULL)
      delete panel;
  }
Obtención de datos
A continuación se presentarán las funciones generales de la obtención de datos usando el manejador del indicador. Ya analizamos dichas funciones en el artículo sobre la conexión de osciladores en asesores. Podrá utilizar las funciones presentadas "tal cual" en sus programas:
//+------------------------------------------------------------------+
//| Return the indicator data on the specified bar                   |
//+------------------------------------------------------------------+
double IndicatorValue(const int ind_handle,const int index,const int buffer_num)
  {
   double array[1]={0};
   ResetLastError();
   if(CopyBuffer(ind_handle,buffer_num,index,1,array)!=1)
     {
      PrintFormat("%s: CopyBuffer failed. Error %ld",__FUNCTION__,GetLastError());
      return EMPTY_VALUE;
     }
   return array[0];
  }
//+------------------------------------------------------------------+
//| Return the state of the indicator line                           |
//+------------------------------------------------------------------+
ENUM_LINE_STATE LineState(const int ind_handle,const int index,const int buffer_num)
  {
//--- Get the values of the indicator line with the shift (0,1,2) relative to the passed index
   const double value0=IndicatorValue(ind_handle,index,  buffer_num);
   const double value1=IndicatorValue(ind_handle,index+1,buffer_num);
   const double value2=IndicatorValue(ind_handle,index+2,buffer_num);
//--- If at least one of the values could not be obtained, return an undefined value
   if(value0==EMPTY_VALUE || value1==EMPTY_VALUE || value2==EMPTY_VALUE)
      return LINE_STATE_NONE;
//--- Line upward reversal (value2>value1 && value0>value1)
   if(NormalizeDouble(value2-value1,ind_digits)>0 && NormalizeDouble(value0-value1,ind_digits)>0)
      return LINE_STATE_TURN_UP;
//--- Line upward direction (value2<=value1 && value0>value1)
   else if(NormalizeDouble(value2-value1,ind_digits)<=0 && NormalizeDouble(value0-value1,ind_digits)>0)
      return LINE_STATE_UP;
//--- Line upward stop (value2<=value1 && value0==value1)
   else if(NormalizeDouble(value2-value1,ind_digits)<=0 && NormalizeDouble(value0-value1,ind_digits)==0)
      return LINE_STATE_STOP_UP;
//--- Line downward reversal (value2<value1 && value0<value1)
   if(NormalizeDouble(value2-value1,ind_digits)<0 && NormalizeDouble(value0-value1,ind_digits)<0)
      return LINE_STATE_TURN_DOWN;
//--- Line downward direction (value2>=value1 && value0<value1)
   else if(NormalizeDouble(value2-value1,ind_digits)>=0 && NormalizeDouble(value0-value1,ind_digits)<0)
      return LINE_STATE_DOWN;
//--- Line downward stop (value2>=value1 && value0==value1)
   else if(NormalizeDouble(value2-value1,ind_digits)>=0 && NormalizeDouble(value0-value1,ind_digits)==0)
      return LINE_STATE_STOP_DOWN;
//--- Undefined state
   return LINE_STATE_NONE;
  }
//+------------------------------------------------------------------+
//| Return the state of the line relative to the specified level     |
//+------------------------------------------------------------------+
ENUM_LINE_STATE LineStateRelative(const int ind_handle,const int index,const int buffer_num,const double level0,const double level1=EMPTY_VALUE)
  {
//--- Get the values of the indicator line with the shift (0,1) relative to the passed index
   const double value0=IndicatorValue(ind_handle,index,  buffer_num);
   const double value1=IndicatorValue(ind_handle,index+1,buffer_num);
//--- If at least one of the values could not be obtained, return an undefined value
   if(value0==EMPTY_VALUE || value1==EMPTY_VALUE)
      return LINE_STATE_NONE;
//--- Define the second level to compare
   double level=(level1==EMPTY_VALUE ? level0 : level1);
//--- The line is below the level (value1<level && value0<level0)
   if(NormalizeDouble(value1-level,ind_digits)<0 && NormalizeDouble(value0-level0,ind_digits)<0)
      return LINE_STATE_UNDER;
//--- The line is above the level (value1>level && value0>level0)
   if(NormalizeDouble(value1-level,ind_digits)>0 && NormalizeDouble(value0-level0,ind_digits)>0)
      return LINE_STATE_ABOVE;
//--- The line crossed the level upwards (value1<=level && value0>level0)
   if(NormalizeDouble(value1-level,ind_digits)<=0 && NormalizeDouble(value0-level0,ind_digits)>0)
      return LINE_STATE_CROSS_UP;
//--- The line crossed the level downwards (value1>=level && value0<level0)
   if(NormalizeDouble(value1-level,ind_digits)>=0 && NormalizeDouble(value0-level0,ind_digits)<0)
      return LINE_STATE_CROSS_DOWN;
//--- The line touched the level from below (value1<level0 && value0==level0)
   if(NormalizeDouble(value1-level,ind_digits)<0 && NormalizeDouble(value0-level0,ind_digits)==0)
      return LINE_STATE_TOUCH_BELOW;
//--- The line touched the level from above (value1>level0 && value0==level0)
   if(NormalizeDouble(value1-level,ind_digits)>0 && NormalizeDouble(value0-level0,ind_digits)==0)
      return LINE_STATE_TOUCH_BELOW;
//--- Line is equal to the level value (value1==level0 && value0==level0)
   if(NormalizeDouble(value1-level,ind_digits)==0 && NormalizeDouble(value0-level0,ind_digits)==0)
      return LINE_STATE_EQUALS;
//--- Undefined state
   return LINE_STATE_NONE;
  }
//+------------------------------------------------------------------+
//| Return the indicator line state description                      |
//+------------------------------------------------------------------+
string LineStateDescription(const ENUM_LINE_STATE state)
  {
   switch(state)
     {
      case LINE_STATE_UP         :  return "Up";
      case LINE_STATE_STOP_UP    :  return "Stop Up";
      case LINE_STATE_TURN_UP    :  return "Turn Up";
      case LINE_STATE_DOWN       :  return "Down";
      case LINE_STATE_STOP_DOWN  :  return "Stop Down";
      case LINE_STATE_TURN_DOWN  :  return "Turn Down";
      case LINE_STATE_ABOVE      :  return "Above level";
      case LINE_STATE_UNDER      :  return "Under level";
      case LINE_STATE_CROSS_UP   :  return "Crossing Up";
      case LINE_STATE_CROSS_DOWN :  return "Crossing Down";
      case LINE_STATE_TOUCH_BELOW:  return "Touch from Below";
      case LINE_STATE_TOUCH_ABOVE:  return "Touch from Above";
      case LINE_STATE_EQUALS     :  return "Equals";
      default                    :  return "Unknown";
     }
  }
Al utilizar el panel informativo, los datos se mostrarán en el panel utilizando la función:
//+------------------------------------------------------------------+
//| Display data from the specified timeseries index to the panel    |
//+------------------------------------------------------------------+
void DrawData(const int index,const datetime time)
  {
//--- Declare the variables to receive data in them
   MqlTick  tick={0};
   MqlRates rates[1];

//--- Exit if unable to get the current prices
   if(!SymbolInfoTick(Symbol(),tick))
      return;
//--- Exit if unable to get the bar data by the specified index
   if(CopyRates(Symbol(),PERIOD_CURRENT,index,1,rates)!=1)
      return;

//--- Set font parameters for bar and indicator data headers
   int  size=0;
   uint flags=0;
   uint angle=0;
   string name=panel.FontParams(size,flags,angle);
   panel.SetFontParams(name,9,FW_BOLD);
   panel.DrawText("Bar data ["+(string)index+"]",3,panel.TableY1(0)-16,clrMaroon,panel.Width()-6);
   panel.DrawText("Indicator data ["+(string)index+"]",3,panel.TableY1(1)-16,clrGreen,panel.Width()-6);
//--- Set font parameters for bar and indicator data
   panel.SetFontParams(name,9);

//--- Display the data of the specified bar in table 0 on the panel
   panel.DrawText("Date",  panel.CellX(0,0,0)+2, panel.CellY(0,0,0)+2); panel.DrawText(TimeToString(  rates[0].time,TIME_DATE),     panel.CellX(0,0,1)+2, panel.CellY(0,0,1)+2,clrNONE,90);
   panel.DrawText("Time",  panel.CellX(0,1,0)+2, panel.CellY(0,1,0)+2); panel.DrawText(TimeToString(  rates[0].time,TIME_MINUTES),  panel.CellX(0,1,1)+2, panel.CellY(0,1,1)+2,clrNONE,90);
   panel.DrawText("Open",  panel.CellX(0,2,0)+2, panel.CellY(0,2,0)+2); panel.DrawText(DoubleToString(rates[0].open,Digits()),      panel.CellX(0,2,1)+2, panel.CellY(0,2,1)+2,clrNONE,90);
   panel.DrawText("High",  panel.CellX(0,3,0)+2, panel.CellY(0,3,0)+2); panel.DrawText(DoubleToString(rates[0].high,Digits()),      panel.CellX(0,3,1)+2, panel.CellY(0,3,1)+2,clrNONE,90);
   panel.DrawText("Low",   panel.CellX(0,4,0)+2, panel.CellY(0,4,0)+2); panel.DrawText(DoubleToString(rates[0].low,Digits()),       panel.CellX(0,4,1)+2, panel.CellY(0,4,1)+2,clrNONE,90);
   panel.DrawText("Close", panel.CellX(0,5,0)+2, panel.CellY(0,5,0)+2); panel.DrawText(DoubleToString(rates[0].close,Digits()),     panel.CellX(0,5,1)+2, panel.CellY(0,5,1)+2,clrNONE,90);

//--- Display the indicator data from the specified bar on the panel in table 1
   panel.DrawText(ind_title, panel.CellX(1,0,0)+2, panel.CellY(1,0,0)+2);
   double value0=IndicatorValue(handle,index,  0);
   double value1=IndicatorValue(handle,index+1,0);
   string value_str=(value0!=EMPTY_VALUE ? DoubleToString(value0,ind_digits) : "");
   color clr=(value0>value1 ? clrGreen : value0<value1 ? clrRed : clrNONE);
   panel.DrawText(value_str,panel.CellX(1,0,1)+2,panel.CellY(1,0,1)+2,clrNONE,90);

//--- Display a description of the indicator line state
   panel.DrawText("Line state", panel.CellX(1,1,0)+2, panel.CellY(1,1,0)+2);
   ENUM_LINE_STATE state=LineState(handle,index,0);
   panel.DrawText(LineStateDescription(state),panel.CellX(1,1,1)+2,panel.CellY(1,1,1)+2,clr,90);

//--- Redraw the chart to immediately display all changes on the panel
   ChartRedraw(ChartID());
  }
El color del texto del estado en el panel se corresponderá con el color de la columna indicadora sobre la que se encuentra el cursor.
Además, al utilizar un panel informativo, el manejador de eventos OnChartEvent() del asesor llamará al manejador de eventos del panel informativo y procesará los eventos para obtener el índice de la barra bajo el cursor:
//+------------------------------------------------------------------+
//| ChartEvent function                                              |
//+------------------------------------------------------------------+
void OnChartEvent(const int id,
                  const long &lparam,
                  const double &dparam,
                  const string &sparam)
  {
//--- Handling the panel
//--- Call the panel event handler
   panel.OnChartEvent(id,lparam,dparam,sparam);

//--- If the cursor moves or a click is made on the chart
   if(id==CHARTEVENT_MOUSE_MOVE || id==CHARTEVENT_CLICK)
     {
      //--- Declare the variables to record time and price coordinates in them
      datetime time=0;
      double price=0;
      int wnd=0;
      //--- If the cursor coordinates are converted to date and time
      if(ChartXYToTimePrice(ChartID(),(int)lparam,(int)dparam,wnd,time,price))
        {
         //--- write the bar index where the cursor is located to a global variable
         mouse_bar_index=iBarShift(Symbol(),PERIOD_CURRENT,time);
         //--- Display the bar data under the cursor on the panel
         DrawData(mouse_bar_index,time);
        }
     }

//--- If we received a custom event, display the appropriate message in the journal
   if(id>CHARTEVENT_CUSTOM)
     {
      //--- Here we can implement handling a click on the close button on the panel
      PrintFormat("%s: Event id=%ld, object id (lparam): %lu, event message (sparam): %s",__FUNCTION__,id,lparam,sparam);
     }
  }
Tras compilar y ejecutar el asesor en el gráfico, podremos controlar el valor y el estado de la línea de indicador en el panel informativo:
Podrá ver el archivo del asesor de pruebas "TestVolumeVolumes.mq5" en los archivos adjuntos.
Indicadores de Bill Williams
Los indicadores de Bill Williams se incluyen en un grupo propio, pues forman parte integrante del sistema comercial descrito en sus libros.
Accelerator Oscillator
El precio es el último elemento que cambiará. Antes de que cambie el precio, cambiará la fuerza impulsora del mercado, y antes de que la fuerza impulsora cambie de dirección, la aceleración de la fuerza impulsora deberá ralentizarse y llegar a cero. A continuación, empezará a acelerar en sentido contrario hasta que el precio comience a cambiar de dirección.
El indicador técnico de Aceleración/Deceleración (Acceleration/Deceleration, Accelerator/Decelerator Oscillator, AC) mide la aceleración y desaceleración de la fuerza impulsora actual. Este indicador cambiará de dirección antes de que cambie la fuerza impulsora, que a su vez cambiará de dirección antes de que cambie el precio. Comprender que el AC es una señal de alerta temprana tiene ventajas evidentes.
La línea cero es esencialmente donde la fuerza impulsora se equilibrará con la aceleración. Si el Oscilador AC está por encima de cero, suele resultar más fácil para acelerar continuar hacia arriba (y viceversa, cuando se encuentra por debajo de cero). A diferencia del Awesome Oscillator, el cruce de la línea cero no constituye una señal. Lo único que deberemos hacer para controlar el mercado y tomar decisiones es estar atento a los cambios de color. Para evitar consideraciones serias, deberemos recordar: con la ayuda de AC resultará indeseable comprar cuando la columna actual está coloreada en rojo, e indeseable vender cuando la columna actual está coloreada en verde.
Si se entra en el mercado en la dirección de la fuerza impulsora (el indicador Aceleración/Desaceleración se encuentra por encima de cero al comprar, o se encuentra por debajo de cero al vender), solo se necesitarán dos barras verdes para comprar (dos barras rojas para vender). Si la fuerza impulsora está en contra de la posición que se va a abrir (el indicador está por debajo de cero al comprar, o por encima de cero al vender), será necesaria una confirmación, por lo que se requerirá una columna adicional. En este caso, el indicador debería mostrar tres barras rojas por encima de la línea cero, para una posición corta, y tres barras verdes por debajo de la línea cero, para una posición larga.
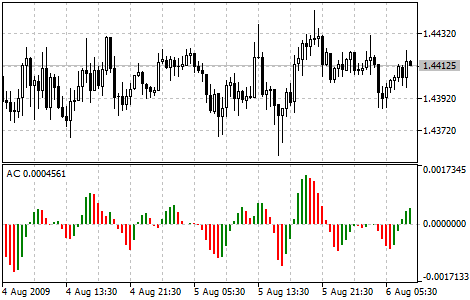
Parámetros
La función iAC() se utiliza para crear el tirador del indicador:
Crea un indicador Accelerator Oscillator y retorna su manejador. Solo un búfer.
int  iAC(
   string           symbol,     // symbol name
   ENUM_TIMEFRAMES  period      // period
   );
symbol
[in] Nombre simbólico del instrumento sobre cuyos datos se calculará el indicador. NULL indicará el símbolo actual.
period
[in] El valor del periodo puede ser uno de los valores de la enumeración ENUM_TIMEFRAMES, 0 indicará el marco temporal actual.
Retorna el manejador del indicador técnico especificado, en caso de fallo retornará INVALID_HANDLE. Para liberar la memoria del ordenador de un indicador que ya no se utiliza, se utilizará la función IndicatorRelease(), a la que se le transmitirá el manejador de este indicador.
Para crear un indicador en el asesor, declararemos las variables globales (el indicador no tiene parámetros de entrada, excepto para establecer los colores de las barras ascendentes y descendentes del histograma):
//+------------------------------------------------------------------+
//|                                               TestWilliamsAC.mq5 |
//|                                  Copyright 2023, MetaQuotes Ltd. |
//|                                             https://www.mql5.com |
//+------------------------------------------------------------------+
#property copyright "Copyright 2023, MetaQuotes Ltd."
#property link      "https://www.mql5.com"
#property version   "1.00"
//--- enums
enum ENUM_LINE_STATE
  {
   LINE_STATE_NONE,        // Undefined state
   LINE_STATE_UP,          // Upward
   LINE_STATE_DOWN,        // Downward
   LINE_STATE_TURN_UP,     // Upward reversal
   LINE_STATE_TURN_DOWN,   // Downward reversal
   LINE_STATE_STOP_UP,     // Upward stop
   LINE_STATE_STOP_DOWN,   // Downward stop
   LINE_STATE_ABOVE,       // Above value
   LINE_STATE_UNDER,       // Below value
   LINE_STATE_CROSS_UP,    // Crossing value upwards
   LINE_STATE_CROSS_DOWN,  // Crossing value downwards
   LINE_STATE_TOUCH_BELOW, // Touching value from below
   LINE_STATE_TOUCH_ABOVE, // Touch value from above
   LINE_STATE_EQUALS,      // Equal to value
  };
//--- global variables
int      handle=INVALID_HANDLE;  // Indicator handle
int      ind_digits=0;           // Number of decimal places in the indicator values
string   ind_title;              // Indicator description
Al utilizar el panel informativo en el asesor, también declararemos las variables globales para él y conectaremos el archivo de clases del panel:
//+------------------------------------------------------------------+
//|                                               TestWilliamsAC.mq5 |
//|                                  Copyright 2023, MetaQuotes Ltd. |
//|                                             https://www.mql5.com |
//+------------------------------------------------------------------+
#property copyright "Copyright 2023, MetaQuotes Ltd."
#property link      "https://www.mql5.com"
#property version   "1.00"
//--- includes
#include <Dashboard\Dashboard.mqh>
//--- enums
enum ENUM_LINE_STATE
  {
   LINE_STATE_NONE,        // Undefined state
   LINE_STATE_UP,          // Upward
   LINE_STATE_DOWN,        // Downward
   LINE_STATE_TURN_UP,     // Upward reversal
   LINE_STATE_TURN_DOWN,   // Downward reversal
   LINE_STATE_STOP_UP,     // Upward stop
   LINE_STATE_STOP_DOWN,   // Downward stop
   LINE_STATE_ABOVE,       // Above value
   LINE_STATE_UNDER,       // Below value
   LINE_STATE_CROSS_UP,    // Crossing value upwards
   LINE_STATE_CROSS_DOWN,  // Crossing value downwards
   LINE_STATE_TOUCH_BELOW, // Touching value from below
   LINE_STATE_TOUCH_ABOVE, // Touch value from above
   LINE_STATE_EQUALS,      // Equal to value
  };
//--- global variables
int      handle=INVALID_HANDLE;  // Indicator handle
int      ind_digits=0;           // Number of decimal places in the indicator values
string   ind_title;              // Indicator description
//--- variables for the panel
int      mouse_bar_index;        // Index of the bar the data is taken from
CDashboard *panel=NULL;          // Pointer to the panel object
Inicialización
Establecimiento de los valores de las variables globales para el indicador y creación de su manejador:
//+------------------------------------------------------------------+
//| Expert initialization function                                   |
//+------------------------------------------------------------------+
int OnInit()
  {
//--- create timer
   EventSetTimer(60);

//--- Indicator
//--- Set the indicator name and the number of decimal places
   ind_title="AC";
   ind_digits=Digits()+2;
//--- Create indicator handle
   ResetLastError();
   handle=iAC(Symbol(),PERIOD_CURRENT);
   if(handle==INVALID_HANDLE)
     {
      PrintFormat("%s: Failed to create indicator handle %s. Error %ld",__FUNCTION__,ind_title,GetLastError());
      return INIT_FAILED;
     }

//--- Successful initialization
   return(INIT_SUCCEEDED);
  }
Al utilizar un panel informativo en el asesor, crearemos un panel:
//+------------------------------------------------------------------+
//| Expert initialization function                                   |
//+------------------------------------------------------------------+
int OnInit()
  {
//--- create timer
   EventSetTimer(60);

//--- Indicator
//--- Set the indicator name and the number of decimal places
   ind_title="AC";
   ind_digits=Digits()+2;
//--- Create indicator handle
   ResetLastError();
   handle=iAC(Symbol(),PERIOD_CURRENT);
   if(handle==INVALID_HANDLE)
     {
      PrintFormat("%s: Failed to create indicator handle %s. Error %ld",__FUNCTION__,ind_title,GetLastError());
      return INIT_FAILED;
     }

//--- Dashboard
//--- Create the panel
   panel=new CDashboard(1,20,20,199,225);
   if(panel==NULL)
     {
      Print("Error. Failed to create panel object");
      return INIT_FAILED;
     }
//--- Set font parameters
   panel.SetFontParams("Calibri",9);
//--- Display the panel with the "Symbol, Timeframe description" header text
   panel.View(Symbol()+", "+StringSubstr(EnumToString(Period()),7));
//--- Create a table with ID 0 to display bar data in it
   panel.CreateNewTable(0);
//--- Draw a table with ID 0 on the panel background
   panel.DrawGrid(0,2,20,6,2,18,97);

//--- Create a table with ID 1 to display indicator data in it
   panel.CreateNewTable(1);
//--- Get the Y2 table coordinate with ID 0 and
//--- set the Y1 coordinate for the table with ID 1
   int y1=panel.TableY2(0)+22;
//--- Draw a table with ID 1 on the panel background
   panel.DrawGrid(1,2,y1,3,2,18,97);

//--- Display tabular data in the journal
   panel.GridPrint(0,2);
   panel.GridPrint(1,2);
//--- Initialize the variable with the index of the mouse cursor bar
   mouse_bar_index=0;
//--- Display the data of the current bar on the panel
   DrawData(mouse_bar_index,TimeCurrent());

//--- Successful initialization
   return(INIT_SUCCEEDED);
  }
Desinicialización
En el manejador OnDeinit() del asesor liberaremos el manejador del indicador:
//+------------------------------------------------------------------+
//| Expert deinitialization function                                 |
//+------------------------------------------------------------------+
void OnDeinit(const int reason)
  {
//--- destroy timer
   EventKillTimer();

//--- Release handle of the indicator
   ResetLastError();
   if(!IndicatorRelease(handle))
      PrintFormat("%s: IndicatorRelease failed. Error %ld",__FUNCTION__,GetLastError());
//--- Clear all comments on the chart
   Comment("");
  }
Al utilizar un panel informativo, eliminaremos el objeto de panel creado:
//+------------------------------------------------------------------+
//| Expert deinitialization function                                 |
//+------------------------------------------------------------------+
void OnDeinit(const int reason)
  {
//--- destroy timer
   EventKillTimer();

//--- Release handle of the indicator
   ResetLastError();
   if(!IndicatorRelease(handle))
      PrintFormat("%s: IndicatorRelease failed. Error %ld",__FUNCTION__,GetLastError());
//--- Clear all comments on the chart
   Comment("");

//--- If the panel object exists, delete it
   if(panel!=NULL)
      delete panel;
  }
Obtención de datos
A continuación se presentarán las funciones generales de la obtención de datos usando el manejador del indicador. Ya analizamos dichas funciones en el artículo sobre la conexión de osciladores en asesores. Podrá utilizar las funciones presentadas "tal cual" en sus programas:
//+------------------------------------------------------------------+
//| Return the indicator data on the specified bar                   |
//+------------------------------------------------------------------+
double IndicatorValue(const int ind_handle,const int index,const int buffer_num)
  {
   double array[1]={0};
   ResetLastError();
   if(CopyBuffer(ind_handle,buffer_num,index,1,array)!=1)
     {
      PrintFormat("%s: CopyBuffer failed. Error %ld",__FUNCTION__,GetLastError());
      return EMPTY_VALUE;
     }
   return array[0];
  }
//+------------------------------------------------------------------+
//| Return the state of the indicator line                           |
//+------------------------------------------------------------------+
ENUM_LINE_STATE LineState(const int ind_handle,const int index,const int buffer_num)
  {
//--- Get the values of the indicator line with the shift (0,1,2) relative to the passed index
   const double value0=IndicatorValue(ind_handle,index,  buffer_num);
   const double value1=IndicatorValue(ind_handle,index+1,buffer_num);
   const double value2=IndicatorValue(ind_handle,index+2,buffer_num);
//--- If at least one of the values could not be obtained, return an undefined value
   if(value0==EMPTY_VALUE || value1==EMPTY_VALUE || value2==EMPTY_VALUE)
      return LINE_STATE_NONE;
//--- Line upward reversal (value2>value1 && value0>value1)
   if(NormalizeDouble(value2-value1,ind_digits)>0 && NormalizeDouble(value0-value1,ind_digits)>0)
      return LINE_STATE_TURN_UP;
//--- Line upward direction (value2<=value1 && value0>value1)
   else if(NormalizeDouble(value2-value1,ind_digits)<=0 && NormalizeDouble(value0-value1,ind_digits)>0)
      return LINE_STATE_UP;
//--- Line upward stop (value2<=value1 && value0==value1)
   else if(NormalizeDouble(value2-value1,ind_digits)<=0 && NormalizeDouble(value0-value1,ind_digits)==0)
      return LINE_STATE_STOP_UP;
//--- Line downward reversal (value2<value1 && value0<value1)
   if(NormalizeDouble(value2-value1,ind_digits)<0 && NormalizeDouble(value0-value1,ind_digits)<0)
      return LINE_STATE_TURN_DOWN;
//--- Line downward direction (value2>=value1 && value0<value1)
   else if(NormalizeDouble(value2-value1,ind_digits)>=0 && NormalizeDouble(value0-value1,ind_digits)<0)
      return LINE_STATE_DOWN;
//--- Line downward stop (value2>=value1 && value0==value1)
   else if(NormalizeDouble(value2-value1,ind_digits)>=0 && NormalizeDouble(value0-value1,ind_digits)==0)
      return LINE_STATE_STOP_DOWN;
//--- Undefined state
   return LINE_STATE_NONE;
  }
//+------------------------------------------------------------------+
//| Return the state of the line relative to the specified level     |
//+------------------------------------------------------------------+
ENUM_LINE_STATE LineStateRelative(const int ind_handle,const int index,const int buffer_num,const double level0,const double level1=EMPTY_VALUE)
  {
//--- Get the values of the indicator line with the shift (0,1) relative to the passed index
   const double value0=IndicatorValue(ind_handle,index,  buffer_num);
   const double value1=IndicatorValue(ind_handle,index+1,buffer_num);
//--- If at least one of the values could not be obtained, return an undefined value
   if(value0==EMPTY_VALUE || value1==EMPTY_VALUE)
      return LINE_STATE_NONE;
//--- Define the second level to compare
   double level=(level1==EMPTY_VALUE ? level0 : level1);
//--- The line is below the level (value1<level && value0<level0)
   if(NormalizeDouble(value1-level,ind_digits)<0 && NormalizeDouble(value0-level0,ind_digits)<0)
      return LINE_STATE_UNDER;
//--- The line is above the level (value1>level && value0>level0)
   if(NormalizeDouble(value1-level,ind_digits)>0 && NormalizeDouble(value0-level0,ind_digits)>0)
      return LINE_STATE_ABOVE;
//--- The line crossed the level upwards (value1<=level && value0>level0)
   if(NormalizeDouble(value1-level,ind_digits)<=0 && NormalizeDouble(value0-level0,ind_digits)>0)
      return LINE_STATE_CROSS_UP;
//--- The line crossed the level downwards (value1>=level && value0<level0)
   if(NormalizeDouble(value1-level,ind_digits)>=0 && NormalizeDouble(value0-level0,ind_digits)<0)
      return LINE_STATE_CROSS_DOWN;
//--- The line touched the level from below (value1<level0 && value0==level0)
   if(NormalizeDouble(value1-level,ind_digits)<0 && NormalizeDouble(value0-level0,ind_digits)==0)
      return LINE_STATE_TOUCH_BELOW;
//--- The line touched the level from above (value1>level0 && value0==level0)
   if(NormalizeDouble(value1-level,ind_digits)>0 && NormalizeDouble(value0-level0,ind_digits)==0)
      return LINE_STATE_TOUCH_BELOW;
//--- Line is equal to the level value (value1==level0 && value0==level0)
   if(NormalizeDouble(value1-level,ind_digits)==0 && NormalizeDouble(value0-level0,ind_digits)==0)
      return LINE_STATE_EQUALS;
//--- Undefined state
   return LINE_STATE_NONE;
  }
//+------------------------------------------------------------------+
//| Return the indicator line state description                      |
//+------------------------------------------------------------------+
string LineStateDescription(const ENUM_LINE_STATE state)
  {
   switch(state)
     {
      case LINE_STATE_UP         :  return "Up";
      case LINE_STATE_STOP_UP    :  return "Stop Up";
      case LINE_STATE_TURN_UP    :  return "Turn Up";
      case LINE_STATE_DOWN       :  return "Down";
      case LINE_STATE_STOP_DOWN  :  return "Stop Down";
      case LINE_STATE_TURN_DOWN  :  return "Turn Down";
      case LINE_STATE_ABOVE      :  return "Above level";
      case LINE_STATE_UNDER      :  return "Under level";
      case LINE_STATE_CROSS_UP   :  return "Crossing Up";
      case LINE_STATE_CROSS_DOWN :  return "Crossing Down";
      case LINE_STATE_TOUCH_BELOW:  return "Touch from Below";
      case LINE_STATE_TOUCH_ABOVE:  return "Touch from Above";
      case LINE_STATE_EQUALS     :  return "Equals";
      default                    :  return "Unknown";
     }
  }
Al utilizar el panel informativo, los datos se mostrarán en el panel utilizando la función:
//+------------------------------------------------------------------+
//| Display data from the specified timeseries index to the panel    |
//+------------------------------------------------------------------+
void DrawData(const int index,const datetime time)
  {
//--- Declare the variables to receive data in them
   MqlTick  tick={0};
   MqlRates rates[1];

//--- Exit if unable to get the current prices
   if(!SymbolInfoTick(Symbol(),tick))
      return;
//--- Exit if unable to get the bar data by the specified index
   if(CopyRates(Symbol(),PERIOD_CURRENT,index,1,rates)!=1)
      return;

//--- Set font parameters for bar and indicator data headers
   int  size=0;
   uint flags=0;
   uint angle=0;
   string name=panel.FontParams(size,flags,angle);
   panel.SetFontParams(name,9,FW_BOLD);
   panel.DrawText("Bar data ["+(string)index+"]",3,panel.TableY1(0)-16,clrMaroon,panel.Width()-6);
   panel.DrawText("Indicator data ["+(string)index+"]",3,panel.TableY1(1)-16,clrGreen,panel.Width()-6);
//--- Set font parameters for bar and indicator data
   panel.SetFontParams(name,9);

//--- Display the data of the specified bar in table 0 on the panel
   panel.DrawText("Date",  panel.CellX(0,0,0)+2, panel.CellY(0,0,0)+2); panel.DrawText(TimeToString(  rates[0].time,TIME_DATE),     panel.CellX(0,0,1)+2, panel.CellY(0,0,1)+2,clrNONE,90);
   panel.DrawText("Time",  panel.CellX(0,1,0)+2, panel.CellY(0,1,0)+2); panel.DrawText(TimeToString(  rates[0].time,TIME_MINUTES),  panel.CellX(0,1,1)+2, panel.CellY(0,1,1)+2,clrNONE,90);
   panel.DrawText("Open",  panel.CellX(0,2,0)+2, panel.CellY(0,2,0)+2); panel.DrawText(DoubleToString(rates[0].open,Digits()),      panel.CellX(0,2,1)+2, panel.CellY(0,2,1)+2,clrNONE,90);
   panel.DrawText("High",  panel.CellX(0,3,0)+2, panel.CellY(0,3,0)+2); panel.DrawText(DoubleToString(rates[0].high,Digits()),      panel.CellX(0,3,1)+2, panel.CellY(0,3,1)+2,clrNONE,90);
   panel.DrawText("Low",   panel.CellX(0,4,0)+2, panel.CellY(0,4,0)+2); panel.DrawText(DoubleToString(rates[0].low,Digits()),       panel.CellX(0,4,1)+2, panel.CellY(0,4,1)+2,clrNONE,90);
   panel.DrawText("Close", panel.CellX(0,5,0)+2, panel.CellY(0,5,0)+2); panel.DrawText(DoubleToString(rates[0].close,Digits()),     panel.CellX(0,5,1)+2, panel.CellY(0,5,1)+2,clrNONE,90);

//--- Display the indicator data from the specified bar on the panel in table 1
   panel.DrawText(ind_title, panel.CellX(1,0,0)+2, panel.CellY(1,0,0)+2);
   double value0=IndicatorValue(handle,index,  0);
   double value1=IndicatorValue(handle,index+1,0);
   string value_str=(value0!=EMPTY_VALUE ? DoubleToString(value0,ind_digits) : "");
   color clr=(value0>value1 ? clrGreen : value0<value1 ? clrRed : clrNONE);
   panel.DrawText(value_str,panel.CellX(1,0,1)+2,panel.CellY(1,0,1)+2,clrNONE,90);

//--- Display a description of the indicator line state
   panel.DrawText("Line state", panel.CellX(1,1,0)+2, panel.CellY(1,1,0)+2);
   ENUM_LINE_STATE state=LineState(handle,index,0);
   panel.DrawText(LineStateDescription(state),panel.CellX(1,1,1)+2,panel.CellY(1,1,1)+2,clr,90);

//--- Redraw the chart to immediately display all changes on the panel
   ChartRedraw(ChartID());
  }
El color de los textos de estado de las líneas indicadoras del panel se corresponderá con el color de las barras del histograma sobre las que se encuentra el cursor.
Además, al utilizar un panel informativo, el manejador de eventos OnChartEvent() del asesor llamará al manejador de eventos del panel informativo y procesará los eventos para obtener el índice de la barra bajo el cursor:
//+------------------------------------------------------------------+
//| ChartEvent function                                              |
//+------------------------------------------------------------------+
void OnChartEvent(const int id,
                  const long &lparam,
                  const double &dparam,
                  const string &sparam)
  {
//--- Handling the panel
//--- Call the panel event handler
   panel.OnChartEvent(id,lparam,dparam,sparam);

//--- If the cursor moves or a click is made on the chart
   if(id==CHARTEVENT_MOUSE_MOVE || id==CHARTEVENT_CLICK)
     {
      //--- Declare the variables to record time and price coordinates in them
      datetime time=0;
      double price=0;
      int wnd=0;
      //--- If the cursor coordinates are converted to date and time
      if(ChartXYToTimePrice(ChartID(),(int)lparam,(int)dparam,wnd,time,price))
        {
         //--- write the bar index where the cursor is located to a global variable
         mouse_bar_index=iBarShift(Symbol(),PERIOD_CURRENT,time);
         //--- Display the bar data under the cursor on the panel
         DrawData(mouse_bar_index,time);
        }
     }

//--- If we received a custom event, display the appropriate message in the journal
   if(id>CHARTEVENT_CUSTOM)
     {
      //--- Here we can implement handling a click on the close button on the panel
      PrintFormat("%s: Event id=%ld, object id (lparam): %lu, event message (sparam): %s",__FUNCTION__,id,lparam,sparam);
     }
  }
Tras compilar y ejecutar el asesor en el gráfico, podremos controlar el valor y el estado de la línea de indicador en el panel informativo:
Podrá ver el archivo del asesor de pruebas "TestWilliamsAC.mq5" en los archivos adjuntos.
Alligator
La mayor parte del tiempo el mercado no se dirige a ninguna parte. Solo entre el 15 y el 30% de las veces el mercado forma algún tipo de tendencia y los tráders que no están en la sala bursátil obtienen casi todos sus beneficios de los movimientos de tendencia. Mi abuelo solía decir: "Hasta una gallina ciega encontrará el grano si se la alimenta siempre a la misma hora". Llamamos al comercio de tendencia el "mercado de la gallina ciega". Aunque nos ha llevado años, hemos desarrollado un indicador que siempre nos permite "mantener la pólvora seca" hasta que nos encontramos en un "mercado de gallinas ciegas".
Bill Williams
El indicador técnico Alligator es una combinación de las líneas de Balance (Medias Móviles, Moving Averages), que usan geometría fractal y dinámicas no lineales.
- La línea azul (Alligator Jaw) es la Línea de Balance para el periodo de tiempo utilizado para trazar el gráfico (media móvil suavizada de 13 periodos desplazada 8 barras hacia el futuro);
- La línea roja (Alligator Teeth) es la Línea de Balance para un periodo de tiempo significativo un orden de magnitud inferior (una media móvil suavizada de 8 periodos desplazada 5 barras hacia el futuro);
- La línea verde (Alligator Lips) es la Línea de Balance para un periodo de tiempo significativo un orden de magnitud inferior (media móvil suavizada desplazada 3 barras hacia el futuro).
Los labios, los dientes y la mandíbula de caimán muestran la interacción de los distintos periodos de tiempo. Dado que las tendencias del mercado solo pueden identificarse entre un 15% y un 30% de las veces, deberemos seguir las tendencias y no comerciar en mercados que solo cambien en determinados periodos de precio.
Cuando la Mandíbula, los Dientes y los Labios están cerrados o entrelazados, el Alligator está a punto de dormir o ya está dormido. Cuando duerme, su hambre aumenta: cuanto más tiempo duerma, más hambre tendrá al despertar. Cuando se despierte, lo primero que hará es abrir la boca y empezar a bostezar. Entonces empezará a oler la comida: la carne de un toro (movimiento alcista) o la carne de un oso (movimiento bajista), y empezará a cazarla. Cuando el caimán está satisfecho, empieza a perder interés por la comida-precio (las líneas de balance convergen): entonces será el momento de obtener beneficios.
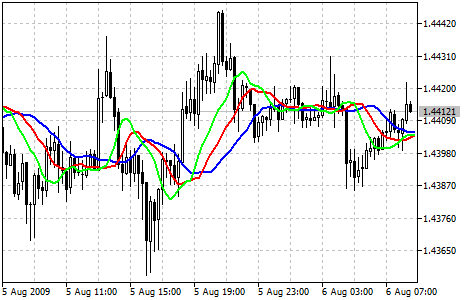
Parámetros
La función iAlligator() se utiliza para crear el manejador del indicador:
Retorna el manejador del indicador Alligator.
int  iAlligator(
   string              symbol,            // symbol name
   ENUM_TIMEFRAMES     period,            // period
   int                 jaw_period,        // period for calculating jaws
   int                 jaw_shift,         // horizontal shift of jaws
   int                 teeth_period,      // period for calculating teeth
   int                 teeth_shift,       // horizontal shift of teeth
   int                 lips_period,       // period for calculating lips
   int                 lips_shift,        // horizontal shift of lips
   ENUM_MA_METHOD      ma_method,         // smoothing type
   ENUM_APPLIED_PRICE  applied_price      // price type or handle
   );
symbol
[in] Nombre simbólico del instrumento sobre cuyos datos se calculará el indicador. NULL indicará el símbolo actual.
period
[in] El valor del periodo puede ser uno de los valores de la enumeración ENUM_TIMEFRAMES, 0 indicará el marco temporal actual.
jaw_period
[in] Periodo medio de la línea azul (mandíbulas del caimán).
jaw_shift
[in] Desplazamiento de la línea azul con respecto al gráfico de precios.
teeth_period
[in] Periodo medio de la línea roja (dientes del caimán).
teeth_shift
[in] Desplazamiento de la línea roja con respecto al gráfico de precios.
lips_period
[in] Periodo medio de la línea verde (labios del caimán).
lips_shift
[in] Desplazamiento de la línea verde respecto al gráfico de precios.
ma_method
[in] Método de promediado. Puede ser cualquiera de los valores de la enumeración ENUM_MA_METHOD.
applied_price
[in] Precio usado. Puede ser cualquiera de las constantes de precio ENUM_APPLIED_PRICE o un manejador de otro indicador.
Retorna el manejador del indicador técnico especificado, en caso de fallo retornará INVALID_HANDLE. Para liberar la memoria del ordenador de un indicador que ya no se utiliza, se utilizará la función IndicatorRelease(), a la que se le transmitirá el manejador de este indicador.
Números de los búferes: 0 — GATORJAW_LINE, 1 — GATORTEETH_LINE, 2 — GATORLIPS_LINE.
Para crear un indicador en el asesor, declararemos las variables de entrada y las variables globales:
//+------------------------------------------------------------------+
//|                                        TestWilliamsAlligator.mq5 |
//|                                  Copyright 2023, MetaQuotes Ltd. |
//|                                             https://www.mql5.com |
//+------------------------------------------------------------------+
#property copyright "Copyright 2023, MetaQuotes Ltd."
#property link      "https://www.mql5.com"
#property version   "1.00"
//--- enums
enum ENUM_LINE_STATE
  {
   LINE_STATE_NONE,        // Undefined state
   LINE_STATE_UP,          // Upward
   LINE_STATE_DOWN,        // Downward
   LINE_STATE_TURN_UP,     // Upward reversal
   LINE_STATE_TURN_DOWN,   // Downward reversal
   LINE_STATE_STOP_UP,     // Upward stop
   LINE_STATE_STOP_DOWN,   // Downward stop
   LINE_STATE_ABOVE,       // Above value
   LINE_STATE_UNDER,       // Below value
   LINE_STATE_CROSS_UP,    // Crossing value upwards
   LINE_STATE_CROSS_DOWN,  // Crossing value downwards
   LINE_STATE_TOUCH_BELOW, // Touching value from below
   LINE_STATE_TOUCH_ABOVE, // Touch value from above
   LINE_STATE_EQUALS,      // Equal to value
  };
//--- input parameters
input uint                 InpPeriodJaws  =  13;            /* Jaws Period    */
input int                  InpShiftJaws   =  8;             /* Jaws Shift     */
input uint                 InpPeriodTeeth =  8;             /* Teeth Period   */
input int                  InpShiftTeeth  =  5;             /* Teeth Shift    */
input uint                 InpPeriodLips  =  5;             /* Lips Period    */
input int                  InpShiftLips   =  3;             /* Lips Shift     */
input ENUM_MA_METHOD       InpMethod      =  MODE_SMMA;     /* Smoothed       */
input ENUM_APPLIED_PRICE   InpAppliedPrice=  PRICE_MEDIAN;  /* Applied Price  */
//--- global variables
int      handle=INVALID_HANDLE;  // Indicator handle
int      period_jaws=0;          // Jaws line calculation period
int      period_teeth=0;         // Teeth line calculation period
int      period_lips=0;          // Lips line calculation period
int      ind_digits=0;           // Number of decimal places in the indicator values
string   ind_title;              // Indicator description
Al utilizar el panel informativo en el asesor, también declararemos las variables globales para él y conectaremos el archivo de clases del panel:
//+------------------------------------------------------------------+
//|                                        TestWilliamsAlligator.mq5 |
//|                                  Copyright 2023, MetaQuotes Ltd. |
//|                                             https://www.mql5.com |
//+------------------------------------------------------------------+
#property copyright "Copyright 2023, MetaQuotes Ltd."
#property link      "https://www.mql5.com"
#property version   "1.00"
//--- includes
#include <Dashboard\Dashboard.mqh>
//--- enums
enum ENUM_LINE_STATE
  {
   LINE_STATE_NONE,        // Undefined state
   LINE_STATE_UP,          // Upward
   LINE_STATE_DOWN,        // Downward
   LINE_STATE_TURN_UP,     // Upward reversal
   LINE_STATE_TURN_DOWN,   // Downward reversal
   LINE_STATE_STOP_UP,     // Upward stop
   LINE_STATE_STOP_DOWN,   // Downward stop
   LINE_STATE_ABOVE,       // Above value
   LINE_STATE_UNDER,       // Below value
   LINE_STATE_CROSS_UP,    // Crossing value upwards
   LINE_STATE_CROSS_DOWN,  // Crossing value downwards
   LINE_STATE_TOUCH_BELOW, // Touching value from below
   LINE_STATE_TOUCH_ABOVE, // Touch value from above
   LINE_STATE_EQUALS,      // Equal to value
  };
//--- input parameters
input uint                 InpPeriodJaws  =  13;            /* Jaws Period    */
input int                  InpShiftJaws   =  8;             /* Jaws Shift     */
input uint                 InpPeriodTeeth =  8;             /* Teeth Period   */
input int                  InpShiftTeeth  =  5;             /* Teeth Shift    */
input uint                 InpPeriodLips  =  5;             /* Lips Period    */
input int                  InpShiftLips   =  3;             /* Lips Shift     */
input ENUM_MA_METHOD       InpMethod      =  MODE_SMMA;     /* Smoothed       */
input ENUM_APPLIED_PRICE   InpAppliedPrice=  PRICE_MEDIAN;  /* Applied Price  */
//--- global variables
int      handle=INVALID_HANDLE;  // Indicator handle
int      period_jaws=0;          // Jaws line calculation period
int      period_teeth=0;         // Teeth line calculation period
int      period_lips=0;          // Lips line calculation period
int      ind_digits=0;           // Number of decimal places in the indicator values
string   ind_title;              // Indicator description
//--- variables for the panel
int      mouse_bar_index;        // Index of the bar the data is taken from
CDashboard *panel=NULL;          // Pointer to the panel object
Inicialización
Establecimiento de los valores de las variables globales para el indicador y creación de su manejador:
//+------------------------------------------------------------------+
//| Expert initialization function                                   |
//+------------------------------------------------------------------+
int OnInit()
  {
//--- create timer
   EventSetTimer(60);

//--- Indicator
//--- Set and adjust the calculation period if necessary
   period_jaws=int(InpPeriodJaws<1 ? 13 : InpPeriodJaws);
   period_teeth=int(InpPeriodTeeth<1 ? 8 : InpPeriodTeeth);
   period_lips=int(InpPeriodLips<1 ? 5 : InpPeriodLips);
//--- Set the indicator name and the number of decimal places
   ind_title=StringFormat("Alligator(%lu,%lu,%lu)",period_jaws,period_teeth,period_lips);
   ind_digits=Digits();
//--- Create indicator handle
   ResetLastError();
   handle=iAlligator(Symbol(),PERIOD_CURRENT,period_jaws,InpShiftJaws,period_teeth,InpShiftTeeth,period_lips,InpShiftLips,InpMethod,InpAppliedPrice);
   if(handle==INVALID_HANDLE)
     {
      PrintFormat("%s: Failed to create indicator handle %s. Error %ld",__FUNCTION__,ind_title,GetLastError());
      return INIT_FAILED;
     }

//--- Successful initialization
   return(INIT_SUCCEEDED);
  }
Al utilizar un panel informativo en el asesor, crearemos un panel:
//+------------------------------------------------------------------+
//| Expert initialization function                                   |
//+------------------------------------------------------------------+
int OnInit()
  {
//--- create timer
   EventSetTimer(60);

//--- Indicator
//--- Set and adjust the calculation period if necessary
   period_jaws=int(InpPeriodJaws<1 ? 13 : InpPeriodJaws);
   period_teeth=int(InpPeriodTeeth<1 ? 8 : InpPeriodTeeth);
   period_lips=int(InpPeriodLips<1 ? 5 : InpPeriodLips);
//--- Set the indicator name and the number of decimal places
   ind_title=StringFormat("Alligator(%lu,%lu,%lu)",period_jaws,period_teeth,period_lips);
   ind_digits=Digits();
//--- Create indicator handle
   ResetLastError();
   handle=iAlligator(Symbol(),PERIOD_CURRENT,period_jaws,InpShiftJaws,period_teeth,InpShiftTeeth,period_lips,InpShiftLips,InpMethod,InpAppliedPrice);
   if(handle==INVALID_HANDLE)
     {
      PrintFormat("%s: Failed to create indicator handle %s. Error %ld",__FUNCTION__,ind_title,GetLastError());
      return INIT_FAILED;
     }

//--- Dashboard
//--- Create the panel
   panel=new CDashboard(1,20,20,199,261);
   if(panel==NULL)
     {
      Print("Error. Failed to create panel object");
      return INIT_FAILED;
     }
//--- Set font parameters
   panel.SetFontParams("Calibri",9);
//--- Display the panel with the "Symbol, Timeframe description" header text
   panel.View(Symbol()+", "+StringSubstr(EnumToString(Period()),7));
//--- Create a table with ID 0 to display bar data in it
   panel.CreateNewTable(0);
//--- Draw a table with ID 0 on the panel background
   panel.DrawGrid(0,2,20,6,2,18,97);

//--- Create a table with ID 1 to display indicator data in it
   panel.CreateNewTable(1);
//--- Get the Y2 table coordinate with ID 0 and
//--- set the Y1 coordinate for the table with ID 1
   int y1=panel.TableY2(0)+22;
//--- Draw a table with ID 1 on the panel background
   panel.DrawGrid(1,2,y1,5,2,18,97);

//--- Display tabular data in the journal
   panel.GridPrint(0,2);
   panel.GridPrint(1,2);
//--- Initialize the variable with the index of the mouse cursor bar
   mouse_bar_index=0;
//--- Display the data of the current bar on the panel
   DrawData(mouse_bar_index,TimeCurrent());

//--- Successful initialization
   return(INIT_SUCCEEDED);
  }
Desinicialización
En el manejador OnDeinit() del asesor liberaremos el manejador del indicador:
//+------------------------------------------------------------------+
//| Expert deinitialization function                                 |
//+------------------------------------------------------------------+
void OnDeinit(const int reason)
  {
//--- destroy timer
   EventKillTimer();

//--- Release handle of the indicator
   ResetLastError();
   if(!IndicatorRelease(handle))
      PrintFormat("%s: IndicatorRelease failed. Error %ld",__FUNCTION__,GetLastError());
//--- Clear all comments on the chart
   Comment("");
  }
Al utilizar un panel informativo, eliminaremos el objeto de panel creado:
//+------------------------------------------------------------------+
//| Expert deinitialization function                                 |
//+------------------------------------------------------------------+
void OnDeinit(const int reason)
  {
//--- destroy timer
   EventKillTimer();

//--- Release handle of the indicator
   ResetLastError();
   if(!IndicatorRelease(handle))
      PrintFormat("%s: IndicatorRelease failed. Error %ld",__FUNCTION__,GetLastError());
//--- Clear all comments on the chart
   Comment("");

//--- If the panel object exists, delete it
   if(panel!=NULL)
      delete panel;
  }
Obtención de datos
A continuación se presentarán las funciones generales de la obtención de datos usando el manejador del indicador. Ya analizamos dichas funciones en el artículo sobre la conexión de osciladores en asesores. Podrá utilizar las funciones presentadas "tal cual" en sus programas:
//+------------------------------------------------------------------+
//| Return the indicator data on the specified bar                   |
//+------------------------------------------------------------------+
double IndicatorValue(const int ind_handle,const int index,const int buffer_num)
  {
   double array[1]={0};
   ResetLastError();
   if(CopyBuffer(ind_handle,buffer_num,index,1,array)!=1)
     {
      PrintFormat("%s: CopyBuffer failed. Error %ld",__FUNCTION__,GetLastError());
      return EMPTY_VALUE;
     }
   return array[0];
  }
//+------------------------------------------------------------------+
//| Return the state of the indicator line                           |
//+------------------------------------------------------------------+
ENUM_LINE_STATE LineState(const int ind_handle,const int index,const int buffer_num)
  {
//--- Get the values of the indicator line with the shift (0,1,2) relative to the passed index
   const double value0=IndicatorValue(ind_handle,index,  buffer_num);
   const double value1=IndicatorValue(ind_handle,index+1,buffer_num);
   const double value2=IndicatorValue(ind_handle,index+2,buffer_num);
//--- If at least one of the values could not be obtained, return an undefined value
   if(value0==EMPTY_VALUE || value1==EMPTY_VALUE || value2==EMPTY_VALUE)
      return LINE_STATE_NONE;
//--- Line upward reversal (value2>value1 && value0>value1)
   if(NormalizeDouble(value2-value1,ind_digits)>0 && NormalizeDouble(value0-value1,ind_digits)>0)
      return LINE_STATE_TURN_UP;
//--- Line upward direction (value2<=value1 && value0>value1)
   else if(NormalizeDouble(value2-value1,ind_digits)<=0 && NormalizeDouble(value0-value1,ind_digits)>0)
      return LINE_STATE_UP;
//--- Line upward stop (value2<=value1 && value0==value1)
   else if(NormalizeDouble(value2-value1,ind_digits)<=0 && NormalizeDouble(value0-value1,ind_digits)==0)
      return LINE_STATE_STOP_UP;
//--- Line downward reversal (value2<value1 && value0<value1)
   if(NormalizeDouble(value2-value1,ind_digits)<0 && NormalizeDouble(value0-value1,ind_digits)<0)
      return LINE_STATE_TURN_DOWN;
//--- Line downward direction (value2>=value1 && value0<value1)
   else if(NormalizeDouble(value2-value1,ind_digits)>=0 && NormalizeDouble(value0-value1,ind_digits)<0)
      return LINE_STATE_DOWN;
//--- Line downward stop (value2>=value1 && value0==value1)
   else if(NormalizeDouble(value2-value1,ind_digits)>=0 && NormalizeDouble(value0-value1,ind_digits)==0)
      return LINE_STATE_STOP_DOWN;
//--- Undefined state
   return LINE_STATE_NONE;
  }
//+------------------------------------------------------------------+
//| Return the state of the line relative to the specified level     |
//+------------------------------------------------------------------+
ENUM_LINE_STATE LineStateRelative(const int ind_handle,const int index,const int buffer_num,const double level0,const double level1=EMPTY_VALUE)
  {
//--- Get the values of the indicator line with the shift (0,1) relative to the passed index
   const double value0=IndicatorValue(ind_handle,index,  buffer_num);
   const double value1=IndicatorValue(ind_handle,index+1,buffer_num);
//--- If at least one of the values could not be obtained, return an undefined value
   if(value0==EMPTY_VALUE || value1==EMPTY_VALUE)
      return LINE_STATE_NONE;
//--- Define the second level to compare
   double level=(level1==EMPTY_VALUE ? level0 : level1);
//--- The line is below the level (value1<level && value0<level0)
   if(NormalizeDouble(value1-level,ind_digits)<0 && NormalizeDouble(value0-level0,ind_digits)<0)
      return LINE_STATE_UNDER;
//--- The line is above the level (value1>level && value0>level0)
   if(NormalizeDouble(value1-level,ind_digits)>0 && NormalizeDouble(value0-level0,ind_digits)>0)
      return LINE_STATE_ABOVE;
//--- The line crossed the level upwards (value1<=level && value0>level0)
   if(NormalizeDouble(value1-level,ind_digits)<=0 && NormalizeDouble(value0-level0,ind_digits)>0)
      return LINE_STATE_CROSS_UP;
//--- The line crossed the level downwards (value1>=level && value0<level0)
   if(NormalizeDouble(value1-level,ind_digits)>=0 && NormalizeDouble(value0-level0,ind_digits)<0)
      return LINE_STATE_CROSS_DOWN;
//--- The line touched the level from below (value1<level0 && value0==level0)
   if(NormalizeDouble(value1-level,ind_digits)<0 && NormalizeDouble(value0-level0,ind_digits)==0)
      return LINE_STATE_TOUCH_BELOW;
//--- The line touched the level from above (value1>level0 && value0==level0)
   if(NormalizeDouble(value1-level,ind_digits)>0 && NormalizeDouble(value0-level0,ind_digits)==0)
      return LINE_STATE_TOUCH_BELOW;
//--- Line is equal to the level value (value1==level0 && value0==level0)
   if(NormalizeDouble(value1-level,ind_digits)==0 && NormalizeDouble(value0-level0,ind_digits)==0)
      return LINE_STATE_EQUALS;
//--- Undefined state
   return LINE_STATE_NONE;
  }
//+------------------------------------------------------------------+
//| Return the indicator line state description                      |
//+------------------------------------------------------------------+
string LineStateDescription(const ENUM_LINE_STATE state)
  {
   switch(state)
     {
      case LINE_STATE_UP         :  return "Up";
      case LINE_STATE_STOP_UP    :  return "Stop Up";
      case LINE_STATE_TURN_UP    :  return "Turn Up";
      case LINE_STATE_DOWN       :  return "Down";
      case LINE_STATE_STOP_DOWN  :  return "Stop Down";
      case LINE_STATE_TURN_DOWN  :  return "Turn Down";
      case LINE_STATE_ABOVE      :  return "Above level";
      case LINE_STATE_UNDER      :  return "Under level";
      case LINE_STATE_CROSS_UP   :  return "Crossing Up";
      case LINE_STATE_CROSS_DOWN :  return "Crossing Down";
      case LINE_STATE_TOUCH_BELOW:  return "Touch from Below";
      case LINE_STATE_TOUCH_ABOVE:  return "Touch from Above";
      case LINE_STATE_EQUALS     :  return "Equals";
      default                    :  return "Unknown";
     }
  }
Al utilizar el panel informativo, los datos se mostrarán en el panel utilizando la función:
//+------------------------------------------------------------------+
//| Display data from the specified timeseries index to the panel    |
//+------------------------------------------------------------------+
void DrawData(const int index,const datetime time)
  {
//--- Declare the variables to receive data in them
   MqlTick  tick={0};
   MqlRates rates[1];

//--- Exit if unable to get the current prices
   if(!SymbolInfoTick(Symbol(),tick))
      return;
//--- Exit if unable to get the bar data by the specified index
   if(CopyRates(Symbol(),PERIOD_CURRENT,index,1,rates)!=1)
      return;

//--- Set font parameters for bar and indicator data headers
   int  size=0;
   uint flags=0;
   uint angle=0;
   string name=panel.FontParams(size,flags,angle);
   panel.SetFontParams(name,9,FW_BOLD);
   panel.DrawText("Bar data ["+(string)index+"]",3,panel.TableY1(0)-16,clrMaroon,panel.Width()-6);
   panel.DrawText("Indicator data ["+(string)index+"]",3,panel.TableY1(1)-16,clrGreen,panel.Width()-6);
//--- Set font parameters for bar and indicator data
   panel.SetFontParams(name,9);

//--- Display the data of the specified bar in table 0 on the panel
   panel.DrawText("Date",  panel.CellX(0,0,0)+2, panel.CellY(0,0,0)+2); panel.DrawText(TimeToString(  rates[0].time,TIME_DATE),     panel.CellX(0,0,1)+2, panel.CellY(0,0,1)+2,clrNONE,90);
   panel.DrawText("Time",  panel.CellX(0,1,0)+2, panel.CellY(0,1,0)+2); panel.DrawText(TimeToString(  rates[0].time,TIME_MINUTES),  panel.CellX(0,1,1)+2, panel.CellY(0,1,1)+2,clrNONE,90);
   panel.DrawText("Open",  panel.CellX(0,2,0)+2, panel.CellY(0,2,0)+2); panel.DrawText(DoubleToString(rates[0].open,Digits()),      panel.CellX(0,2,1)+2, panel.CellY(0,2,1)+2,clrNONE,90);
   panel.DrawText("High",  panel.CellX(0,3,0)+2, panel.CellY(0,3,0)+2); panel.DrawText(DoubleToString(rates[0].high,Digits()),      panel.CellX(0,3,1)+2, panel.CellY(0,3,1)+2,clrNONE,90);
   panel.DrawText("Low",   panel.CellX(0,4,0)+2, panel.CellY(0,4,0)+2); panel.DrawText(DoubleToString(rates[0].low,Digits()),       panel.CellX(0,4,1)+2, panel.CellY(0,4,1)+2,clrNONE,90);
   panel.DrawText("Close", panel.CellX(0,5,0)+2, panel.CellY(0,5,0)+2); panel.DrawText(DoubleToString(rates[0].close,Digits()),     panel.CellX(0,5,1)+2, panel.CellY(0,5,1)+2,clrNONE,90);

//--- Get the indicator lines data
   double value_jaws=IndicatorValue(handle,index,GATORJAW_LINE);
   double value_teeth=IndicatorValue(handle,index,GATORTEETH_LINE);
   double value_lips=IndicatorValue(handle,index,GATORLIPS_LINE);

//--- Display the Jaws line data from the specified bar on the panel in table 1
   string jaws_str=StringFormat("Jaws(%lu)",period_jaws);
   panel.DrawText(jaws_str, panel.CellX(1,0,0)+2, panel.CellY(1,0,0)+2);
   string value_str=(value_jaws!=EMPTY_VALUE ? DoubleToString(value_jaws,ind_digits) : "");
   panel.DrawText(value_str,panel.CellX(1,0,1)+2,panel.CellY(1,0,1)+2,clrNONE,90);
//--- Display the Teeth line data from the specified bar on the panel in table 1
   string teeth_str=StringFormat("Teeth(%lu)",period_teeth);
   panel.DrawText(teeth_str, panel.CellX(1,1,0)+2, panel.CellY(1,1,0)+2);
   value_str=(value_teeth!=EMPTY_VALUE ? DoubleToString(value_teeth,ind_digits) : "");
   panel.DrawText(value_str,panel.CellX(1,1,1)+2,panel.CellY(1,1,1)+2,clrNONE,90);
//--- Display the Lips line data from the specified bar on the panel in table 1
   string lips_str=StringFormat("Lips(%lu)",period_jaws);
   panel.DrawText(lips_str, panel.CellX(1,2,0)+2, panel.CellY(1,2,0)+2);
   value_str=(value_lips!=EMPTY_VALUE ? DoubleToString(value_lips,ind_digits) : "");
   panel.DrawText(value_str,panel.CellX(1,2,1)+2,panel.CellY(1,2,1)+2,clrNONE,90);

//--- Display a description of the Teeth line state relative to the Jaws line
   panel.DrawText("Teeth vs Jaws", panel.CellX(1,3,0)+2, panel.CellY(1,3,0)+2);
   ENUM_LINE_STATE state_tj=LineStateRelative(handle,index,1,value_jaws,IndicatorValue(handle,index+1,GATORJAW_LINE));
   string state_tj_str=
     (
      state_tj==LINE_STATE_ABOVE        ?  "Teeth > Jaws"  :
      state_tj==LINE_STATE_UNDER        ?  "Teeth < Jaws"  :
      state_tj==LINE_STATE_TOUCH_ABOVE  ||
      state_tj==LINE_STATE_TOUCH_BELOW  ?  "Touch"     :
      LineStateDescription(state_tj)
     );
//--- The label color changes depending on the value of the line relative to the level
   color clr=(state_tj==LINE_STATE_CROSS_UP || state_tj==LINE_STATE_ABOVE  ? clrBlue : state_tj==LINE_STATE_CROSS_DOWN || state_tj==LINE_STATE_UNDER ? clrRed : clrNONE);
   panel.DrawText(state_tj_str,panel.CellX(1,3,1)+2,panel.CellY(1,3,1)+2,clr,90);

//--- Display a description of the Lips line state relative to the Teeth line
   panel.DrawText("Lips vs Teeth", panel.CellX(1,4,0)+2, panel.CellY(1,4,0)+2);
   ENUM_LINE_STATE state_lt=LineStateRelative(handle,index,2,value_teeth,IndicatorValue(handle,index+1,GATORTEETH_LINE));
   string state_lt_str=
     (
      state_lt==LINE_STATE_ABOVE        ?  "Lips > Teeth"  :
      state_lt==LINE_STATE_UNDER        ?  "Lips < Teeth"  :
      state_lt==LINE_STATE_TOUCH_ABOVE  ||
      state_lt==LINE_STATE_TOUCH_BELOW  ?  "Touch"     :
      LineStateDescription(state_lt)
     );
//--- The label color changes depending on the value of the line relative to the level
   clr=(state_lt==LINE_STATE_CROSS_UP || state_lt==LINE_STATE_ABOVE  ? clrBlue : state_lt==LINE_STATE_CROSS_DOWN || state_lt==LINE_STATE_UNDER ? clrRed : clrNONE);
   panel.DrawText(state_lt_str,panel.CellX(1,4,1)+2,panel.CellY(1,4,1)+2,clr,90);

//--- Redraw the chart to immediately display all changes on the panel
   ChartRedraw(ChartID());
  }
Además de los valores de las líneas de indicador de las barras situadas bajo el cursor, el panel mostrará los estados de las relaciones de las líneas Teeth — Jaws y las líneas Lips — Teeth. Sus proporciones se muestran en texto y sus disposiciones mutuas se marcarán con el color del texto mostrado.
Además, al utilizar un panel informativo, el manejador de eventos OnChartEvent() del asesor llamará al manejador de eventos del panel informativo y procesará los eventos para obtener el índice de la barra bajo el cursor:
//+------------------------------------------------------------------+
//| ChartEvent function                                              |
//+------------------------------------------------------------------+
void OnChartEvent(const int id,
                  const long &lparam,
                  const double &dparam,
                  const string &sparam)
  {
//--- Handling the panel
//--- Call the panel event handler
   panel.OnChartEvent(id,lparam,dparam,sparam);

//--- If the cursor moves or a click is made on the chart
   if(id==CHARTEVENT_MOUSE_MOVE || id==CHARTEVENT_CLICK)
     {
      //--- Declare the variables to record time and price coordinates in them
      datetime time=0;
      double price=0;
      int wnd=0;
      //--- If the cursor coordinates are converted to date and time
      if(ChartXYToTimePrice(ChartID(),(int)lparam,(int)dparam,wnd,time,price))
        {
         //--- write the bar index where the cursor is located to a global variable
         mouse_bar_index=iBarShift(Symbol(),PERIOD_CURRENT,time);
         //--- Display the bar data under the cursor on the panel
         DrawData(mouse_bar_index,time);
        }
     }

//--- If we received a custom event, display the appropriate message in the journal
   if(id>CHARTEVENT_CUSTOM)
     {
      //--- Here we can implement handling a click on the close button on the panel
      PrintFormat("%s: Event id=%ld, object id (lparam): %lu, event message (sparam): %s",__FUNCTION__,id,lparam,sparam);
     }
  }
Tras compilar y ejecutar el asesor en el gráfico, podremos controlar el valor y el estado de la línea de indicador en el panel informativo:
Podrá ver el archivo del asesor de pruebas "TestWilliamsAlligator.mq5" en los archivos adjuntos.
Awesome Oscillator
El indicador técnico Awesome Oscillator (AO) de Bill Williams es una media móvil simple de 34 periodos basada en los puntos centrales de las barras (H+L)/2, que se resta de una media móvil simple de 5 periodos basada en los puntos centrales de las barras (H+L)/2. Nos dice exactamente lo que está sucediendo en el momento actual con el impulso del mercado.
Señales de compra
- La señal "Platillo" se formará cuando el histograma cambie de dirección de descendente a ascendente. La segunda columna será más baja que la primera y estará coloreada en rojo. La tercera columna será más alta que la segunda y será de color verde;
- para formar la señal de "Platillo", se necesitarán al menos tres barras de histograma.
Recuerde que al utilizar la señal de compra de "Platillo", todas las barras de Awesome Oscillator deberán estar por encima de la línea cero.
El "cruce de línea cero" es una señal de compra que se formará cuando el histograma pase de valores negativos a valores positivos. En este caso, además:
- solo se necesitarán dos columnas para formar esta señal;
- la primera columna deberá estar por debajo de la línea cero, la segunda columna deberá cruzar la línea cero (transición de valor negativo a positivo);
- es imposible tener una señal de compra y de venta al mismo tiempo.
"Dos picos" es la única señal de compra que puede formarse cuando los valores del histograma se sitúan por debajo de la línea cero. Hay que tener en cuenta lo siguiente:
- se formará cuando tengamos un pico descendente (el mínimo más bajo) que esté por debajo de la línea cero, seguido de otro pico descendente que esté más alto (un número negativo que sea más pequeño en valor absoluto, por lo que estará más cerca de la línea cero) que el pico anterior que mire hacia abajo;
- el histograma deberá encontrarse por debajo de la línea cero entre los dos picos. Si el histograma cruza la línea cero entre los picos, la señal de compra no será válida. Sin embargo, se creará la señal de compra "Cruce de Línea Cero";
- cada nuevo pico del histograma deberá ser más alto (un número negativo inferior por módulo que se encuentre más cerca de la línea cero) que el pico anterior;
- Si se forma un pico adicional más alto (que está más cerca de la línea cero) y el histograma no ha cruzado la línea cero, se formará una señal de compra adicional.
Señales de venta
Las señales de venta de Awesome Oscillator son idénticas a las señales de compra. La señal del "Platillo" se invertirá y estará por debajo de cero. El "Cruce de Línea Cero" irá en orden descendente: la primera columna estará por encima de cero, y la segunda por debajo, mientras que los "dos picos" se encontrarán por encima de la línea cero y también invertidos.
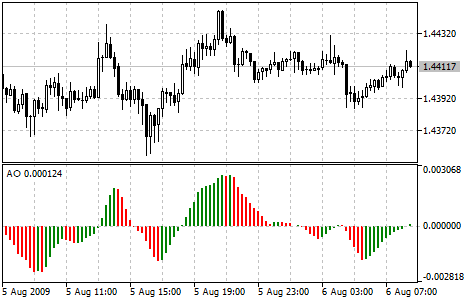
Parámetros
La función iAO() se utiliza para crear el manejador del indicador:
Retorna el manejador del indicador Awesome Oscillator. Solo un búfer.
int  iAO(
   string           symbol,     // symbol name
   ENUM_TIMEFRAMES  period      // period
   );
symbol
[in] Nombre simbólico del instrumento sobre cuyos datos se calculará el indicador. NULL indicará el símbolo actual.
period
[in] El valor del periodo puede ser uno de los valores de la enumeración ENUM_TIMEFRAMES, 0 indicará el marco temporal actual.
Retorna el manejador del indicador técnico especificado, en caso de fallo retornará INVALID_HANDLE. Para liberar la memoria del ordenador de un indicador que ya no se utiliza, se utilizará la función IndicatorRelease(), a la que se le transmitirá el manejador de este indicador.
Para crear un indicador en el asesor, declararemos las variables de entrada y las variables globales:
//+------------------------------------------------------------------+
//|                                               TestWilliamsAO.mq5 |
//|                                  Copyright 2023, MetaQuotes Ltd. |
//|                                             https://www.mql5.com |
//+------------------------------------------------------------------+
#property copyright "Copyright 2023, MetaQuotes Ltd."
#property link      "https://www.mql5.com"
#property version   "1.00"
//--- enums
enum ENUM_LINE_STATE
  {
   LINE_STATE_NONE,        // Undefined state
   LINE_STATE_UP,          // Upward
   LINE_STATE_DOWN,        // Downward
   LINE_STATE_TURN_UP,     // Upward reversal
   LINE_STATE_TURN_DOWN,   // Downward reversal
   LINE_STATE_STOP_UP,     // Upward stop
   LINE_STATE_STOP_DOWN,   // Downward stop
   LINE_STATE_ABOVE,       // Above value
   LINE_STATE_UNDER,       // Below value
   LINE_STATE_CROSS_UP,    // Crossing value upwards
   LINE_STATE_CROSS_DOWN,  // Crossing value downwards
   LINE_STATE_TOUCH_BELOW, // Touching value from below
   LINE_STATE_TOUCH_ABOVE, // Touch value from above
   LINE_STATE_EQUALS,      // Equal to value
  };
//--- global variables
int      handle=INVALID_HANDLE;  // Indicator handle
int      ind_digits=0;           // Number of decimal places in the indicator values
string   ind_title;              // Indicator description
Al utilizar el panel informativo en el asesor, también declararemos las variables globales para él y conectaremos el archivo de clases del panel:
//+------------------------------------------------------------------+
//|                                               TestWilliamsAO.mq5 |
//|                                  Copyright 2023, MetaQuotes Ltd. |
//|                                             https://www.mql5.com |
//+------------------------------------------------------------------+
#property copyright "Copyright 2023, MetaQuotes Ltd."
#property link      "https://www.mql5.com"
#property version   "1.00"
//--- includes
#include <Dashboard\Dashboard.mqh>
//--- enums
enum ENUM_LINE_STATE
  {
   LINE_STATE_NONE,        // Undefined state
   LINE_STATE_UP,          // Upward
   LINE_STATE_DOWN,        // Downward
   LINE_STATE_TURN_UP,     // Upward reversal
   LINE_STATE_TURN_DOWN,   // Downward reversal
   LINE_STATE_STOP_UP,     // Upward stop
   LINE_STATE_STOP_DOWN,   // Downward stop
   LINE_STATE_ABOVE,       // Above value
   LINE_STATE_UNDER,       // Below value
   LINE_STATE_CROSS_UP,    // Crossing value upwards
   LINE_STATE_CROSS_DOWN,  // Crossing value downwards
   LINE_STATE_TOUCH_BELOW, // Touching value from below
   LINE_STATE_TOUCH_ABOVE, // Touch value from above
   LINE_STATE_EQUALS,      // Equal to value
  };
//--- global variables
int      handle=INVALID_HANDLE;  // Indicator handle
int      ind_digits=0;           // Number of decimal places in the indicator values
string   ind_title;              // Indicator description
//--- variables for the panel
int      mouse_bar_index;        // Index of the bar the data is taken from
CDashboard *panel=NULL;          // Pointer to the panel object
Inicialización
Establecimiento de los valores de las variables globales para el indicador y creación de su manejador:
//+------------------------------------------------------------------+
//| Expert initialization function                                   |
//+------------------------------------------------------------------+
int OnInit()
  {
//--- create timer
   EventSetTimer(60);

//--- Indicator
//--- Set the indicator name and the number of decimal places
   ind_title="AO";
   ind_digits=Digits()+1;
//--- Create indicator handle
   ResetLastError();
   handle=iAO(Symbol(),PERIOD_CURRENT);
   if(handle==INVALID_HANDLE)
     {
      PrintFormat("%s: Failed to create indicator handle %s. Error %ld",__FUNCTION__,ind_title,GetLastError());
      return INIT_FAILED;
     }

//--- Successful initialization
   return(INIT_SUCCEEDED);
  }
Al utilizar un panel informativo en el asesor, crearemos un panel:
//+------------------------------------------------------------------+
//| Expert initialization function                                   |
//+------------------------------------------------------------------+
int OnInit()
  {
//--- create timer
   EventSetTimer(60);

//--- Indicator
//--- Set the indicator name and the number of decimal places
   ind_title="AO";
   ind_digits=Digits()+1;
//--- Create indicator handle
   ResetLastError();
   handle=iAO(Symbol(),PERIOD_CURRENT);
   if(handle==INVALID_HANDLE)
     {
      PrintFormat("%s: Failed to create indicator handle %s. Error %ld",__FUNCTION__,ind_title,GetLastError());
      return INIT_FAILED;
     }

//--- Dashboard
//--- Create the panel
   panel=new CDashboard(1,20,20,199,225);
   if(panel==NULL)
     {
      Print("Error. Failed to create panel object");
      return INIT_FAILED;
     }
//--- Set font parameters
   panel.SetFontParams("Calibri",9);
//--- Display the panel with the "Symbol, Timeframe description" header text
   panel.View(Symbol()+", "+StringSubstr(EnumToString(Period()),7));
//--- Create a table with ID 0 to display bar data in it
   panel.CreateNewTable(0);
//--- Draw a table with ID 0 on the panel background
   panel.DrawGrid(0,2,20,6,2,18,97);

//--- Create a table with ID 1 to display indicator data in it
   panel.CreateNewTable(1);
//--- Get the Y2 table coordinate with ID 0 and
//--- set the Y1 coordinate for the table with ID 1
   int y1=panel.TableY2(0)+22;
//--- Draw a table with ID 1 on the panel background
   panel.DrawGrid(1,2,y1,3,2,18,97);

//--- Display tabular data in the journal
   panel.GridPrint(0,2);
   panel.GridPrint(1,2);
//--- Initialize the variable with the index of the mouse cursor bar
   mouse_bar_index=0;
//--- Display the data of the current bar on the panel
   DrawData(mouse_bar_index,TimeCurrent());

//--- Successful initialization
   return(INIT_SUCCEEDED);
  }
Desinicialización
En el manejador OnDeinit() del asesor liberaremos el manejador del indicador:
//+------------------------------------------------------------------+
//| Expert deinitialization function                                 |
//+------------------------------------------------------------------+
void OnDeinit(const int reason)
  {
//--- destroy timer
   EventKillTimer();

//--- Release handle of the indicator
   ResetLastError();
   if(!IndicatorRelease(handle))
      PrintFormat("%s: IndicatorRelease failed. Error %ld",__FUNCTION__,GetLastError());
//--- Clear all comments on the chart
   Comment("");
  }
Al utilizar un panel informativo, eliminaremos el objeto de panel creado:
//+------------------------------------------------------------------+
//| Expert deinitialization function                                 |
//+------------------------------------------------------------------+
void OnDeinit(const int reason)
  {
//--- destroy timer
   EventKillTimer();

//--- Release handle of the indicator
   ResetLastError();
   if(!IndicatorRelease(handle))
      PrintFormat("%s: IndicatorRelease failed. Error %ld",__FUNCTION__,GetLastError());
//--- Clear all comments on the chart
   Comment("");

//--- If the panel object exists, delete it
   if(panel!=NULL)
      delete panel;
  }
Obtención de datos
A continuación se presentarán las funciones generales de la obtención de datos usando el manejador del indicador. Ya analizamos dichas funciones en el artículo sobre la conexión de osciladores en asesores. Podrá utilizar las funciones presentadas "tal cual" en sus programas:
//+------------------------------------------------------------------+
//| Return the indicator data on the specified bar                   |
//+------------------------------------------------------------------+
double IndicatorValue(const int ind_handle,const int index,const int buffer_num)
  {
   double array[1]={0};
   ResetLastError();
   if(CopyBuffer(ind_handle,buffer_num,index,1,array)!=1)
     {
      PrintFormat("%s: CopyBuffer failed. Error %ld",__FUNCTION__,GetLastError());
      return EMPTY_VALUE;
     }
   return array[0];
  }
//+------------------------------------------------------------------+
//| Return the state of the indicator line                           |
//+------------------------------------------------------------------+
ENUM_LINE_STATE LineState(const int ind_handle,const int index,const int buffer_num)
  {
//--- Get the values of the indicator line with the shift (0,1,2) relative to the passed index
   const double value0=IndicatorValue(ind_handle,index,  buffer_num);
   const double value1=IndicatorValue(ind_handle,index+1,buffer_num);
   const double value2=IndicatorValue(ind_handle,index+2,buffer_num);
//--- If at least one of the values could not be obtained, return an undefined value
   if(value0==EMPTY_VALUE || value1==EMPTY_VALUE || value2==EMPTY_VALUE)
      return LINE_STATE_NONE;
//--- Line upward reversal (value2>value1 && value0>value1)
   if(NormalizeDouble(value2-value1,ind_digits)>0 && NormalizeDouble(value0-value1,ind_digits)>0)
      return LINE_STATE_TURN_UP;
//--- Line upward direction (value2<=value1 && value0>value1)
   else if(NormalizeDouble(value2-value1,ind_digits)<=0 && NormalizeDouble(value0-value1,ind_digits)>0)
      return LINE_STATE_UP;
//--- Line upward stop (value2<=value1 && value0==value1)
   else if(NormalizeDouble(value2-value1,ind_digits)<=0 && NormalizeDouble(value0-value1,ind_digits)==0)
      return LINE_STATE_STOP_UP;
//--- Line downward reversal (value2<value1 && value0<value1)
   if(NormalizeDouble(value2-value1,ind_digits)<0 && NormalizeDouble(value0-value1,ind_digits)<0)
      return LINE_STATE_TURN_DOWN;
//--- Line downward direction (value2>=value1 && value0<value1)
   else if(NormalizeDouble(value2-value1,ind_digits)>=0 && NormalizeDouble(value0-value1,ind_digits)<0)
      return LINE_STATE_DOWN;
//--- Line downward stop (value2>=value1 && value0==value1)
   else if(NormalizeDouble(value2-value1,ind_digits)>=0 && NormalizeDouble(value0-value1,ind_digits)==0)
      return LINE_STATE_STOP_DOWN;
//--- Undefined state
   return LINE_STATE_NONE;
  }
//+------------------------------------------------------------------+
//| Return the state of the line relative to the specified level     |
//+------------------------------------------------------------------+
ENUM_LINE_STATE LineStateRelative(const int ind_handle,const int index,const int buffer_num,const double level0,const double level1=EMPTY_VALUE)
  {
//--- Get the values of the indicator line with the shift (0,1) relative to the passed index
   const double value0=IndicatorValue(ind_handle,index,  buffer_num);
   const double value1=IndicatorValue(ind_handle,index+1,buffer_num);
//--- If at least one of the values could not be obtained, return an undefined value
   if(value0==EMPTY_VALUE || value1==EMPTY_VALUE)
      return LINE_STATE_NONE;
//--- Define the second level to compare
   double level=(level1==EMPTY_VALUE ? level0 : level1);
//--- The line is below the level (value1<level && value0<level0)
   if(NormalizeDouble(value1-level,ind_digits)<0 && NormalizeDouble(value0-level0,ind_digits)<0)
      return LINE_STATE_UNDER;
//--- The line is above the level (value1>level && value0>level0)
   if(NormalizeDouble(value1-level,ind_digits)>0 && NormalizeDouble(value0-level0,ind_digits)>0)
      return LINE_STATE_ABOVE;
//--- The line crossed the level upwards (value1<=level && value0>level0)
   if(NormalizeDouble(value1-level,ind_digits)<=0 && NormalizeDouble(value0-level0,ind_digits)>0)
      return LINE_STATE_CROSS_UP;
//--- The line crossed the level downwards (value1>=level && value0<level0)
   if(NormalizeDouble(value1-level,ind_digits)>=0 && NormalizeDouble(value0-level0,ind_digits)<0)
      return LINE_STATE_CROSS_DOWN;
//--- The line touched the level from below (value1<level0 && value0==level0)
   if(NormalizeDouble(value1-level,ind_digits)<0 && NormalizeDouble(value0-level0,ind_digits)==0)
      return LINE_STATE_TOUCH_BELOW;
//--- The line touched the level from above (value1>level0 && value0==level0)
   if(NormalizeDouble(value1-level,ind_digits)>0 && NormalizeDouble(value0-level0,ind_digits)==0)
      return LINE_STATE_TOUCH_BELOW;
//--- Line is equal to the level value (value1==level0 && value0==level0)
   if(NormalizeDouble(value1-level,ind_digits)==0 && NormalizeDouble(value0-level0,ind_digits)==0)
      return LINE_STATE_EQUALS;
//--- Undefined state
   return LINE_STATE_NONE;
  }
//+------------------------------------------------------------------+
//| Return the indicator line state description                      |
//+------------------------------------------------------------------+
string LineStateDescription(const ENUM_LINE_STATE state)
  {
   switch(state)
     {
      case LINE_STATE_UP         :  return "Up";
      case LINE_STATE_STOP_UP    :  return "Stop Up";
      case LINE_STATE_TURN_UP    :  return "Turn Up";
      case LINE_STATE_DOWN       :  return "Down";
      case LINE_STATE_STOP_DOWN  :  return "Stop Down";
      case LINE_STATE_TURN_DOWN  :  return "Turn Down";
      case LINE_STATE_ABOVE      :  return "Above level";
      case LINE_STATE_UNDER      :  return "Under level";
      case LINE_STATE_CROSS_UP   :  return "Crossing Up";
      case LINE_STATE_CROSS_DOWN :  return "Crossing Down";
      case LINE_STATE_TOUCH_BELOW:  return "Touch from Below";
      case LINE_STATE_TOUCH_ABOVE:  return "Touch from Above";
      case LINE_STATE_EQUALS     :  return "Equals";
      default                    :  return "Unknown";
     }
  }
Al utilizar el panel informativo, los datos se mostrarán en el panel utilizando la función:
//+------------------------------------------------------------------+
//| Display data from the specified timeseries index to the panel    |
//+------------------------------------------------------------------+
void DrawData(const int index,const datetime time)
  {
//--- Declare the variables to receive data in them
   MqlTick  tick={0};
   MqlRates rates[1];

//--- Exit if unable to get the current prices
   if(!SymbolInfoTick(Symbol(),tick))
      return;
//--- Exit if unable to get the bar data by the specified index
   if(CopyRates(Symbol(),PERIOD_CURRENT,index,1,rates)!=1)
      return;

//--- Set font parameters for bar and indicator data headers
   int  size=0;
   uint flags=0;
   uint angle=0;
   string name=panel.FontParams(size,flags,angle);
   panel.SetFontParams(name,9,FW_BOLD);
   panel.DrawText("Bar data ["+(string)index+"]",3,panel.TableY1(0)-16,clrMaroon,panel.Width()-6);
   panel.DrawText("Indicator data ["+(string)index+"]",3,panel.TableY1(1)-16,clrGreen,panel.Width()-6);
//--- Set font parameters for bar and indicator data
   panel.SetFontParams(name,9);

//--- Display the data of the specified bar in table 0 on the panel
   panel.DrawText("Date",  panel.CellX(0,0,0)+2, panel.CellY(0,0,0)+2); panel.DrawText(TimeToString(  rates[0].time,TIME_DATE),     panel.CellX(0,0,1)+2, panel.CellY(0,0,1)+2,clrNONE,90);
   panel.DrawText("Time",  panel.CellX(0,1,0)+2, panel.CellY(0,1,0)+2); panel.DrawText(TimeToString(  rates[0].time,TIME_MINUTES),  panel.CellX(0,1,1)+2, panel.CellY(0,1,1)+2,clrNONE,90);
   panel.DrawText("Open",  panel.CellX(0,2,0)+2, panel.CellY(0,2,0)+2); panel.DrawText(DoubleToString(rates[0].open,Digits()),      panel.CellX(0,2,1)+2, panel.CellY(0,2,1)+2,clrNONE,90);
   panel.DrawText("High",  panel.CellX(0,3,0)+2, panel.CellY(0,3,0)+2); panel.DrawText(DoubleToString(rates[0].high,Digits()),      panel.CellX(0,3,1)+2, panel.CellY(0,3,1)+2,clrNONE,90);
   panel.DrawText("Low",   panel.CellX(0,4,0)+2, panel.CellY(0,4,0)+2); panel.DrawText(DoubleToString(rates[0].low,Digits()),       panel.CellX(0,4,1)+2, panel.CellY(0,4,1)+2,clrNONE,90);
   panel.DrawText("Close", panel.CellX(0,5,0)+2, panel.CellY(0,5,0)+2); panel.DrawText(DoubleToString(rates[0].close,Digits()),     panel.CellX(0,5,1)+2, panel.CellY(0,5,1)+2,clrNONE,90);

//--- Display the indicator data from the specified bar on the panel in table 1
   panel.DrawText(ind_title, panel.CellX(1,0,0)+2, panel.CellY(1,0,0)+2);
   double value0=IndicatorValue(handle,index,  0);
   double value1=IndicatorValue(handle,index+1,0);
   string value_str=(value0!=EMPTY_VALUE ? DoubleToString(value0,ind_digits) : "");
   color clr=(value0>value1 ? clrGreen : value0<value1 ? clrRed : clrNONE);
   panel.DrawText(value_str,panel.CellX(1,0,1)+2,panel.CellY(1,0,1)+2,clrNONE,90);

//--- Display a description of the indicator line state
   panel.DrawText("Line state", panel.CellX(1,1,0)+2, panel.CellY(1,1,0)+2);
   ENUM_LINE_STATE state=LineState(handle,index,0);
   panel.DrawText(LineStateDescription(state),panel.CellX(1,1,1)+2,panel.CellY(1,1,1)+2,clr,90);

//--- Display a description of the indicator line state relative to zero
   panel.DrawText("AO vs Zero", panel.CellX(1,2,0)+2, panel.CellY(1,2,0)+2);
   ENUM_LINE_STATE state_zero=LineStateRelative(handle,index,0,0);
   string state_zero_str=
     (
      state_zero==LINE_STATE_ABOVE        ?  "AO > 0"  :
      state_zero==LINE_STATE_UNDER        ?  "AO < 0"  :
      state_zero==LINE_STATE_TOUCH_ABOVE  ||
      state_zero==LINE_STATE_TOUCH_BELOW  ?  "Touch"     :
      LineStateDescription(state_zero)
     );
//--- The label color changes depending on the value of the line relative to the level
   clr=(state_zero==LINE_STATE_CROSS_UP ? clrGreen : state_zero==LINE_STATE_CROSS_DOWN ? clrRed : clrNONE);
   panel.DrawText(state_zero_str,panel.CellX(1,2,1)+2,panel.CellY(1,2,1)+2,clr,90);

//--- Redraw the chart to immediately display all changes on the panel
   ChartRedraw(ChartID());
  }
Además de describir el estado de la línea indicadora, que tiene el color de la columna del histograma situada bajo el cursor, el panel mostrará el estado de su posición respecto al cero. La línea indicadora que cruce la línea cero hacia arriba se marcará con color verde, y hacia abajo con color rojo.
Además, al utilizar un panel informativo, el manejador de eventos OnChartEvent() del asesor llamará al manejador de eventos del panel informativo y procesará los eventos para obtener el índice de la barra bajo el cursor:
//+------------------------------------------------------------------+
//| ChartEvent function                                              |
//+------------------------------------------------------------------+
void OnChartEvent(const int id,
                  const long &lparam,
                  const double &dparam,
                  const string &sparam)
  {
//--- Handling the panel
//--- Call the panel event handler
   panel.OnChartEvent(id,lparam,dparam,sparam);

//--- If the cursor moves or a click is made on the chart
   if(id==CHARTEVENT_MOUSE_MOVE || id==CHARTEVENT_CLICK)
     {
      //--- Declare the variables to record time and price coordinates in them
      datetime time=0;
      double price=0;
      int wnd=0;
      //--- If the cursor coordinates are converted to date and time
      if(ChartXYToTimePrice(ChartID(),(int)lparam,(int)dparam,wnd,time,price))
        {
         //--- write the bar index where the cursor is located to a global variable
         mouse_bar_index=iBarShift(Symbol(),PERIOD_CURRENT,time);
         //--- Display the bar data under the cursor on the panel
         DrawData(mouse_bar_index,time);
        }
     }

//--- If we received a custom event, display the appropriate message in the journal
   if(id>CHARTEVENT_CUSTOM)
     {
      //--- Here we can implement handling a click on the close button on the panel
      PrintFormat("%s: Event id=%ld, object id (lparam): %lu, event message (sparam): %s",__FUNCTION__,id,lparam,sparam);
     }
  }
Tras compilar y ejecutar el asesor en el gráfico, podremos controlar el valor y el estado de la línea de indicador en el panel informativo:
Podrá ver el archivo del asesor de pruebas "TestWilliamsAO.mq5" en los archivos adjuntos.
Fractals
Todos los mercados se caracterizan por una relativa falta de dinamismo: la mayor parte del tiempo sus precios no cambian mucho y solo durante un pequeño periodo de tiempo (15-30%) se producen cambios de tendencia. Los periodos más favorables para obtener beneficios son aquellos en los que los precios de los mercados cambian según una tendencia determinada.
Los fractales (Fractals) son uno de los cinco indicadores del sistema comercial de Bill Williams que permiten detectar un valle o un pico. La definición técnica de un fractal alcista es una serie de al menos cinco barras consecutivas con dos barras de máximos más bajos delante y detrás del máximo más alto. La configuración opuesta (una serie de cinco barras con dos barras con mínimos más altos delante y detrás del mínimo más bajo) corresponderá a un fractal descendente. En el gráfico, los fractales tendrán valores High y Low y estarán marcados con flechas hacia arriba o hacia abajo.
Las señales del indicador técnico Fractals se deberán filtrar con la ayuda del indicador técnico Alligator. En otras palabras, no deberemos entrar en una operación de compra si el fractal se encuentra por debajo de los Dientes del Caimán, y no deberemos entrar en una operación de venta si el fractal está por encima de los Dientes del Caimán. Una vez la señal fractal se haya formado y tenga fuerza, según lo determinado por su posición fuera de las Mandíbulas del Caimán, seguirá siendo una señal hasta que sea invalidada, o hasta que aparezca una señal fractal más reciente.
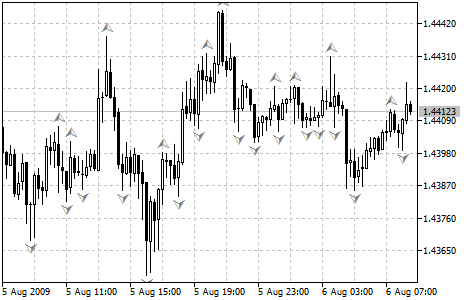
Parámetros
La función iFractals() se utiliza para crear el manejador del indicador:
Retorna el manejador del indicador Fractals.
int  iFractals(
   string           symbol,     // symbol name
   ENUM_TIMEFRAMES  period      // period
   );
symbol
[in] Nombre simbólico del instrumento sobre cuyos datos se calculará el indicador. NULL indicará el símbolo actual.
period
[in] El valor del periodo puede ser uno de los valores de la enumeración ENUM_TIMEFRAMES, 0 indicará el marco temporal actual.
Valor retornado
Retorna el manejador del indicador técnico especificado, en caso de fallo retornará INVALID_HANDLE. Para liberar la memoria del ordenador de un indicador que ya no se utiliza, se utilizará la función IndicatorRelease(), a la que se le transmitirá el manejador de este indicador.
Números de los búferes: 0 — UPPER_LINE, 1 — LOWER_LINE.
Para crear un indicador en el asesor, declararemos las variables de entrada y las variables globales:
//+------------------------------------------------------------------+
//|                                         TestWilliamsFractals.mq5 |
//|                                  Copyright 2023, MetaQuotes Ltd. |
//|                                             https://www.mql5.com |
//+------------------------------------------------------------------+
#property copyright "Copyright 2023, MetaQuotes Ltd."
#property link      "https://www.mql5.com"
#property version   "1.00"
//--- global variables
int      handle=INVALID_HANDLE;  // Indicator handle
int      ind_digits=0;           // Number of decimal places in the indicator values
string   ind_title;              // Indicator description
Al utilizar el panel informativo en el asesor, también declararemos las variables globales para él y conectaremos el archivo de clases del panel:
//+------------------------------------------------------------------+
//|                                         TestWilliamsFractals.mq5 |
//|                                  Copyright 2023, MetaQuotes Ltd. |
//|                                             https://www.mql5.com |
//+------------------------------------------------------------------+
#property copyright "Copyright 2023, MetaQuotes Ltd."
#property link      "https://www.mql5.com"
#property version   "1.00"
//--- includes
#include <Dashboard\Dashboard.mqh>
//--- global variables
int      handle=INVALID_HANDLE;  // Indicator handle
int      ind_digits=0;           // Number of decimal places in the indicator values
string   ind_title;              // Indicator description
//--- variables for the panel
int      mouse_bar_index;        // Index of the bar the data is taken from
CDashboard *panel=NULL;          // Pointer to the panel object
Inicialización
Establecimiento de los valores de las variables globales para el indicador y creación de su manejador:
//+------------------------------------------------------------------+
//| Expert initialization function                                   |
//+------------------------------------------------------------------+
int OnInit()
  {
//--- create timer
   EventSetTimer(60);

//--- Indicator
//--- Set the indicator name and the number of decimal places
   ind_title="Fractals";
   ind_digits=Digits();
//--- Create indicator handle
   ResetLastError();
   handle=iFractals(Symbol(),PERIOD_CURRENT);
   if(handle==INVALID_HANDLE)
     {
      PrintFormat("%s: Failed to create indicator handle %s. Error %ld",__FUNCTION__,ind_title,GetLastError());
      return INIT_FAILED;
     }

//--- Successful initialization
   return(INIT_SUCCEEDED);
  }
Al utilizar un panel informativo en el asesor, crearemos un panel:
//+------------------------------------------------------------------+
//| Expert initialization function                                   |
//+------------------------------------------------------------------+
int OnInit()
  {
//--- create timer
   EventSetTimer(60);

//--- Indicator
//--- Set the indicator name and the number of decimal places
   ind_title="Fractals";
   ind_digits=Digits();
//--- Create indicator handle
   ResetLastError();
   handle=iFractals(Symbol(),PERIOD_CURRENT);
   if(handle==INVALID_HANDLE)
     {
      PrintFormat("%s: Failed to create indicator handle %s. Error %ld",__FUNCTION__,ind_title,GetLastError());
      return INIT_FAILED;
     }

//--- Dashboard
//--- Create the panel
   panel=new CDashboard(1,20,20,199,225);
   if(panel==NULL)
     {
      Print("Error. Failed to create panel object");
      return INIT_FAILED;
     }
//--- Set font parameters
   panel.SetFontParams("Calibri",9);
//--- Display the panel with the "Symbol, Timeframe description" header text
   panel.View(Symbol()+", "+StringSubstr(EnumToString(Period()),7));
//--- Create a table with ID 0 to display bar data in it
   panel.CreateNewTable(0);
//--- Draw a table with ID 0 on the panel background
   panel.DrawGrid(0,2,20,6,2,18,97);

//--- Create a table with ID 1 to display indicator data in it
   panel.CreateNewTable(1);
//--- Get the Y2 table coordinate with ID 0 and
//--- set the Y1 coordinate for the table with ID 1
   int y1=panel.TableY2(0)+22;
//--- Draw a table with ID 1 on the panel background
   panel.DrawGrid(1,2,y1,3,2,18,97);

//--- Display tabular data in the journal
   panel.GridPrint(0,2);
   panel.GridPrint(1,2);
//--- Initialize the variable with the index of the mouse cursor bar
   mouse_bar_index=0;
//--- Display the data of the current bar on the panel
   DrawData(mouse_bar_index,TimeCurrent());

//--- Successful initialization
   return(INIT_SUCCEEDED);
  }
Desinicialización
En el manejador OnDeinit() del asesor liberaremos el manejador del indicador:
//+------------------------------------------------------------------+
//| Expert deinitialization function                                 |
//+------------------------------------------------------------------+
void OnDeinit(const int reason)
  {
//--- destroy timer
   EventKillTimer();

//--- Release handle of the indicator
   ResetLastError();
   if(!IndicatorRelease(handle))
      PrintFormat("%s: IndicatorRelease failed. Error %ld",__FUNCTION__,GetLastError());
//--- Clear all comments on the chart
   Comment("");
  }
Al utilizar un panel informativo, eliminaremos el objeto de panel creado:
//+------------------------------------------------------------------+
//| Expert deinitialization function                                 |
//+------------------------------------------------------------------+
void OnDeinit(const int reason)
  {
//--- destroy timer
   EventKillTimer();

//--- Release handle of the indicator
   ResetLastError();
   if(!IndicatorRelease(handle))
      PrintFormat("%s: IndicatorRelease failed. Error %ld",__FUNCTION__,GetLastError());
//--- Clear all comments on the chart
   Comment("");

//--- If the panel object exists, delete it
   if(panel!=NULL)
      delete panel;
  }
Obtención de datos
A continuación se presentarán las funciones generales de la obtención de datos usando el manejador del indicador. Ya analizamos dichas funciones en el artículo sobre la conexión de osciladores en asesores. Podrá utilizar las funciones presentadas "tal cual" en sus programas:
//+------------------------------------------------------------------+
//| Return the indicator data on the specified bar                   |
//+------------------------------------------------------------------+
double IndicatorValue(const int ind_handle,const int index,const int buffer_num)
  {
   double array[1]={0};
   ResetLastError();
   if(CopyBuffer(ind_handle,buffer_num,index,1,array)!=1)
     {
      PrintFormat("%s: CopyBuffer failed. Error %ld",__FUNCTION__,GetLastError());
      return EMPTY_VALUE;
     }
   return array[0];
  }
//+------------------------------------------------------------------+
//| Return the state of the indicator line                           |
//+------------------------------------------------------------------+
ENUM_LINE_STATE LineState(const int ind_handle,const int index,const int buffer_num)
  {
//--- Get the values of the indicator line with the shift (0,1,2) relative to the passed index
   const double value0=IndicatorValue(ind_handle,index,  buffer_num);
   const double value1=IndicatorValue(ind_handle,index+1,buffer_num);
   const double value2=IndicatorValue(ind_handle,index+2,buffer_num);
//--- If at least one of the values could not be obtained, return an undefined value
   if(value0==EMPTY_VALUE || value1==EMPTY_VALUE || value2==EMPTY_VALUE)
      return LINE_STATE_NONE;
//--- Line upward reversal (value2>value1 && value0>value1)
   if(NormalizeDouble(value2-value1,ind_digits)>0 && NormalizeDouble(value0-value1,ind_digits)>0)
      return LINE_STATE_TURN_UP;
//--- Line upward direction (value2<=value1 && value0>value1)
   else if(NormalizeDouble(value2-value1,ind_digits)<=0 && NormalizeDouble(value0-value1,ind_digits)>0)
      return LINE_STATE_UP;
//--- Line upward stop (value2<=value1 && value0==value1)
   else if(NormalizeDouble(value2-value1,ind_digits)<=0 && NormalizeDouble(value0-value1,ind_digits)==0)
      return LINE_STATE_STOP_UP;
//--- Line downward reversal (value2<value1 && value0<value1)
   if(NormalizeDouble(value2-value1,ind_digits)<0 && NormalizeDouble(value0-value1,ind_digits)<0)
      return LINE_STATE_TURN_DOWN;
//--- Line downward direction (value2>=value1 && value0<value1)
   else if(NormalizeDouble(value2-value1,ind_digits)>=0 && NormalizeDouble(value0-value1,ind_digits)<0)
      return LINE_STATE_DOWN;
//--- Line downward stop (value2>=value1 && value0==value1)
   else if(NormalizeDouble(value2-value1,ind_digits)>=0 && NormalizeDouble(value0-value1,ind_digits)==0)
      return LINE_STATE_STOP_DOWN;
//--- Undefined state
   return LINE_STATE_NONE;
  }
//+------------------------------------------------------------------+
//| Return the state of the line relative to the specified level     |
//+------------------------------------------------------------------+
ENUM_LINE_STATE LineStateRelative(const int ind_handle,const int index,const int buffer_num,const double level0,const double level1=EMPTY_VALUE)
  {
//--- Get the values of the indicator line with the shift (0,1) relative to the passed index
   const double value0=IndicatorValue(ind_handle,index,  buffer_num);
   const double value1=IndicatorValue(ind_handle,index+1,buffer_num);
//--- If at least one of the values could not be obtained, return an undefined value
   if(value0==EMPTY_VALUE || value1==EMPTY_VALUE)
      return LINE_STATE_NONE;
//--- Define the second level to compare
   double level=(level1==EMPTY_VALUE ? level0 : level1);
//--- The line is below the level (value1<level && value0<level0)
   if(NormalizeDouble(value1-level,ind_digits)<0 && NormalizeDouble(value0-level0,ind_digits)<0)
      return LINE_STATE_UNDER;
//--- The line is above the level (value1>level && value0>level0)
   if(NormalizeDouble(value1-level,ind_digits)>0 && NormalizeDouble(value0-level0,ind_digits)>0)
      return LINE_STATE_ABOVE;
//--- The line crossed the level upwards (value1<=level && value0>level0)
   if(NormalizeDouble(value1-level,ind_digits)<=0 && NormalizeDouble(value0-level0,ind_digits)>0)
      return LINE_STATE_CROSS_UP;
//--- The line crossed the level downwards (value1>=level && value0<level0)
   if(NormalizeDouble(value1-level,ind_digits)>=0 && NormalizeDouble(value0-level0,ind_digits)<0)
      return LINE_STATE_CROSS_DOWN;
//--- The line touched the level from below (value1<level0 && value0==level0)
   if(NormalizeDouble(value1-level,ind_digits)<0 && NormalizeDouble(value0-level0,ind_digits)==0)
      return LINE_STATE_TOUCH_BELOW;
//--- The line touched the level from above (value1>level0 && value0==level0)
   if(NormalizeDouble(value1-level,ind_digits)>0 && NormalizeDouble(value0-level0,ind_digits)==0)
      return LINE_STATE_TOUCH_BELOW;
//--- Line is equal to the level value (value1==level0 && value0==level0)
   if(NormalizeDouble(value1-level,ind_digits)==0 && NormalizeDouble(value0-level0,ind_digits)==0)
      return LINE_STATE_EQUALS;
//--- Undefined state
   return LINE_STATE_NONE;
  }
//+------------------------------------------------------------------+
//| Return the indicator line state description                      |
//+------------------------------------------------------------------+
string LineStateDescription(const ENUM_LINE_STATE state)
  {
   switch(state)
     {
      case LINE_STATE_UP         :  return "Up";
      case LINE_STATE_STOP_UP    :  return "Stop Up";
      case LINE_STATE_TURN_UP    :  return "Turn Up";
      case LINE_STATE_DOWN       :  return "Down";
      case LINE_STATE_STOP_DOWN  :  return "Stop Down";
      case LINE_STATE_TURN_DOWN  :  return "Turn Down";
      case LINE_STATE_ABOVE      :  return "Above level";
      case LINE_STATE_UNDER      :  return "Under level";
      case LINE_STATE_CROSS_UP   :  return "Crossing Up";
      case LINE_STATE_CROSS_DOWN :  return "Crossing Down";
      case LINE_STATE_TOUCH_BELOW:  return "Touch from Below";
      case LINE_STATE_TOUCH_ABOVE:  return "Touch from Above";
      case LINE_STATE_EQUALS     :  return "Equals";
      default                    :  return "Unknown";
     }
  }
Al utilizar el panel informativo, los datos se mostrarán en el panel utilizando la función:
//+------------------------------------------------------------------+
//| Display data from the specified timeseries index to the panel    |
//+------------------------------------------------------------------+
void DrawData(const int index,const datetime time)
  {
//--- Declare the variables to receive data in them
   MqlTick  tick={0};
   MqlRates rates[1];

//--- Exit if unable to get the current prices
   if(!SymbolInfoTick(Symbol(),tick))
      return;
//--- Exit if unable to get the bar data by the specified index
   if(CopyRates(Symbol(),PERIOD_CURRENT,index,1,rates)!=1)
      return;

//--- Set font parameters for bar and indicator data headers
   int  size=0;
   uint flags=0;
   uint angle=0;
   string name=panel.FontParams(size,flags,angle);
   panel.SetFontParams(name,9,FW_BOLD);
   panel.DrawText("Bar data ["+(string)index+"]",3,panel.TableY1(0)-16,clrMaroon,panel.Width()-6);
   panel.DrawText("Indicator data ["+(string)index+"]",3,panel.TableY1(1)-16,clrGreen,panel.Width()-6);
//--- Set font parameters for bar and indicator data
   panel.SetFontParams(name,9);

//--- Display the data of the specified bar in table 0 on the panel
   panel.DrawText("Date",  panel.CellX(0,0,0)+2, panel.CellY(0,0,0)+2); panel.DrawText(TimeToString(  rates[0].time,TIME_DATE),     panel.CellX(0,0,1)+2, panel.CellY(0,0,1)+2,clrNONE,90);
   panel.DrawText("Time",  panel.CellX(0,1,0)+2, panel.CellY(0,1,0)+2); panel.DrawText(TimeToString(  rates[0].time,TIME_MINUTES),  panel.CellX(0,1,1)+2, panel.CellY(0,1,1)+2,clrNONE,90);
   panel.DrawText("Open",  panel.CellX(0,2,0)+2, panel.CellY(0,2,0)+2); panel.DrawText(DoubleToString(rates[0].open,Digits()),      panel.CellX(0,2,1)+2, panel.CellY(0,2,1)+2,clrNONE,90);
   panel.DrawText("High",  panel.CellX(0,3,0)+2, panel.CellY(0,3,0)+2); panel.DrawText(DoubleToString(rates[0].high,Digits()),      panel.CellX(0,3,1)+2, panel.CellY(0,3,1)+2,clrNONE,90);
   panel.DrawText("Low",   panel.CellX(0,4,0)+2, panel.CellY(0,4,0)+2); panel.DrawText(DoubleToString(rates[0].low,Digits()),       panel.CellX(0,4,1)+2, panel.CellY(0,4,1)+2,clrNONE,90);
   panel.DrawText("Close", panel.CellX(0,5,0)+2, panel.CellY(0,5,0)+2); panel.DrawText(DoubleToString(rates[0].close,Digits()),     panel.CellX(0,5,1)+2, panel.CellY(0,5,1)+2,clrNONE,90);

//--- Display the indicator data from the specified bar on the panel in table 1 (upper fractal)
   panel.DrawText(ind_title+" Up", panel.CellX(1,0,0)+2, panel.CellY(1,0,0)+2);
   double value0=IndicatorValue(handle,index,UPPER_LINE);
   string value_str0=(value0!=EMPTY_VALUE ? DoubleToString(value0,ind_digits) : " ");
   panel.DrawText(value_str0,panel.CellX(1,0,1)+2,panel.CellY(1,0,1)+2,clrNONE,90);

//--- Display the indicator data from the specified bar on the panel in table 1 (lower fractal)
   panel.DrawText(ind_title+" Down", panel.CellX(1,1,0)+2, panel.CellY(1,1,0)+2);
   double value1=IndicatorValue(handle,index,LOWER_LINE);
   string value_str1=(value1!=EMPTY_VALUE ? DoubleToString(value1,ind_digits) : " ");
   panel.DrawText(value_str1,panel.CellX(1,1,1)+2,panel.CellY(1,1,1)+2,clrNONE,90);

//--- Redraw the chart to immediately display all changes on the panel
   ChartRedraw(ChartID());
  }
Además, al utilizar un panel informativo, el manejador de eventos OnChartEvent() del asesor llamará al manejador de eventos del panel informativo y procesará los eventos para obtener el índice de la barra bajo el cursor:
//+------------------------------------------------------------------+
//| ChartEvent function                                              |
//+------------------------------------------------------------------+
void OnChartEvent(const int id,
                  const long &lparam,
                  const double &dparam,
                  const string &sparam)
  {
//--- Handling the panel
//--- Call the panel event handler
   panel.OnChartEvent(id,lparam,dparam,sparam);

//--- If the cursor moves or a click is made on the chart
   if(id==CHARTEVENT_MOUSE_MOVE || id==CHARTEVENT_CLICK)
     {
      //--- Declare the variables to record time and price coordinates in them
      datetime time=0;
      double price=0;
      int wnd=0;
      //--- If the cursor coordinates are converted to date and time
      if(ChartXYToTimePrice(ChartID(),(int)lparam,(int)dparam,wnd,time,price))
        {
         //--- write the bar index where the cursor is located to a global variable
         mouse_bar_index=iBarShift(Symbol(),PERIOD_CURRENT,time);
         //--- Display the bar data under the cursor on the panel
         DrawData(mouse_bar_index,time);
        }
     }

//--- If we received a custom event, display the appropriate message in the journal
   if(id>CHARTEVENT_CUSTOM)
     {
      //--- Here we can implement handling a click on the close button on the panel
      PrintFormat("%s: Event id=%ld, object id (lparam): %lu, event message (sparam): %s",__FUNCTION__,id,lparam,sparam);
     }
  }
Tras compilar y ejecutar el asesor en el gráfico, podremos controlar los valores de los búferes de indicador en el panel informativo:
Podrá ver el archivo del asesor de pruebas "TestWilliamsFractals.mq5" en los archivos adjuntos.
Gator Oscillator
Gator Oscillator se construye sobre la base de Alligator y muestra el grado de convergencia/divergencia de sus líneas de balance (media móvil suavizada). El histograma superior será la diferencia absoluta entre los valores de la línea azul y la línea roja. El histograma inferior será la diferencia absoluta entre los valores de la línea roja y la línea verde, pero con signo negativo porque el histograma se dibujará de arriba abajo.
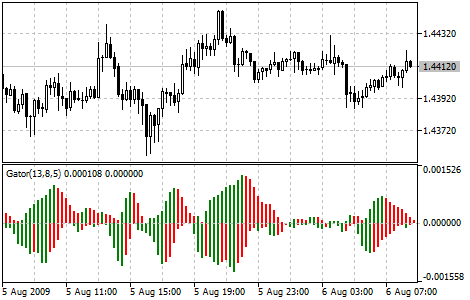
Parámetros
La función iGator() se utiliza para crear el manejador del indicador:
Retorna el manejador del indicador Gator. El oscilador mostrará la diferencia entre las líneas azul y roja de Alligator (histograma superior) y la diferencia entre las líneas roja y verde (histograma inferior).
int  iGator(
   string              symbol,            // symbol name
   ENUM_TIMEFRAMES     period,            // period
   int                 jaw_period,        // period for calculating jaws
   int                 jaw_shift,         // horizontal shift of jaws
   int                 teeth_period,      // period for calculating teeth
   int                 teeth_shift,       // teeth shift
   int                 lips_period,       // period for calculating lips
   int                 lips_shift,        // horizontal shift of lips
   ENUM_MA_METHOD      ma_method,         // smoothing type
   ENUM_APPLIED_PRICE  applied_price      // price type or handle
   );
symbol
[in] Nombre simbólico del instrumento sobre cuyos datos se calculará el indicador. NULL indicará el símbolo actual.
period
[in] El valor del periodo puede ser uno de los valores de la enumeración ENUM_TIMEFRAMES, 0 indicará el marco temporal actual.
jaw_period
[in] Periodo medio de la línea azul (mandíbulas del caimán).
jaw_shift
[in] Desplazamiento de la línea azul de Alligator con respecto al gráfico de precios. No se relaciona directamente con el desplazamiento visual del histograma del indicador.
teeth_period
[in] Periodo medio de la línea roja (dientes del caimán).
teeth_shift
[in] Desplazamiento de la línea roja de Alligator con respecto al gráfico de precios. No se relaciona directamente con el desplazamiento visual del histograma del indicador.
lips_period
[in] Periodo medio de la línea verde (labios del caimán).
lips_shift
[in] Desplazamiento de la línea verde de Alligator con respecto al gráfico de precios. No se relaciona directamente con el desplazamiento visual del histograma del indicador.
ma_method
[in] Método de promediado. Puede ser cualquiera de los valores ENUM_MA_METHOD.
applied_price
[in] Precio usado. Puede ser cualquiera de las constantes de precio ENUM_APPLIED_PRICE o el manejador de otro indicador.
Retorna el manejador del indicador técnico especificado, en caso de fallo retornará INVALID_HANDLE. Para liberar la memoria del ordenador de un indicador que ya no se utiliza, se utilizará la función IndicatorRelease(), a la que se le transmitirá el manejador de este indicador.
Números de los búferes: 0 - UPPER_HISTOGRAM, 1- búfer de color del histograma superior, 2 - LOWER_HISTOGRAM, 3- búfer de color del histograma inferior.
Para crear un indicador en el asesor, declararemos las variables de entrada y las variables globales:
//+------------------------------------------------------------------+
//|                                            TestWilliamsGator.mq5 |
//|                                  Copyright 2023, MetaQuotes Ltd. |
//|                                             https://www.mql5.com |
//+------------------------------------------------------------------+
#property copyright "Copyright 2023, MetaQuotes Ltd."
#property link      "https://www.mql5.com"
#property version   "1.00"
//--- enums
enum ENUM_LINE_STATE
  {
   LINE_STATE_NONE,        // Undefined state
   LINE_STATE_UP,          // Upward
   LINE_STATE_DOWN,        // Downward
   LINE_STATE_TURN_UP,     // Upward reversal
   LINE_STATE_TURN_DOWN,   // Downward reversal
   LINE_STATE_STOP_UP,     // Upward stop
   LINE_STATE_STOP_DOWN,   // Downward stop
   LINE_STATE_ABOVE,       // Above value
   LINE_STATE_UNDER,       // Below value
   LINE_STATE_CROSS_UP,    // Crossing value upwards
   LINE_STATE_CROSS_DOWN,  // Crossing value downwards
   LINE_STATE_TOUCH_BELOW, // Touching value from below
   LINE_STATE_TOUCH_ABOVE, // Touch value from above
   LINE_STATE_EQUALS,      // Equal to value
  };
//--- input parameters
input uint                 InpPeriodJaws  =  13;            /* Jaws Period    */
input int                  InpShiftJaws   =  8;             /* Jaws Shift     */
input uint                 InpPeriodTeeth =  8;             /* Teeth Period   */
input int                  InpShiftTeeth  =  5;             /* Teeth Shift    */
input uint                 InpPeriodLips  =  5;             /* Lips Period    */
input int                  InpShiftLips   =  3;             /* Lips Shift     */
input ENUM_MA_METHOD       InpMethod      =  MODE_SMMA;     /* Smoothed       */
input ENUM_APPLIED_PRICE   InpAppliedPrice=  PRICE_MEDIAN;  /* Applied Price  */
//--- global variables
int      handle=INVALID_HANDLE;  // Indicator handle
int      period_jaws=0;          // Jaws line calculation period
int      period_teeth=0;         // Teeth line calculation period
int      period_lips=0;          // Lips line calculation period
int      ind_digits=0;           // Number of decimal places in the indicator values
string   ind_title;              // Indicator description
Al utilizar el panel informativo en el asesor, también declararemos las variables globales para él y conectaremos el archivo de clases del panel:
//+------------------------------------------------------------------+
//|                                            TestWilliamsGator.mq5 |
//|                                  Copyright 2023, MetaQuotes Ltd. |
//|                                             https://www.mql5.com |
//+------------------------------------------------------------------+
#property copyright "Copyright 2023, MetaQuotes Ltd."
#property link      "https://www.mql5.com"
#property version   "1.00"
//--- includes
#include <Dashboard\Dashboard.mqh>
//--- enums
enum ENUM_LINE_STATE
  {
   LINE_STATE_NONE,        // Undefined state
   LINE_STATE_UP,          // Upward
   LINE_STATE_DOWN,        // Downward
   LINE_STATE_TURN_UP,     // Upward reversal
   LINE_STATE_TURN_DOWN,   // Downward reversal
   LINE_STATE_STOP_UP,     // Upward stop
   LINE_STATE_STOP_DOWN,   // Downward stop
   LINE_STATE_ABOVE,       // Above value
   LINE_STATE_UNDER,       // Below value
   LINE_STATE_CROSS_UP,    // Crossing value upwards
   LINE_STATE_CROSS_DOWN,  // Crossing value downwards
   LINE_STATE_TOUCH_BELOW, // Touching value from below
   LINE_STATE_TOUCH_ABOVE, // Touch value from above
   LINE_STATE_EQUALS,      // Equal to value
  };
//--- input parameters
input uint                 InpPeriodJaws  =  13;            /* Jaws Period    */
input int                  InpShiftJaws   =  8;             /* Jaws Shift     */
input uint                 InpPeriodTeeth =  8;             /* Teeth Period   */
input int                  InpShiftTeeth  =  5;             /* Teeth Shift    */
input uint                 InpPeriodLips  =  5;             /* Lips Period    */
input int                  InpShiftLips   =  3;             /* Lips Shift     */
input ENUM_MA_METHOD       InpMethod      =  MODE_SMMA;     /* Smoothed       */
input ENUM_APPLIED_PRICE   InpAppliedPrice=  PRICE_MEDIAN;  /* Applied Price  */
//--- global variables
int      handle=INVALID_HANDLE;  // Indicator handle
int      period_jaws=0;          // Jaws line calculation period
int      period_teeth=0;         // Teeth line calculation period
int      period_lips=0;          // Lips line calculation period
int      ind_digits=0;           // Number of decimal places in the indicator values
string   ind_title;              // Indicator description
//--- variables for the panel
int      mouse_bar_index;        // Index of the bar the data is taken from
CDashboard *panel=NULL;          // Pointer to the panel object
Inicialización
Establecimiento de los valores de las variables globales para el indicador y creación de su manejador:
//+------------------------------------------------------------------+
//| Expert initialization function                                   |
//+------------------------------------------------------------------+
int OnInit()
  {
//--- create timer
   EventSetTimer(60);

//--- Indicator
//--- Set and adjust the calculation period if necessary
   period_jaws=int(InpPeriodJaws<1 ? 13 : InpPeriodJaws);
   period_teeth=int(InpPeriodTeeth<1 ? 8 : InpPeriodTeeth);
   period_lips=int(InpPeriodLips<1 ? 5 : InpPeriodLips);
//--- Set the indicator name and the number of decimal places
   ind_title=StringFormat("Gator(%lu,%lu,%lu)",period_jaws,period_teeth,period_lips);
   ind_digits=Digits()+1;
//--- Create indicator handle
   ResetLastError();
   handle=iGator(Symbol(),PERIOD_CURRENT,period_jaws,InpShiftJaws,period_teeth,InpShiftTeeth,period_lips,InpShiftLips,InpMethod,InpAppliedPrice);
   if(handle==INVALID_HANDLE)
     {
      PrintFormat("%s: Failed to create indicator handle %s. Error %ld",__FUNCTION__,ind_title,GetLastError());
      return INIT_FAILED;
     }

//--- Successful initialization
   return(INIT_SUCCEEDED);
  }
Al utilizar un panel informativo en el asesor, crearemos un panel:
//+------------------------------------------------------------------+
//| Expert initialization function                                   |
//+------------------------------------------------------------------+
int OnInit()
  {
//--- create timer
   EventSetTimer(60);

//--- Indicator
//--- Set and adjust the calculation period if necessary
   period_jaws=int(InpPeriodJaws<1 ? 13 : InpPeriodJaws);
   period_teeth=int(InpPeriodTeeth<1 ? 8 : InpPeriodTeeth);
   period_lips=int(InpPeriodLips<1 ? 5 : InpPeriodLips);
//--- Set the indicator name and the number of decimal places
   ind_title=StringFormat("Gator(%lu,%lu,%lu)",period_jaws,period_teeth,period_lips);
   ind_digits=Digits()+1;
//--- Create indicator handle
   ResetLastError();
   handle=iGator(Symbol(),PERIOD_CURRENT,period_jaws,InpShiftJaws,period_teeth,InpShiftTeeth,period_lips,InpShiftLips,InpMethod,InpAppliedPrice);
   if(handle==INVALID_HANDLE)
     {
      PrintFormat("%s: Failed to create indicator handle %s. Error %ld",__FUNCTION__,ind_title,GetLastError());
      return INIT_FAILED;
     }

//--- Dashboard
//--- Create the panel
   panel=new CDashboard(1,20,20,229,225);
   if(panel==NULL)
     {
      Print("Error. Failed to create panel object");
      return INIT_FAILED;
     }
//--- Set font parameters
   panel.SetFontParams("Calibri",9);
//--- Display the panel with the "Symbol, Timeframe description" header text
   panel.View(Symbol()+", "+StringSubstr(EnumToString(Period()),7));
//--- Create a table with ID 0 to display bar data in it
   panel.CreateNewTable(0);
//--- Draw a table with ID 0 on the panel background
   panel.DrawGrid(0,2,20,6,2,18,112);

//--- Create a table with ID 1 to display indicator data in it
   panel.CreateNewTable(1);
//--- Get the Y2 table coordinate with ID 0 and
//--- set the Y1 coordinate for the table with ID 1
   int y1=panel.TableY2(0)+22;
//--- Draw a table with ID 1 on the panel background
   panel.DrawGrid(1,2,y1,3,2,18,112);

//--- Display tabular data in the journal
   panel.GridPrint(0,2);
   panel.GridPrint(1,2);
//--- Initialize the variable with the index of the mouse cursor bar
   mouse_bar_index=0;
//--- Display the data of the current bar on the panel
   DrawData(mouse_bar_index,TimeCurrent());

//--- Successful initialization
   return(INIT_SUCCEEDED);
  }
Desinicialización
En el manejador OnDeinit() del asesor liberaremos el manejador del indicador:
//+------------------------------------------------------------------+
//| Expert deinitialization function                                 |
//+------------------------------------------------------------------+
void OnDeinit(const int reason)
  {
//--- destroy timer
   EventKillTimer();

//--- Release handle of the indicator
   ResetLastError();
   if(!IndicatorRelease(handle))
      PrintFormat("%s: IndicatorRelease failed. Error %ld",__FUNCTION__,GetLastError());
//--- Clear all comments on the chart
   Comment("");
  }
Al utilizar un panel informativo, eliminaremos el objeto de panel creado:
//+------------------------------------------------------------------+
//| Expert deinitialization function                                 |
//+------------------------------------------------------------------+
void OnDeinit(const int reason)
  {
//--- destroy timer
   EventKillTimer();

//--- Release handle of the indicator
   ResetLastError();
   if(!IndicatorRelease(handle))
      PrintFormat("%s: IndicatorRelease failed. Error %ld",__FUNCTION__,GetLastError());
//--- Clear all comments on the chart
   Comment("");

//--- If the panel object exists, delete it
   if(panel!=NULL)
      delete panel;
  }
Obtención de datos
A continuación se presentarán las funciones generales de la obtención de datos usando el manejador del indicador. Ya analizamos dichas funciones en el artículo sobre la conexión de osciladores en asesores. Podrá utilizar las funciones presentadas "tal cual" en sus programas:
//+------------------------------------------------------------------+
//| Return the indicator data on the specified bar                   |
//+------------------------------------------------------------------+
double IndicatorValue(const int ind_handle,const int index,const int buffer_num)
  {
   double array[1]={0};
   ResetLastError();
   if(CopyBuffer(ind_handle,buffer_num,index,1,array)!=1)
     {
      PrintFormat("%s: CopyBuffer failed. Error %ld",__FUNCTION__,GetLastError());
      return EMPTY_VALUE;
     }
   return array[0];
  }
//+------------------------------------------------------------------+
//| Return the state of the indicator line                           |
//+------------------------------------------------------------------+
ENUM_LINE_STATE LineState(const int ind_handle,const int index,const int buffer_num)
  {
//--- Get the values of the indicator line with the shift (0,1,2) relative to the passed index
   const double value0=IndicatorValue(ind_handle,index,  buffer_num);
   const double value1=IndicatorValue(ind_handle,index+1,buffer_num);
   const double value2=IndicatorValue(ind_handle,index+2,buffer_num);
//--- If at least one of the values could not be obtained, return an undefined value
   if(value0==EMPTY_VALUE || value1==EMPTY_VALUE || value2==EMPTY_VALUE)
      return LINE_STATE_NONE;
//--- Line upward reversal (value2>value1 && value0>value1)
   if(NormalizeDouble(value2-value1,ind_digits)>0 && NormalizeDouble(value0-value1,ind_digits)>0)
      return LINE_STATE_TURN_UP;
//--- Line upward direction (value2<=value1 && value0>value1)
   else if(NormalizeDouble(value2-value1,ind_digits)<=0 && NormalizeDouble(value0-value1,ind_digits)>0)
      return LINE_STATE_UP;
//--- Line upward stop (value2<=value1 && value0==value1)
   else if(NormalizeDouble(value2-value1,ind_digits)<=0 && NormalizeDouble(value0-value1,ind_digits)==0)
      return LINE_STATE_STOP_UP;
//--- Line downward reversal (value2<value1 && value0<value1)
   if(NormalizeDouble(value2-value1,ind_digits)<0 && NormalizeDouble(value0-value1,ind_digits)<0)
      return LINE_STATE_TURN_DOWN;
//--- Line downward direction (value2>=value1 && value0<value1)
   else if(NormalizeDouble(value2-value1,ind_digits)>=0 && NormalizeDouble(value0-value1,ind_digits)<0)
      return LINE_STATE_DOWN;
//--- Line downward stop (value2>=value1 && value0==value1)
   else if(NormalizeDouble(value2-value1,ind_digits)>=0 && NormalizeDouble(value0-value1,ind_digits)==0)
      return LINE_STATE_STOP_DOWN;
//--- Undefined state
   return LINE_STATE_NONE;
  }
//+------------------------------------------------------------------+
//| Return the state of the line relative to the specified level     |
//+------------------------------------------------------------------+
ENUM_LINE_STATE LineStateRelative(const int ind_handle,const int index,const int buffer_num,const double level0,const double level1=EMPTY_VALUE)
  {
//--- Get the values of the indicator line with the shift (0,1) relative to the passed index
   const double value0=IndicatorValue(ind_handle,index,  buffer_num);
   const double value1=IndicatorValue(ind_handle,index+1,buffer_num);
//--- If at least one of the values could not be obtained, return an undefined value
   if(value0==EMPTY_VALUE || value1==EMPTY_VALUE)
      return LINE_STATE_NONE;
//--- Define the second level to compare
   double level=(level1==EMPTY_VALUE ? level0 : level1);
//--- The line is below the level (value1<level && value0<level0)
   if(NormalizeDouble(value1-level,ind_digits)<0 && NormalizeDouble(value0-level0,ind_digits)<0)
      return LINE_STATE_UNDER;
//--- The line is above the level (value1>level && value0>level0)
   if(NormalizeDouble(value1-level,ind_digits)>0 && NormalizeDouble(value0-level0,ind_digits)>0)
      return LINE_STATE_ABOVE;
//--- The line crossed the level upwards (value1<=level && value0>level0)
   if(NormalizeDouble(value1-level,ind_digits)<=0 && NormalizeDouble(value0-level0,ind_digits)>0)
      return LINE_STATE_CROSS_UP;
//--- The line crossed the level downwards (value1>=level && value0<level0)
   if(NormalizeDouble(value1-level,ind_digits)>=0 && NormalizeDouble(value0-level0,ind_digits)<0)
      return LINE_STATE_CROSS_DOWN;
//--- The line touched the level from below (value1<level0 && value0==level0)
   if(NormalizeDouble(value1-level,ind_digits)<0 && NormalizeDouble(value0-level0,ind_digits)==0)
      return LINE_STATE_TOUCH_BELOW;
//--- The line touched the level from above (value1>level0 && value0==level0)
   if(NormalizeDouble(value1-level,ind_digits)>0 && NormalizeDouble(value0-level0,ind_digits)==0)
      return LINE_STATE_TOUCH_BELOW;
//--- Line is equal to the level value (value1==level0 && value0==level0)
   if(NormalizeDouble(value1-level,ind_digits)==0 && NormalizeDouble(value0-level0,ind_digits)==0)
      return LINE_STATE_EQUALS;
//--- Undefined state
   return LINE_STATE_NONE;
  }
//+------------------------------------------------------------------+
//| Return the indicator line state description                      |
//+------------------------------------------------------------------+
string LineStateDescription(const ENUM_LINE_STATE state)
  {
   switch(state)
     {
      case LINE_STATE_UP         :  return "Up";
      case LINE_STATE_STOP_UP    :  return "Stop Up";
      case LINE_STATE_TURN_UP    :  return "Turn Up";
      case LINE_STATE_DOWN       :  return "Down";
      case LINE_STATE_STOP_DOWN  :  return "Stop Down";
      case LINE_STATE_TURN_DOWN  :  return "Turn Down";
      case LINE_STATE_ABOVE      :  return "Above level";
      case LINE_STATE_UNDER      :  return "Under level";
      case LINE_STATE_CROSS_UP   :  return "Crossing Up";
      case LINE_STATE_CROSS_DOWN :  return "Crossing Down";
      case LINE_STATE_TOUCH_BELOW:  return "Touch from Below";
      case LINE_STATE_TOUCH_ABOVE:  return "Touch from Above";
      case LINE_STATE_EQUALS     :  return "Equals";
      default                    :  return "Unknown";
     }
  }
Al utilizar el panel informativo, los datos se mostrarán en el panel utilizando la función:
//+------------------------------------------------------------------+
//| Display data from the specified timeseries index to the panel    |
//+------------------------------------------------------------------+
void DrawData(const int index,const datetime time)
  {
//--- Declare the variables to receive data in them
   MqlTick  tick={0};
   MqlRates rates[1];

//--- Exit if unable to get the current prices
   if(!SymbolInfoTick(Symbol(),tick))
      return;
//--- Exit if unable to get the bar data by the specified index
   if(CopyRates(Symbol(),PERIOD_CURRENT,index,1,rates)!=1)
      return;

//--- Set font parameters for bar and indicator data headers
   int  size=0;
   uint flags=0;
   uint angle=0;
   string name=panel.FontParams(size,flags,angle);
   panel.SetFontParams(name,9,FW_BOLD);
   panel.DrawText("Bar data ["+(string)index+"]",3,panel.TableY1(0)-16,clrMaroon,panel.Width()-6);
   panel.DrawText("Indicator data ["+(string)index+"]",3,panel.TableY1(1)-16,clrGreen,panel.Width()-6);
//--- Set font parameters for bar and indicator data
   panel.SetFontParams(name,9);

//--- Display the data of the specified bar in table 0 on the panel
   panel.DrawText("Date",  panel.CellX(0,0,0)+2, panel.CellY(0,0,0)+2); panel.DrawText(TimeToString(  rates[0].time,TIME_DATE),     panel.CellX(0,0,1)+2, panel.CellY(0,0,1)+2,clrNONE,90);
   panel.DrawText("Time",  panel.CellX(0,1,0)+2, panel.CellY(0,1,0)+2); panel.DrawText(TimeToString(  rates[0].time,TIME_MINUTES),  panel.CellX(0,1,1)+2, panel.CellY(0,1,1)+2,clrNONE,90);
   panel.DrawText("Open",  panel.CellX(0,2,0)+2, panel.CellY(0,2,0)+2); panel.DrawText(DoubleToString(rates[0].open,Digits()),      panel.CellX(0,2,1)+2, panel.CellY(0,2,1)+2,clrNONE,90);
   panel.DrawText("High",  panel.CellX(0,3,0)+2, panel.CellY(0,3,0)+2); panel.DrawText(DoubleToString(rates[0].high,Digits()),      panel.CellX(0,3,1)+2, panel.CellY(0,3,1)+2,clrNONE,90);
   panel.DrawText("Low",   panel.CellX(0,4,0)+2, panel.CellY(0,4,0)+2); panel.DrawText(DoubleToString(rates[0].low,Digits()),       panel.CellX(0,4,1)+2, panel.CellY(0,4,1)+2,clrNONE,90);
   panel.DrawText("Close", panel.CellX(0,5,0)+2, panel.CellY(0,5,0)+2); panel.DrawText(DoubleToString(rates[0].close,Digits()),     panel.CellX(0,5,1)+2, panel.CellY(0,5,1)+2,clrNONE,90);

//--- Get the indicator buffers data
   double value0=IndicatorValue(handle,index,UPPER_HISTOGRAM); // Upper histogram
   double value1=IndicatorValue(handle,index,1);               // Upper histogram color buffer
   double value2=IndicatorValue(handle,index,LOWER_HISTOGRAM); // Lower histogram
   double value3=IndicatorValue(handle,index,3);               // Lower histogram color buffer
   color clr=clrNONE;
//--- Display the upper histogram data from the specified bar on the panel in table 1
   panel.DrawText(ind_title+" Up", panel.CellX(1,0,0)+2, panel.CellY(1,0,0)+2);
   string value_str=(value0!=EMPTY_VALUE ? DoubleToString(value0,ind_digits) : "");
   clr=(value1>0 ? clrRed : clrGreen);
   panel.DrawText(value_str,panel.CellX(1,0,1)+2,panel.CellY(1,0,1)+2,clr,100);

//--- Display the lower histogram data from the specified bar on the panel in table 1
   panel.DrawText(ind_title+" Down", panel.CellX(1,1,0)+2, panel.CellY(1,1,0)+2);
   value_str=(value2!=EMPTY_VALUE ? DoubleToString(value2,ind_digits) : "");
   clr=(value3>0 ? clrRed : clrGreen);
   panel.DrawText(value_str,panel.CellX(1,1,1)+2,panel.CellY(1,1,1)+2,clr,100);

//--- Redraw the chart to immediately display all changes on the panel
   ChartRedraw(ChartID());
  }
El color del texto que describe los valores del búfer de indicador tendrá el mismo color que la columna correspondiente del histograma del indicador.
Además, al utilizar un panel informativo, el manejador de eventos OnChartEvent() del asesor llamará al manejador de eventos del panel informativo y procesará los eventos para obtener el índice de la barra bajo el cursor:
//+------------------------------------------------------------------+
//| ChartEvent function                                              |
//+------------------------------------------------------------------+
void OnChartEvent(const int id,
                  const long &lparam,
                  const double &dparam,
                  const string &sparam)
  {
//--- Handling the panel
//--- Call the panel event handler
   panel.OnChartEvent(id,lparam,dparam,sparam);

//--- If the cursor moves or a click is made on the chart
   if(id==CHARTEVENT_MOUSE_MOVE || id==CHARTEVENT_CLICK)
     {
      //--- Declare the variables to record time and price coordinates in them
      datetime time=0;
      double price=0;
      int wnd=0;
      //--- If the cursor coordinates are converted to date and time
      if(ChartXYToTimePrice(ChartID(),(int)lparam,(int)dparam,wnd,time,price))
        {
         //--- write the bar index where the cursor is located to a global variable
         mouse_bar_index=iBarShift(Symbol(),PERIOD_CURRENT,time);
         //--- Display the bar data under the cursor on the panel
         DrawData(mouse_bar_index,time);
        }
     }

//--- If we received a custom event, display the appropriate message in the journal
   if(id>CHARTEVENT_CUSTOM)
     {
      //--- Here we can implement handling a click on the close button on the panel
      PrintFormat("%s: Event id=%ld, object id (lparam): %lu, event message (sparam): %s",__FUNCTION__,id,lparam,sparam);
     }
  }
Tras compilar y ejecutar el asesor en el gráfico, podremos controlar el valor y el estado de la línea de indicador en el panel informativo:
Podrá ver el archivo del asesor de pruebas "TestWilliamsGator.mq5" en los archivos adjuntos.
Market Facilitation Index
El indicador técnico Índice de Facilitación del Mercado (Market Facilitation Index, BW MFI) muestra el cambio de los precios por ticks. Los valores absolutos del indicador no significarán nada por sí mismos, solo los cambios en el indicador tendrán significado. Bill Williams concede gran importancia a los cambios del indicador y el volumen:
- El indicador BW MFI ha aumentado, y el volumen también, esto indicará que: a) cada vez entran más tráders en el mercado (el volumen está creciendo), b) los tráders recién llegados están abriendo posiciones en la dirección de desarrollo de la barra, es decir, el movimiento ha comenzado y está ganando velocidad.
- El BW MFI ha descendido, y el volumen también: esto sugerirá una pérdida de interés entre los participantes del mercado.
- El BW MFI ha subido, pero el volumen ha descendido: esto indicará que el mercado no se sostiene en el volumen de los tráders, y el precio cambia debido a la especulación de los tráders "en el parqué" (intermediarios - brókeres y dealers).
- El BW MFI ha descendido, pero el volumen ha ascendido: esto indicará que hay una batalla de toros y osos, con muchas compras y ventas, pero poco movimiento en el precio en sí debido a fuerzas más o menos iguales. Uno de los dos bandos enfrentados (compradores y vendedores) ganará. Por lo general, la ruptura de una barra de este tipo nos permitirá saber si esta barra determina la continuación de la tendencia o si ésta queda anulada por ella. Bill Williams llama a este tipo de barra de "sentadilla".
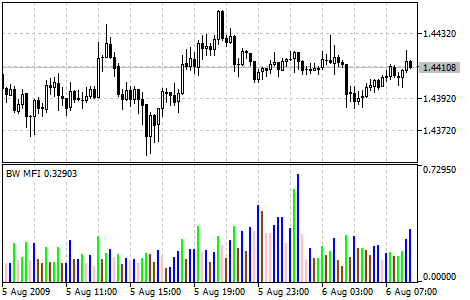
Parámetros
La función iBWMFI() se utiliza para crear el manejador del indicador:
Retorna el manejador del indicador Market Facilitation Index. Solo un búfer.
int  iBWMFI(
   string               symbol,             // symbol name
   ENUM_TIMEFRAMES      period,             // period
   ENUM_APPLIED_VOLUME  applied_volume      // type of volume used for calculations
   );
symbol
[in] Nombre simbólico del instrumento sobre cuyos datos se calculará el indicador. NULL indicará el símbolo actual.
period
[in] El valor del periodo puede ser uno de los valores de la enumeración ENUM_TIMEFRAMES, 0 indicará el marco temporal actual.
applied_volume
[in] Volumen usado. Puede ser cualquiera de los valores de la enumeración ENUM_APPLIED_VOLUME.
Retorna el manejador del indicador técnico especificado, en caso de fallo retornará INVALID_HANDLE. Para liberar la memoria del ordenador de un indicador que ya no se utiliza, se utilizará la función IndicatorRelease(), a la que se le transmitirá el manejador de este indicador.
Para crear un indicador en el asesor, declararemos las variables de entrada y las variables globales:
//+------------------------------------------------------------------+
//|                                            TestWilliamsBWMFI.mq5 |
//|                                  Copyright 2023, MetaQuotes Ltd. |
//|                                             https://www.mql5.com |
//+------------------------------------------------------------------+
#property copyright "Copyright 2023, MetaQuotes Ltd."
#property link      "https://www.mql5.com"
#property version   "1.00"
//--- enums
enum ENUM_LINE_STATE
  {
   LINE_STATE_NONE,        // Undefined state
   LINE_STATE_UP,          // Upward
   LINE_STATE_DOWN,        // Downward
   LINE_STATE_TURN_UP,     // Upward reversal
   LINE_STATE_TURN_DOWN,   // Downward reversal
   LINE_STATE_STOP_UP,     // Upward stop
   LINE_STATE_STOP_DOWN,   // Downward stop
   LINE_STATE_ABOVE,       // Above value
   LINE_STATE_UNDER,       // Below value
   LINE_STATE_CROSS_UP,    // Crossing value upwards
   LINE_STATE_CROSS_DOWN,  // Crossing value downwards
   LINE_STATE_TOUCH_BELOW, // Touching value from below
   LINE_STATE_TOUCH_ABOVE, // Touch value from above
   LINE_STATE_EQUALS,      // Equal to value
  };
//--- input parameters
input ENUM_APPLIED_VOLUME  InpVolume   =  VOLUME_TICK;   /* Applied Volume */
//--- global variables
int      handle=INVALID_HANDLE;  // Indicator handle
int      ind_digits=0;           // Number of decimal places in the indicator values
string   ind_title;              // Indicator description
Al utilizar el panel informativo en el asesor, también declararemos las variables globales para él y conectaremos el archivo de clases del panel:
//+------------------------------------------------------------------+
//|                                            TestWilliamsBWMFI.mq5 |
//|                                  Copyright 2023, MetaQuotes Ltd. |
//|                                             https://www.mql5.com |
//+------------------------------------------------------------------+
#property copyright "Copyright 2023, MetaQuotes Ltd."
#property link      "https://www.mql5.com"
#property version   "1.00"
//--- includes
#include <Dashboard\Dashboard.mqh>
//--- enums
enum ENUM_LINE_STATE
  {
   LINE_STATE_NONE,        // Undefined state
   LINE_STATE_UP,          // Upward
   LINE_STATE_DOWN,        // Downward
   LINE_STATE_TURN_UP,     // Upward reversal
   LINE_STATE_TURN_DOWN,   // Downward reversal
   LINE_STATE_STOP_UP,     // Upward stop
   LINE_STATE_STOP_DOWN,   // Downward stop
   LINE_STATE_ABOVE,       // Above value
   LINE_STATE_UNDER,       // Below value
   LINE_STATE_CROSS_UP,    // Crossing value upwards
   LINE_STATE_CROSS_DOWN,  // Crossing value downwards
   LINE_STATE_TOUCH_BELOW, // Touching value from below
   LINE_STATE_TOUCH_ABOVE, // Touch value from above
   LINE_STATE_EQUALS,      // Equal to value
  };
//--- input parameters
input ENUM_APPLIED_VOLUME  InpVolume   =  VOLUME_TICK;   /* Applied Volume */
//--- global variables
int      handle=INVALID_HANDLE;  // Indicator handle
int      ind_digits=0;           // Number of decimal places in the indicator values
string   ind_title;              // Indicator description
//--- variables for the panel
int      mouse_bar_index;        // Index of the bar the data is taken from
CDashboard *panel=NULL;          // Pointer to the panel object
Inicialización
Establecimiento de los valores de las variables globales para el indicador y creación de su manejador:
//+------------------------------------------------------------------+
//| Expert initialization function                                   |
//+------------------------------------------------------------------+
int OnInit()
  {
//--- create timer
   EventSetTimer(60);

//--- Indicator
//--- Set the indicator name and the number of decimal places
   ind_title="BW MFI";
   ind_digits=Digits();
//--- Create indicator handle
   ResetLastError();
   handle=iBWMFI(Symbol(),PERIOD_CURRENT,InpVolume);
   if(handle==INVALID_HANDLE)
     {
      PrintFormat("%s: Failed to create indicator handle %s. Error %ld",__FUNCTION__,ind_title,GetLastError());
      return INIT_FAILED;
     }

//--- Successful initialization
   return(INIT_SUCCEEDED);
  }
Al utilizar un panel informativo en el asesor, crearemos un panel:
//+------------------------------------------------------------------+
//| Expert initialization function                                   |
//+------------------------------------------------------------------+
int OnInit()
  {
//--- create timer
   EventSetTimer(60);

//--- Indicator
//--- Set the indicator name and the number of decimal places
   ind_title="BW MFI";
   ind_digits=Digits();
//--- Create indicator handle
   ResetLastError();
   handle=iBWMFI(Symbol(),PERIOD_CURRENT,InpVolume);
   if(handle==INVALID_HANDLE)
     {
      PrintFormat("%s: Failed to create indicator handle %s. Error %ld",__FUNCTION__,ind_title,GetLastError());
      return INIT_FAILED;
     }

//--- Dashboard
//--- Create the panel
   panel=new CDashboard(1,20,20,199,225);
   if(panel==NULL)
     {
      Print("Error. Failed to create panel object");
      return INIT_FAILED;
     }
//--- Set font parameters
   panel.SetFontParams("Calibri",9);
//--- Display the panel with the "Symbol, Timeframe description" header text
   panel.View(Symbol()+", "+StringSubstr(EnumToString(Period()),7));
//--- Create a table with ID 0 to display bar data in it
   panel.CreateNewTable(0);
//--- Draw a table with ID 0 on the panel background
   panel.DrawGrid(0,2,20,6,2,18,97);

//--- Create a table with ID 1 to display indicator data in it
   panel.CreateNewTable(1);
//--- Get the Y2 table coordinate with ID 0 and
//--- set the Y1 coordinate for the table with ID 1
   int y1=panel.TableY2(0)+22;
//--- Draw a table with ID 1 on the panel background
   panel.DrawGrid(1,2,y1,3,2,18,97);

//--- Display tabular data in the journal
   panel.GridPrint(0,2);
   panel.GridPrint(1,2);
//--- Initialize the variable with the index of the mouse cursor bar
   mouse_bar_index=0;
//--- Display the data of the current bar on the panel
   DrawData(mouse_bar_index,TimeCurrent());

//--- Successful initialization
   return(INIT_SUCCEEDED);
  }
Desinicialización
En el manejador OnDeinit() del asesor liberaremos el manejador del indicador:
//+------------------------------------------------------------------+
//| Expert deinitialization function                                 |
//+------------------------------------------------------------------+
void OnDeinit(const int reason)
  {
//--- destroy timer
   EventKillTimer();

//--- Release handle of the indicator
   ResetLastError();
   if(!IndicatorRelease(handle))
      PrintFormat("%s: IndicatorRelease failed. Error %ld",__FUNCTION__,GetLastError());
//--- Clear all comments on the chart
   Comment("");
  }
Al utilizar un panel informativo, eliminaremos el objeto de panel creado:
//+------------------------------------------------------------------+
//| Expert deinitialization function                                 |
//+------------------------------------------------------------------+
void OnDeinit(const int reason)
  {
//--- destroy timer
   EventKillTimer();

//--- Release handle of the indicator
   ResetLastError();
   if(!IndicatorRelease(handle))
      PrintFormat("%s: IndicatorRelease failed. Error %ld",__FUNCTION__,GetLastError());
//--- Clear all comments on the chart
   Comment("");

//--- If the panel object exists, delete it
   if(panel!=NULL)
      delete panel;
  }
Obtención de datos
A continuación se presentarán las funciones generales de la obtención de datos usando el manejador del indicador. Ya analizamos dichas funciones en el artículo sobre la conexión de osciladores en asesores. Podrá utilizar las funciones presentadas "tal cual" en sus programas:
//+------------------------------------------------------------------+
//| Return the indicator data on the specified bar                   |
//+------------------------------------------------------------------+
double IndicatorValue(const int ind_handle,const int index,const int buffer_num)
  {
   double array[1]={0};
   ResetLastError();
   if(CopyBuffer(ind_handle,buffer_num,index,1,array)!=1)
     {
      PrintFormat("%s: CopyBuffer failed. Error %ld",__FUNCTION__,GetLastError());
      return EMPTY_VALUE;
     }
   return array[0];
  }
//+------------------------------------------------------------------+
//| Return the state of the indicator line                           |
//+------------------------------------------------------------------+
ENUM_LINE_STATE LineState(const int ind_handle,const int index,const int buffer_num)
  {
//--- Get the values of the indicator line with the shift (0,1,2) relative to the passed index
   const double value0=IndicatorValue(ind_handle,index,  buffer_num);
   const double value1=IndicatorValue(ind_handle,index+1,buffer_num);
   const double value2=IndicatorValue(ind_handle,index+2,buffer_num);
//--- If at least one of the values could not be obtained, return an undefined value
   if(value0==EMPTY_VALUE || value1==EMPTY_VALUE || value2==EMPTY_VALUE)
      return LINE_STATE_NONE;
//--- Line upward reversal (value2>value1 && value0>value1)
   if(NormalizeDouble(value2-value1,ind_digits)>0 && NormalizeDouble(value0-value1,ind_digits)>0)
      return LINE_STATE_TURN_UP;
//--- Line upward direction (value2<=value1 && value0>value1)
   else if(NormalizeDouble(value2-value1,ind_digits)<=0 && NormalizeDouble(value0-value1,ind_digits)>0)
      return LINE_STATE_UP;
//--- Line upward stop (value2<=value1 && value0==value1)
   else if(NormalizeDouble(value2-value1,ind_digits)<=0 && NormalizeDouble(value0-value1,ind_digits)==0)
      return LINE_STATE_STOP_UP;
//--- Line downward reversal (value2<value1 && value0<value1)
   if(NormalizeDouble(value2-value1,ind_digits)<0 && NormalizeDouble(value0-value1,ind_digits)<0)
      return LINE_STATE_TURN_DOWN;
//--- Line downward direction (value2>=value1 && value0<value1)
   else if(NormalizeDouble(value2-value1,ind_digits)>=0 && NormalizeDouble(value0-value1,ind_digits)<0)
      return LINE_STATE_DOWN;
//--- Line downward stop (value2>=value1 && value0==value1)
   else if(NormalizeDouble(value2-value1,ind_digits)>=0 && NormalizeDouble(value0-value1,ind_digits)==0)
      return LINE_STATE_STOP_DOWN;
//--- Undefined state
   return LINE_STATE_NONE;
  }
//+------------------------------------------------------------------+
//| Return the state of the line relative to the specified level     |
//+------------------------------------------------------------------+
ENUM_LINE_STATE LineStateRelative(const int ind_handle,const int index,const int buffer_num,const double level0,const double level1=EMPTY_VALUE)
  {
//--- Get the values of the indicator line with the shift (0,1) relative to the passed index
   const double value0=IndicatorValue(ind_handle,index,  buffer_num);
   const double value1=IndicatorValue(ind_handle,index+1,buffer_num);
//--- If at least one of the values could not be obtained, return an undefined value
   if(value0==EMPTY_VALUE || value1==EMPTY_VALUE)
      return LINE_STATE_NONE;
//--- Define the second level to compare
   double level=(level1==EMPTY_VALUE ? level0 : level1);
//--- The line is below the level (value1<level && value0<level0)
   if(NormalizeDouble(value1-level,ind_digits)<0 && NormalizeDouble(value0-level0,ind_digits)<0)
      return LINE_STATE_UNDER;
//--- The line is above the level (value1>level && value0>level0)
   if(NormalizeDouble(value1-level,ind_digits)>0 && NormalizeDouble(value0-level0,ind_digits)>0)
      return LINE_STATE_ABOVE;
//--- The line crossed the level upwards (value1<=level && value0>level0)
   if(NormalizeDouble(value1-level,ind_digits)<=0 && NormalizeDouble(value0-level0,ind_digits)>0)
      return LINE_STATE_CROSS_UP;
//--- The line crossed the level downwards (value1>=level && value0<level0)
   if(NormalizeDouble(value1-level,ind_digits)>=0 && NormalizeDouble(value0-level0,ind_digits)<0)
      return LINE_STATE_CROSS_DOWN;
//--- The line touched the level from below (value1<level0 && value0==level0)
   if(NormalizeDouble(value1-level,ind_digits)<0 && NormalizeDouble(value0-level0,ind_digits)==0)
      return LINE_STATE_TOUCH_BELOW;
//--- The line touched the level from above (value1>level0 && value0==level0)
   if(NormalizeDouble(value1-level,ind_digits)>0 && NormalizeDouble(value0-level0,ind_digits)==0)
      return LINE_STATE_TOUCH_BELOW;
//--- Line is equal to the level value (value1==level0 && value0==level0)
   if(NormalizeDouble(value1-level,ind_digits)==0 && NormalizeDouble(value0-level0,ind_digits)==0)
      return LINE_STATE_EQUALS;
//--- Undefined state
   return LINE_STATE_NONE;
  }
//+------------------------------------------------------------------+
//| Return the indicator line state description                      |
//+------------------------------------------------------------------+
string LineStateDescription(const ENUM_LINE_STATE state)
  {
   switch(state)
     {
      case LINE_STATE_UP         :  return "Up";
      case LINE_STATE_STOP_UP    :  return "Stop Up";
      case LINE_STATE_TURN_UP    :  return "Turn Up";
      case LINE_STATE_DOWN       :  return "Down";
      case LINE_STATE_STOP_DOWN  :  return "Stop Down";
      case LINE_STATE_TURN_DOWN  :  return "Turn Down";
      case LINE_STATE_ABOVE      :  return "Above level";
      case LINE_STATE_UNDER      :  return "Under level";
      case LINE_STATE_CROSS_UP   :  return "Crossing Up";
      case LINE_STATE_CROSS_DOWN :  return "Crossing Down";
      case LINE_STATE_TOUCH_BELOW:  return "Touch from Below";
      case LINE_STATE_TOUCH_ABOVE:  return "Touch from Above";
      case LINE_STATE_EQUALS     :  return "Equals";
      default                    :  return "Unknown";
     }
  }
Al utilizar el panel informativo, los datos se mostrarán en el panel utilizando la función:
//+------------------------------------------------------------------+
//| Display data from the specified timeseries index to the panel    |
//+------------------------------------------------------------------+
void DrawData(const int index,const datetime time)
  {
//--- Declare the variables to receive data in them
   MqlTick  tick={0};
   MqlRates rates[1];

//--- Exit if unable to get the current prices
   if(!SymbolInfoTick(Symbol(),tick))
      return;
//--- Exit if unable to get the bar data by the specified index
   if(CopyRates(Symbol(),PERIOD_CURRENT,index,1,rates)!=1)
      return;

//--- Set font parameters for bar and indicator data headers
   int  size=0;
   uint flags=0;
   uint angle=0;
   string name=panel.FontParams(size,flags,angle);
   panel.SetFontParams(name,9,FW_BOLD);
   panel.DrawText("Bar data ["+(string)index+"]",3,panel.TableY1(0)-16,clrMaroon,panel.Width()-6);
   panel.DrawText("Indicator data ["+(string)index+"]",3,panel.TableY1(1)-16,clrGreen,panel.Width()-6);
//--- Set font parameters for bar and indicator data
   panel.SetFontParams(name,9);

//--- Display the data of the specified bar in table 0 on the panel
   panel.DrawText("Date",  panel.CellX(0,0,0)+2, panel.CellY(0,0,0)+2); panel.DrawText(TimeToString(  rates[0].time,TIME_DATE),     panel.CellX(0,0,1)+2, panel.CellY(0,0,1)+2,clrNONE,90);
   panel.DrawText("Time",  panel.CellX(0,1,0)+2, panel.CellY(0,1,0)+2); panel.DrawText(TimeToString(  rates[0].time,TIME_MINUTES),  panel.CellX(0,1,1)+2, panel.CellY(0,1,1)+2,clrNONE,90);
   panel.DrawText("Open",  panel.CellX(0,2,0)+2, panel.CellY(0,2,0)+2); panel.DrawText(DoubleToString(rates[0].open,Digits()),      panel.CellX(0,2,1)+2, panel.CellY(0,2,1)+2,clrNONE,90);
   panel.DrawText("High",  panel.CellX(0,3,0)+2, panel.CellY(0,3,0)+2); panel.DrawText(DoubleToString(rates[0].high,Digits()),      panel.CellX(0,3,1)+2, panel.CellY(0,3,1)+2,clrNONE,90);
   panel.DrawText("Low",   panel.CellX(0,4,0)+2, panel.CellY(0,4,0)+2); panel.DrawText(DoubleToString(rates[0].low,Digits()),       panel.CellX(0,4,1)+2, panel.CellY(0,4,1)+2,clrNONE,90);
   panel.DrawText("Close", panel.CellX(0,5,0)+2, panel.CellY(0,5,0)+2); panel.DrawText(DoubleToString(rates[0].close,Digits()),     panel.CellX(0,5,1)+2, panel.CellY(0,5,1)+2,clrNONE,90);

//--- Display the indicator data from the specified bar on the panel in table 1
   panel.DrawText(ind_title, panel.CellX(1,0,0)+2, panel.CellY(1,0,0)+2);
   double value=IndicatorValue(handle,index,0);
   string value_str=(value!=EMPTY_VALUE ? DoubleToString(value,ind_digits) : "");
   panel.DrawText(value_str,panel.CellX(1,0,1)+2,panel.CellY(1,0,1)+2,clrNONE,90);

//--- Create Volumes indicator handle
   static bool create=false;
   static int hv=INVALID_HANDLE;
   if(!create)
     {
      ResetLastError();
      hv=iVolumes(Symbol(),PERIOD_CURRENT,InpVolume);
      if(hv==INVALID_HANDLE)
        {
         PrintFormat("%s: Failed to create indicator handle Volumes. Error %ld",__FUNCTION__,GetLastError());
         return;
        }
      create=true;
     }

//--- Get Volumes indicator status
   ENUM_LINE_STATE state_vol=LineState(hv,index,0);
//--- Display a description of the indicator line state
   panel.DrawText("BW MFI State", panel.CellX(1,1,0)+2, panel.CellY(1,1,0)+2);
   ENUM_LINE_STATE state=LineState(handle,index,0);
   color clr=clrNONE;
   string state_str=LineStateDescription(state);
   if((state==LINE_STATE_UP || state==LINE_STATE_TURN_UP) && (state_vol==LINE_STATE_UP || state_vol==LINE_STATE_TURN_UP))
     {
      state_str="MFI Up, Vol Up";
      clr=clrGreen;
     }
   if((state==LINE_STATE_DOWN || state==LINE_STATE_TURN_DOWN) && (state_vol==LINE_STATE_DOWN || state_vol==LINE_STATE_TURN_DOWN))
     {
      state_str="MFI Dn, Vol Dn";
      clr=clrSaddleBrown;
     }
   if((state==LINE_STATE_UP || state==LINE_STATE_TURN_UP) && (state_vol==LINE_STATE_DOWN || state_vol==LINE_STATE_TURN_DOWN))
     {
      state_str="MFI Up, Vol Dn";
      clr=clrBlue;
     }
   if((state==LINE_STATE_DOWN || state==LINE_STATE_TURN_DOWN) && (state_vol==LINE_STATE_UP || state_vol==LINE_STATE_TURN_UP))
     {
      state_str="MFI Dn, Vol Up";
      clr=clrLightCoral;
     }

//--- Set font parameters for indicator state data (bold font)
   name=panel.FontParams(size,flags,angle);
   panel.SetFontParams(name,9,FW_BOLD);
   panel.DrawText(state_str,panel.CellX(1,1,1)+2,panel.CellY(1,1,1)+2,clr,90);
//--- Restore the normal thickness of the panel font
   panel.SetFontParams(name,9);

//--- Redraw the chart to immediately display all changes on the panel
   ChartRedraw(ChartID());
  }
Cabe señalar aquí que podemos obtener los datos de los indicadores de BW FMI de la forma habitual: usando las funciones universales que se ofrecen aquí. Pero para la interpretación de las lecturas de las columnas del indicador necesitaremos un indicador más, el indicador Volumes, porque para colorear las columnas del histograma se compararán dos indicadores: el valor de la columna del histograma y el valor del volumen en relación con sus valores anteriores. Para obtener el volumen, en la función se creará el manejador del indicador Volumes (una vez durante la primera llamada) y, a continuación, se compararán los estados de las líneas del indicador BW MFI y Volumes. La descripción de su relación mutua se mostrará en el panel como texto.
Además, al utilizar un panel informativo, el manejador de eventos OnChartEvent() del asesor llamará al manejador de eventos del panel informativo y procesará los eventos para obtener el índice de la barra bajo el cursor:
//+------------------------------------------------------------------+
//| ChartEvent function                                              |
//+------------------------------------------------------------------+
void OnChartEvent(const int id,
                  const long &lparam,
                  const double &dparam,
                  const string &sparam)
  {
//--- Handling the panel
//--- Call the panel event handler
   panel.OnChartEvent(id,lparam,dparam,sparam);

//--- If the cursor moves or a click is made on the chart
   if(id==CHARTEVENT_MOUSE_MOVE || id==CHARTEVENT_CLICK)
     {
      //--- Declare the variables to record time and price coordinates in them
      datetime time=0;
      double price=0;
      int wnd=0;
      //--- If the cursor coordinates are converted to date and time
      if(ChartXYToTimePrice(ChartID(),(int)lparam,(int)dparam,wnd,time,price))
        {
         //--- write the bar index where the cursor is located to a global variable
         mouse_bar_index=iBarShift(Symbol(),PERIOD_CURRENT,time);
         //--- Display the bar data under the cursor on the panel
         DrawData(mouse_bar_index,time);
        }
     }

//--- If we received a custom event, display the appropriate message in the journal
   if(id>CHARTEVENT_CUSTOM)
     {
      //--- Here we can implement handling a click on the close button on the panel
      PrintFormat("%s: Event id=%ld, object id (lparam): %lu, event message (sparam): %s",__FUNCTION__,id,lparam,sparam);
     }
  }
Tras compilar y ejecutar el asesor en el gráfico, podremos controlar el valor y el estado de la línea de indicador en el panel informativo:
Podrá ver el archivo del asesor de pruebas "TestWilliamsBWMFI.mq5" en los archivos adjuntos.
Perfeccionamiento de las clases de panel informativo. Panorámica
Para los asesores de prueba en los artículos de esta serie, se utilizará el panel creado en el primer artículo de la serie. Podríamos crear una tabla única en el panel, de forma que, según las coordenadas de esta, se puedan mostrar los datos en el panel. Las clases de paneles ya están listas: podemos crear cualquier número de tablas en las que colocar los datos. También hemos corregido el error por el cual, si se minimizaba el panel, se cambiaba el marco temporal y se volvía a expandir el panel: los datos dibujados en el panel no se mostraban hasta la siguiente minimización-expansión del panel. Vamos a repasar brevemente los cambios introducidos, no con fines ilustrativos, sino como breve resumen, para no volver al tema de los cambios realizados en las clases de panel.
Ahora cada tabla creada en el panel puede retornar sus coordenadas: X1, Y1 - esquina superior izquierda, X2 e Y2 - esquina inferior derecha. A cada tabla se le asignará un identificador y un nombre propios con los que se podrá hacer referencia a ella para recuperar los datos.
Hemos añadido variables privadas y métodos públicos a la clase de datos tabulares CTableData para registrar y retornar estos valores:
//+------------------------------------------------------------------+
//| Table data class                                                 |
//+------------------------------------------------------------------+
class CTableData : public CObject
  {
private:
   CArrayObj         m_list_rows;               // List of rows
   uint              m_id;                      // Table ID
   int               m_x1;                      // X1 coordinate
   int               m_y1;                      // Y1 coordinate
   int               m_x2;                      // X2 coordinate
   int               m_y2;                      // Y2 coordinate
   int               m_w;                       // Width
   int               m_h;                       // Height
   string            m_name;                    // Table name
public:
//--- Set table name
   void              SetName(const string name) { this.m_name=name;              }
//--- Return table (1) ID and (2) name
   uint              ID(void)             const { return this.m_id;              }
   string            Name(void)           const { return this.m_name;            }

//--- Set coordinate (1) X1, (2) X2
   void              SetX1(const uint x1)       { this.m_x1=(int)x1;             }
   void              SetX2(const uint x2)       { this.m_x2=(int)x2;             }
//--- Set coordinate (1) Y1, (2) Y2
   void              SetY1(const uint y1)       { this.m_y1=(int)y1;             }
   void              SetY2(const uint y2)       { this.m_y2=(int)y2;             }
//--- Set table coordinates
   void              SetCoords(const int x1,const int y1,const int x2,const int y2)
                       {
                        this.SetX1(x1);
                        this.SetY1(y1);
                        this.SetX2(x2);
                        this.SetY2(y2);
                       }

//--- Return coordinate (1) X1, (2) X2
   int               X1(void)             const { return this.m_x1;              }
   int               X2(void)             const { return this.m_x2;              }
//--- Return coordinate (1) Y1, (2) Y2
   int               Y1(void)             const { return this.m_y1;              }
   int               Y2(void)             const { return this.m_y2;              }

//--- Return (1) width and (2) height
   int               Width(void)          const { return this.m_x2-this.m_x1+1;  }
   int               Height(void)         const { return this.m_y2-this.m_y1+1;  }

//--- Return the list of table rows
Hemos añadido un método público que retorna el número de celdas de la fila especificada:
   int               ColumnsInRow(const int row_index)
                       {
                        //--- If there is no row in the list, return 0
                        if(this.RowsTotal()==0)
                           return 0;
                        //--- Get a pointer to the specified row and return the number of cells in it
                        CTableRow *row=this.GetRow(row_index);
                        return(row!=NULL ? row.CellsTotal() : 0);
                       }
//--- Return the total number of cells in the table
Asimismo, hemos añadido un método público que retorna el número total de celdas de la tabla:
//--- Return the total number of cells in the table
   int               CellsTotal(void)
                       {
                        //--- If there is no row in the list, return 0
                        if(this.RowsTotal()==0)
                           return 0;
                        //---
                        int num=0;
                        int total=this.RowsTotal();
                        for(int i=0;i<total;i++)
                           num+=this.ColumnsInRow(i);
                        return num;
                       }
//--- Clear lists of rows and table cells
Antes, nos limitábamos a retornar el número de columnas de la primera fila de la tabla, confiando en que el número de columnas fuera el mismo en cada fila. Ahora podremos obtener el número total de celdas de la tabla, según el número de celdas colocadas en cada fila de la tabla. Asimismo, podremos obtener el número de celdas de la fila especificada. De este modo, podremos crear tablas no uniformes en las que el número de columnas (celdas) sea el mismo para cada fila La creación de tablas con diferentes números de celdas en las filas no se ha probado debido a la falta de demanda en las tareas actuales. Es probable que se necesiten más mejoras, pero por ahora, no hay necesidad de tablas así.
Hemos añadido un método virtual Compare a la clase, que permite comparar tablas por identificadores (modo compare = 0) o por nombres (modo != 0):
//--- Virtual method for comparing two objects
   virtual int       Compare(const CObject *node,const int mode=0) const
                       {
                        const CTableData *compared=node;
                        if(mode==0)
                           return(this.ID()>compared.ID() ? 1 : this.ID()<compared.ID() ? -1 : 0);
                        else
                           return(this.Name()==compared.Name() ? 0 : this.Name()>compared.Name() ? 1 : -1);
                       }
El identificador de la tabla a crear se transmitirá ahora al constructor paramétrico de la clase:
//--- Constructor/destructor
                     CTableData(const uint id) : m_id(id){ this.m_list_rows.Clear(); this.m_name="";  }
                    ~CTableData(void)                    { this.m_list_rows.Clear();                  }
Mientras que antes se declaraba un ejemplar de un objeto de datos de tabla en la clase de panel, ahora se declarará una lista que contendrá los punteros a las tablas creadas en el panel.
//+------------------------------------------------------------------+
//| Dashboard class                                                  |
//+------------------------------------------------------------------+
class CDashboard : public CObject
  {
private:
   CCanvas           m_canvas;                  // Canvas
   CCanvas           m_workspace;               // Work space
   CArrayObj         m_list_table;              // List of tables
   ENUM_PROGRAM_TYPE m_program_type;            // Program type
   ENUM_MOUSE_STATE  m_mouse_state;             // Mouse button status
Las variables se declararán en la sección privada para crear los nombres de los archivos para guardar el fondo y los píxeles del área de trabajo en un archivo:
   string            m_name_gv_m;               // Name of the global terminal variable storing the collapsed panel flag

   string            m_name_gv_u;               // Name of the global terminal variable storing the flag of the pinned panel
   string            m_filename_bg;             // File name to save background pixels
   string            m_filename_ws;             // File name for saving work space pixels

   uint              m_array_wpx[];             // Array of pixels to save/restore the workspace
   uint              m_array_ppx[];             // Array of pixels to save/restore the panel background
Hemos añadido y perfeccionado los métodos para trabajar con las fuentes de paneles, para crear y recuperar las tablas y sus coordenadas:
//--- Set default panel font parameters
   void              SetFontParams(const string name,const int size,const uint flags=0,const uint angle=0);
//--- Return the specified dashboard font parameters
   string            FontParams(int &size,uint &flags,uint &angle);
//--- Return the specified panel (1) font, (2) size and font flags
   string            FontName(void)    const { return this.m_workspace.FontNameGet();  }
   int               FontSize(void)    const { return this.m_workspace.FontSizeGet();  }
   uint              FontFlags(void)   const { return this.m_workspace.FontFlagsGet(); }
//--- Display a text message at the specified coordinates
   void              DrawText(const string text,const int x,const int y,const color clr=clrNONE,const int width=WRONG_VALUE,const int height=WRONG_VALUE);
//--- Create a new table
   bool              CreateNewTable(const int id=WRONG_VALUE);
//--- Return tabular data object by (1) ID and (2) name
   CTableData       *GetTable(const uint id);
   CTableData       *GetTable(const string name);
//--- Draw a (1) background grid (2) with automatic cell size
   void              DrawGrid(const uint table_id,const uint x,const uint y,const uint rows,const uint columns,const uint row_size,const uint col_size,const color line_color=clrNONE,bool alternating_color=true);
   void              DrawGridAutoFill(const uint table_id,const uint border,const uint rows,const uint columns,const color line_color=clrNONE,bool alternating_color=true);
//--- Print grid data (line intersection coordinates)
   void              GridPrint(const uint table_id,const uint indent=0)
                       {
                        CTableData *table=this.GetTable(table_id);
                        if(table==NULL)
                          {
                           ::PrintFormat("%s: Error. Failed to get table object with id %lu",__FUNCTION__,table_id);
                           return;
                          }
                        table.Print(indent);
                       }
//--- Write the X and Y coordinate values of the specified table cell to variables
   void              CellXY(const uint table_id,const uint row,const uint column, int &x, int &y)
                       {
                        CTableData *table=this.GetTable(table_id);
                        if(table==NULL)
                          {
                           ::PrintFormat("%s: Error. Failed to get table object with id %lu",__FUNCTION__,table_id);
                           return;
                          }
                        table.CellXY(row,column,x,y);
                       }
//--- Return the (1) X and (2) Y coordinate of the specified table cell
   int               CellX(const uint table_id,const uint row,const uint column)
                       {
                        CTableData *table=this.GetTable(table_id);
                        if(table==NULL)
                          {
                           ::PrintFormat("%s: Error. Failed to get table object with id %lu",__FUNCTION__,table_id);
                           return WRONG_VALUE;
                          }
                        return table.CellX(row,column);
                       }
   int               CellY(const uint table_id,const uint row,const uint column)
                       {
                        CTableData *table=this.GetTable(table_id);
                        if(table==NULL)
                          {
                           ::PrintFormat("%s: Error. Failed to get table object with id %lu",__FUNCTION__,table_id);
                           return WRONG_VALUE;
                          }
                        return table.CellY(row,column);
                       }
//--- Write X1 and Y1, X2 and Y2 coordinate values of the specified table to the variables
   void              TableCoords(const uint table_id,int &x1,int &y1,int &x2,int &y2)
                       {
                        x1=y1=x2=y2=WRONG_VALUE;
                        CTableData *table=this.GetTable(table_id);
                        if(table==NULL)
                           return;
                        x1=table.X1();
                        y1=table.Y1();
                        x2=table.X2();
                        y2=table.Y2();
                       }

//--- Return the (1) X1, (2) Y1, (3) X2 and (4) Y2 coordinate of the specified table
   int               TableX1(const uint table_id)
                       {
                        CTableData *table=this.GetTable(table_id);
                        return(table!=NULL ? table.X1() : WRONG_VALUE);
                       }
   int               TableY1(const uint table_id)
                       {
                        CTableData *table=this.GetTable(table_id);
                        return(table!=NULL ? table.Y1() : WRONG_VALUE);
                       }
   int               TableX2(const uint table_id)
                       {
                        CTableData *table=this.GetTable(table_id);
                        return(table!=NULL ? table.X2() : WRONG_VALUE);
                       }
   int               TableY2(const uint table_id)
                       {
                        CTableData *table=this.GetTable(table_id);
                        return(table!=NULL ? table.Y2() : WRONG_VALUE);
                       }

//--- Event handler
   void              OnChartEvent(const int id,const long &lparam,const double &dparam,const string &sparam);
//--- Constructor/destructor
                     CDashboard(const uint id,const int x,const int y, const int w,const int h,const int wnd=-1);
                    ~CDashboard();
En el constructor de la clase, se crearán los nombres de los archivos para guardar el fondo y el área de trabajo:
//--- Set the names of global terminal variables to store panel coordinates, collapsed/expanded state and pinning
   this.m_name_gv_x=this.m_program_name+"_id_"+(string)this.m_id+"_"+(string)this.m_chart_id+"_X";
   this.m_name_gv_y=this.m_program_name+"_id_"+(string)this.m_id+"_"+(string)this.m_chart_id+"_Y";
   this.m_name_gv_m=this.m_program_name+"_id_"+(string)this.m_id+"_"+(string)this.m_chart_id+"_Minimize";
   this.m_name_gv_u=this.m_program_name+"_id_"+(string)this.m_id+"_"+(string)this.m_chart_id+"_Unpin";

//--- Set file names for saving background and work space pixels
   this.m_filename_bg=this.m_program_name+"\\Dashboard"+(string)this.m_id+"\\background.bin";
   this.m_filename_ws=this.m_program_name+"\\Dashboard"+(string)this.m_id+"\\workspace.bin";
Al final del constructor, si el panel está minimizado, los arrays de los píxeles del fondo y del área de trabajo se cargarán con los datos de los archivos:
//--- If the panel collapse flag is set, load the background and work space pixels from the files into arrays
   if(this.m_minimized)
     {
      if(::FileIsExist(this.m_filename_bg))
         this.FileLoadBackground();
      if(::FileIsExist(this.m_filename_ws))
         this.FileLoadWorkspace();
     }
  }
Por ello, si los píxeles se han guardado previamente en archivos y el panel se ha creado de forma minimizada, la apariencia del panel se cargará desde los archivos con el panel dibujado en forma minimizada. Al expandirlo, su apariencia se obtendrá a partir de los arrays de píxeles rellenados desde los archivos.
En el destructor, si el panel está minimizado, deberemos expandirlo, escribir los datos de píxeles en archivos y volver a minimizarlo antes de poder borrar los objetos del panel. Después de ello, podremos eliminar los objetos del panel: su apariencia ya estará guardada en archivos para restaurar la información desde ellos durante la posterior creación en el constructor:
//+------------------------------------------------------------------+
//| Destructor                                                       |
//+------------------------------------------------------------------+
CDashboard::~CDashboard()
  {
//--- Write the current values to global terminal variables
   ::GlobalVariableSet(this.m_name_gv_x,this.m_x);
   ::GlobalVariableSet(this.m_name_gv_y,this.m_y);
   ::GlobalVariableSet(this.m_name_gv_m,this.m_minimized);
   ::GlobalVariableSet(this.m_name_gv_u,this.m_movable);

//--- If the panel is collapsed,
//--- expand the panel, save the appearance into pixel arrays and collapse the panel
   if(this.m_minimized)
     {
      this.Expand();
      this.SaveBackground();
      this.SaveWorkspace();
      this.Collapse();
     }
//--- otherwise, if the panel is expanded,
//--- save the appearance into pixel arrays
   else
     {
      this.SaveBackground();
      this.SaveWorkspace();
     }
//--- Save pixel arrays to files
   this.FileSaveBackground();
   this.FileSaveWorkspace();

//--- Delete panel objects
   this.m_canvas.Destroy();
   this.m_workspace.Destroy();
  }
En el bloque de procesamiento de clics en el botón para minimizar/desplegar el panel, comprobaremos la bandera y guardaremos el fondo y el área de trabajo en arrays de píxeles en caso de que el panel se despliegue:
      //--- If the panel collapse/expand button is pressed
      else if(state==MOUSE_STATE_PRESSED_INSIDE_MINIMIZE)
        {
         //--- Disable chart scrolling, right-click menu and crosshair
         this.SetChartsTool(false);
         //--- If the panel is not collapsed, save the background and work space into pixel arrays
         if(!this.m_minimized)
           {
            this.SaveWorkspace();
            this.SaveBackground();
           }
         //--- "flip" the panel collapse flag,
         this.m_minimized=!this.m_minimized;
         //--- redraw the panel taking into account the new state of the flag,
         this.Draw(this.m_title);
         //--- redraw the panel header area
         this.RedrawHeaderArea();
         //--- If the panel is pinned and expanded, move it to the stored location coordinates
         if(this.m_minimized && !this.m_movable)
            this.Move(this.m_x_dock,this.m_y_dock);
         //--- Update the canvas with chart redrawing and
         this.m_canvas.Update();
         //--- write the state of the panel expand flag to the global terminal variable
         ::GlobalVariableSet(this.m_name_gv_m,this.m_minimized);
        }
Del método de minimización del panel, hemos eliminado las líneas de guardado del array de píxeles; ahora el guardado de píxeles solo se realizará al clicar en el botón de minimización/despliegue:
//+------------------------------------------------------------------+
//| Collapse the panel                                               |
//+------------------------------------------------------------------+
void CDashboard::Collapse(void)
  {
//--- Save the pixels of the working space and the panel background into arrays
   this.SaveWorkspace();
   this.SaveBackground();
//--- Remember the current height of the panel
   int h=this.m_h;
//--- Change the dimensions (height) of the canvas and working space
   if(!this.SetSizes(this.m_canvas.Width(),this.m_header_h))
      return;
//--- Draw the header area
   this.DrawHeaderArea(this.m_title);
//--- Return the saved panel height to the variable
   this.m_h=h;
  }
Implementación de un método que retorna el conjunto de parámetros de fuente del panel:
//+------------------------------------------------------------------+
//| Return the specified dashboard font parameters                   |
//+------------------------------------------------------------------+
string CDashboard::FontParams(int &size,uint &flags,uint &angle)
  {
   size=this.m_workspace.FontSizeGet();
   flags=this.m_workspace.FontFlagsGet();
   angle=this.m_workspace.FontAngleGet();
   return this.m_workspace.FontNameGet();
  }
El método retornará el nombre de la fuente, mientras que el tamaño de la fuente, sus banderas y el ángulo se escribirán en las variables transmitidas por enlace.
En el método de dibujado del texto ahora también se transmitirá el color del texto dibujado. El valor predeterminado será clrNONE, que indicará el color de texto establecido previamente:
//+------------------------------------------------------------------+
//| Display a text message at the specified coordinates              |
//+------------------------------------------------------------------+
void CDashboard::DrawText(const string text,const int x,const int y,const color clr=clrNONE,const int width=WRONG_VALUE,const int height=WRONG_VALUE)
  {
//--- Declare variables to record the text width and height in them
   int w=width;
   int h=height;
//--- If the width and height of the text passed to the method have zero values,
//--- then the entire working space is completely cleared using the transparent color
   if(width==0 && height==0)
      this.m_workspace.Erase(0x00FFFFFF);
//--- Otherwise
   else
     {
      //--- If the passed width and height have default values (-1), we get its width and height from the text
      if(width==WRONG_VALUE && height==WRONG_VALUE)
         this.m_workspace.TextSize(text,w,h);
      //--- otherwise,
      else
        {
         //--- if the width passed to the method has the default value (-1) - get the width from the text, or
         //--- if the width passed to the method has a value greater than zero, use the width passed to the method, or
         //--- if the width passed to the method has a zero value, use the value 1 for the width
         w=(width ==WRONG_VALUE ? this.m_workspace.TextWidth(text)  : width>0  ? width  : 1);
         //--- if the height passed to the method has a default value (-1), get the height from the text, or
         //--- if the height passed to the method has a value greater than zero, use the height passed to the method, or
         //--- if the height passed to the method has a zero value, use value 1 for the height
         h=(height==WRONG_VALUE ? this.m_workspace.TextHeight(text) : height>0 ? height : 1);
        }
      //--- Fill the space according to the specified coordinates and the resulting width and height with a transparent color (erase the previous entry)
      this.m_workspace.FillRectangle(x,y,x+w,y+h,0x00FFFFFF);
     }
//--- Display the text to the space cleared of previous text and update the working space without redrawing the screen
   this.m_workspace.TextOut(x,y,text,::ColorToARGB(clr==clrNONE ? this.m_fore_color : clr));
   this.m_workspace.Update(false);
  }
Implementación de los métodos para crear una nueva tabla y recuperar los datos tabulares según el ID y el nombre de tabla:
//+------------------------------------------------------------------+
//| Create a new table                                               |
//+------------------------------------------------------------------+
bool CDashboard::CreateNewTable(const int id=WRONG_VALUE)
  {
   uint num=(id>WRONG_VALUE ? id : this.m_list_table.Total());
   CTableData *table=new CTableData(num);
   this.m_list_table.Sort();
   if(this.m_list_table.Search(table)!=WRONG_VALUE)
     {
      PrintFormat("%s: Error. Table with id %lu already exists in the list",__FUNCTION__,num);
      delete table;
      return false;
     }
   if(!this.m_list_table.Add(table))
     {
      PrintFormat("%s: Error. Failed to add table with id %lu to the list",__FUNCTION__,num);
      delete table;
      return false;
     }
   return true;
  }
//+------------------------------------------------------------------+
//| Return tabular data object by ID                                 |
//+------------------------------------------------------------------+
CTableData *CDashboard::GetTable(const uint id)
  {
   if(this.m_list_table.Total()==0)
     {
      PrintFormat("%s: Error. The list of tables is empty. First you need to create a table using CreateNewTable",__FUNCTION__);
      .return NULL;
     }
   CTableData *table=new CTableData(id);
   if(table==NULL)
     {
      ::PrintFormat("%s: Error. Failed to create table object with id %lu",__FUNCTION__,id);
      .return NULL;
     }
   this.m_list_table.Sort();
   int index=this.m_list_table.Search(table);
   delete table;
   return this.m_list_table.At(index);
  }
//+------------------------------------------------------------------+
//| Return tabular data object by name                               |
//+------------------------------------------------------------------+
CTableData *CDashboard::GetTable(const string name)
  {
   if(this.m_list_table.Total()==0)
     {
      PrintFormat("%s: Error. The list of tables is empty. First you need to create a table using CreateNewTable",__FUNCTION__);
      .return NULL;
     }
   CTableData *table=new CTableData(0);
   if(table==NULL)
     {
      ::PrintFormat("%s: Error. Failed to create table object");
      .return NULL;
     }
   table.SetName(name);
   this.m_list_table.Sort(1);
   int index=this.m_list_table.Search(table);
   delete table;
   return this.m_list_table.At(index);
  }
Cambios en los métodos de dibujado de las tablas:
//+------------------------------------------------------------------+
//| Draw the background grid                                         |
//+------------------------------------------------------------------+
void CDashboard::DrawGrid(const uint table_id,
                          const uint x,const uint y,const uint rows,const uint columns,const uint row_size,const uint col_size,
                          const color line_color=clrNONE,bool alternating_color=true)
  {
//--- Get a table object by ID
   CTableData *table=this.GetTable(table_id);
   if(table==NULL)
     {
      PrintFormat("%s: Error. Failed to get table object with id %lu",__FUNCTION__,table_id);
      return;
     }
//--- Clear all lists of the tabular data object (remove cells from rows and all rows)
   table.Clear();
//--- Line height cannot be less than 2
   int row_h=int(row_size<2 ? 2 : row_size);
//--- Column width cannot be less than 2
   int col_w=int(col_size<2 ? 2 : col_size);

//--- The X1 (left) coordinate of the table cannot be less than 1 (to leave one pixel around the perimeter of the panel for the frame)
   int x1=int(x<1 ? 1 : x);
//--- Calculate the X2 coordinate (right) depending on the number of columns and their width
   int x2=x1+col_w*int(columns>0 ? columns : 1);
//--- The Y1 coordinate is located under the panel title area
   int y1=this.m_header_h+(int)y;
//--- Calculate the Y2 coordinate (bottom) depending on the number of lines and their height
   int y2=y1+row_h*int(rows>0 ? rows : 1);
//--- Set table coordinates
   table.SetCoords(x1,y1-this.m_header_h,x2,y2-this.m_header_h);

//--- Get the color of the table grid lines, either by default or passed to the method
   color clr=(line_color==clrNONE ? C'200,200,200' : line_color);
//--- If the initial X coordinate is greater than 1, draw a table frame
//--- (in case of the coordinate 1, the table frame is the panel frame)
   if(x1>1)
      this.m_canvas.Rectangle(x1,y1,x2,y2,::ColorToARGB(clr,this.m_alpha));
//--- In the loop by table rows,
   for(int i=0;i<(int)rows;i++)
     {
      //--- calculate the Y coordinate of the next horizontal grid line (Y coordinate of the next table row)
      int row_y=y1+row_h*i;
      //--- if the flag of "alternating" line colors is passed and the line is even
      if(alternating_color && i%2==0)
        {
         //--- lighten the table background color and draw a background rectangle
         color new_color=this.NewColor(clr,45,45,45);
         this.m_canvas.FillRectangle(x1+1,row_y+1,x2-1,row_y+row_h-1,::ColorToARGB(new_color,this.m_alpha));
        }
      //--- Draw a table grid horizontal line
      this.m_canvas.Line(x1,row_y,x2,row_y,::ColorToARGB(clr,this.m_alpha));

      //--- Create a new table row object
      CTableRow *row_obj=new CTableRow(i);
      if(row_obj==NULL)
        {
         ::PrintFormat("%s: Failed to create table row object at index %lu",(string)__FUNCTION__,i);
         continue;
        }
      //--- Add it to the list of rows of the tabular data object
      //--- (if adding an object failed, delete the created object)
      if(!table.AddRow(row_obj))
         delete row_obj;
      //--- Set its Y coordinate in the created row object taking into account the offset from the panel title
      row_obj.SetY(row_y-this.m_header_h);
     }

//--- In the loop by table columns,
   for(int i=0;i<(int)columns;i++)
     {
      //--- calculate the X coordinate of the next vertical grid line (X coordinate of the next table row)
      int col_x=x1+col_w*i;
      //--- If the grid line goes beyond the panel, interrupt the loop
      if(x1==1 && col_x>=x1+m_canvas.Width()-2)
         break;
      //--- Draw a vertical line of the table grid
      this.m_canvas.Line(col_x,y1,col_x,y2,::ColorToARGB(clr,this.m_alpha));

      //--- Get the number of created rows from the table data object
      int total=table.RowsTotal();
      //--- In the loop by table rows
      for(int j=0;j<total;j++)
        {
         //--- get the next row
         CTableRow *row=table.GetRow(j);
         if(row==NULL)
            continue;
         //--- Create a new table cell
         CTableCell *cell=new CTableCell(row.Row(),i);
         if(cell==NULL)
           {
            ::PrintFormat("%s: Failed to create table cell object at index %lu",(string)__FUNCTION__,i);
            continue;
           }
         //--- Add the created cell to the row
         //--- (if adding an object failed, delete the created object)
         if(!row.AddCell(cell))
           {
            delete cell;
            continue;
           }
         //--- In the created cell object, set its X coordinate and the Y coordinate from the row object
         cell.SetXY(col_x,row.Y());
        }
     }
//--- Update the canvas without redrawing the chart
   this.m_canvas.Update(false);
  }
//+------------------------------------------------------------------+
//| Draws the background grid with automatic cell sizing             |
//+------------------------------------------------------------------+
void CDashboard::DrawGridAutoFill(const uint table_id,const uint border,const uint rows,const uint columns,const color line_color=clrNONE,bool alternating_color=true)
  {
//--- Get a table object by ID
   CTableData *table=this.GetTable(table_id);
   if(table==NULL)
     {
      PrintFormat("%s: Error. Failed to get table object with id %lu",__FUNCTION__,table_id);
      return;
     }
//--- X1 (left) table coordinate
   int x1=(int)border;
//--- X2 (right) table coordinate
   int x2=this.m_canvas.Width()-(int)border-1;
//--- Y1 (upper) table coordinate
   int y1=this.m_header_h+(int)border;
//--- Y2 (lower) table coordinate
   int y2=this.m_canvas.Height()-(int)border-1;
//--- Set table coordinates
   table.SetCoords(x1,y1,x2,y2);

//--- Get the color of the table grid lines, either by default or passed to the method
   color clr=(line_color==clrNONE ? C'200,200,200' : line_color);
//--- If the offset from the edge of the panel is greater than zero, draw a table border,
//--- otherwise, the panel border is used as the table border
   if(border>0)
      this.m_canvas.Rectangle(x1,y1,x2,y2,::ColorToARGB(clr,this.m_alpha));

//--- Height of the entire table grid
   int greed_h=y2-y1;
//--- Calculate the row height depending on the table height and the number of rows
   int row_h=(int)::round((double)greed_h/(double)rows);
//--- In the loop based on the number of rows
   for(int i=0;i<(int)rows;i++)
     {
      //--- calculate the Y coordinate of the next horizontal grid line (Y coordinate of the next table row)
      int row_y=y1+row_h*i;
      //--- if the flag of "alternating" line colors is passed and the line is even
      if(alternating_color && i%2==0)
        {
         //--- lighten the table background color and draw a background rectangle
         color new_color=this.NewColor(clr,45,45,45);
         this.m_canvas.FillRectangle(x1+1,row_y+1,x2-1,row_y+row_h-1,::ColorToARGB(new_color,this.m_alpha));
        }
      //--- Draw a table grid horizontal line
      this.m_canvas.Line(x1,row_y,x2,row_y,::ColorToARGB(clr,this.m_alpha));

      //--- Create a new table row object
      CTableRow *row_obj=new CTableRow(i);
      if(row_obj==NULL)
        {
         ::PrintFormat("%s: Failed to create table row object at index %lu",(string)__FUNCTION__,i);
         continue;
        }
      //--- Add it to the list of rows of the tabular data object
      //--- (if adding an object failed, delete the created object)
      if(!table.AddRow(row_obj))
         delete row_obj;
      //--- Set its Y coordinate in the created row object taking into account the offset from the panel title
      row_obj.SetY(row_y-this.m_header_h);
     }

//--- Table grid width
   int greed_w=x2-x1;
//--- Calculate the column width depending on the table width and the number of columns
   int col_w=(int)::round((double)greed_w/(double)columns);
//--- In the loop by table columns,
   for(int i=0;i<(int)columns;i++)
     {
      //--- calculate the X coordinate of the next vertical grid line (X coordinate of the next table row)
      int col_x=x1+col_w*i;
      //--- If this is not the very first vertical line, draw it
      //--- (the first vertical line is either the table frame or the panel frame)
      if(i>0)
         this.m_canvas.Line(col_x,y1,col_x,y2,::ColorToARGB(clr,this.m_alpha));

      //--- Get the number of created rows from the table data object
      int total=table.RowsTotal();
      //--- In the loop by table rows
      for(int j=0;j<total;j++)
        {
         //--- get the next row
         CTableRow *row=table.GetRow(j);
         if(row==NULL)
            continue;
         //--- Create a new table cell
         CTableCell *cell=new CTableCell(row.Row(),i);
         if(cell==NULL)
           {
            ::PrintFormat("%s: Failed to create table cell object at index %lu",(string)__FUNCTION__,i);
            continue;
           }
         //--- Add the created cell to the row
         //--- (if adding an object failed, delete the created object)
         if(!row.AddCell(cell))
           {
            delete cell;
            continue;
           }
         //--- In the created cell object, set its X coordinate and the Y coordinate from the row object
         cell.SetXY(col_x,row.Y());
        }
     }
//--- Update the canvas without redrawing the chart
   this.m_canvas.Update(false);
  }
Los métodos para guardar píxeles en un archivo y cargarlos desde un archivo utilizarán ahora los nombres de archivo creados previamente en el constructor:
//+------------------------------------------------------------------+
//| Save the pixel array of the working space to a file              |
//+------------------------------------------------------------------+
bool CDashboard::FileSaveWorkspace(void)
  {
//--- If the saved array is empty, inform of that and return 'false'
   if(this.m_array_wpx.Size()==0)
     {
      ::PrintFormat("%s: Error. The workspace pixel array is empty.",__FUNCTION__);
      return false;
     }
//--- If the array could not be saved to a file, report this and return 'false'
   if(!::FileSave(this.m_filename_ws,this.m_array_wpx))
     {
      ::PrintFormat("%s: FileSave '%s' failed. Error %lu",__FUNCTION__,this.m_filename_ws,::GetLastError());
      return false;
     }
//--- Successful, return 'true'
   return true;
  }
//+------------------------------------------------------------------+
//| Save the pixel array of the panel background to a file           |
//+------------------------------------------------------------------+
bool CDashboard::FileSaveBackground(void)
  {
//--- If the saved array is empty, inform of that and return 'false'
   if(this.m_array_ppx.Size()==0)
     {
      ::PrintFormat("%s: Error. The background pixel array is empty.",__FUNCTION__);
      return false;
     }
//--- If the array could not be saved to a file, report this and return 'false'
   if(!::FileSave(this.m_filename_bg,this.m_array_ppx))
     {
      ::PrintFormat("%s: FileSave '%s' failed. Error %lu",__FUNCTION__,this.m_filename_bg,::GetLastError());
      return false;
     }
//--- Successful, return 'true'
   return true;
  }
//+------------------------------------------------------------------+
//| Upload the array of working space pixels from a file             |
//+------------------------------------------------------------------+
bool CDashboard::FileLoadWorkspace(void)
  {
//--- If failed to upload data from the file into the array, report this and return 'false'
   if(::FileLoad(this.m_filename_ws,this.m_array_wpx)==WRONG_VALUE)
     {
      ::PrintFormat("%s: FileLoad '%s' failed. Error %lu",__FUNCTION__,this.m_filename_ws,::GetLastError());
      return false;
     }
//--- Successful, return 'true'
   return true;
  }
//+------------------------------------------------------------------+
//| Upload the array of panel background pixels from a file          |
//+------------------------------------------------------------------+
bool CDashboard::FileLoadBackground(void)
  {
   if(::FileLoad(this.m_filename_bg,this.m_array_ppx)==WRONG_VALUE)
     {
      ::PrintFormat("%s: FileLoad '%s' failed. Error %lu",__FUNCTION__,this.m_filename_bg,::GetLastError());
      return false;
     }
//--- Successful, return 'true'
   return true;
  }
Conclusión
En este artículo hemos visto cómo conectar los indicadores de volumen y Bill Williams a los asesores. Todos los códigos presentes en este artículo pueden utilizarse "tal cual" para su inserción en el código de nuestros propios programas. Más tarde veremos la última categoría de indicadores: los indicadores de tendencia, para conectarlos y utilizarlos en asesores.
Todos los archivos (asesores de prueba y clases de paneles) pueden descargarse de la lista de archivos adjunta al artículo. La clase del panel debe encontrarse en \MQL5\Include\Dashboard\Dashboard\Dashboard.mqh.
Traducción del ruso hecha por MetaQuotes Ltd.
Artículo original: https://www.mql5.com/ru/articles/13277
- Aplicaciones de trading gratuitas
- 8 000+ señales para copiar
- Noticias económicas para analizar los mercados financieros
Usted acepta la política del sitio web y las condiciones de uso