Conheça o Mercado MQL5 no YouTube, assista aos vídeos tutoriais
Como comprar um robô de negociação ou indicador?
Execute seu EA na
hospedagem virtual
hospedagem virtual
Teste indicadores/robôs de negociação antes de comprá-los
Quer ganhar dinheiro no Mercado?
Como apresentar um produto para o consumidor final?
Novos Indicadores Técnicos para MetaTrader 5

Nosso indicador Basic Support and Resistance é a solução necessária para aumentar sua análise técnica.Este indicador permite que você forneça níveis de suporte e resistência no gráfico/ versão MT4 grátis
Recursos
Integração dos níveis de Fibonacci: Com a opção de exibir níveis de Fibonacci, juntamente com os níveis de suporte e resistência, nosso indicador fornece uma visão ainda mais profunda do comportamento do mercado e possíveis áreas de reversão.
Otimização de desempenho: Com a o

O Multi Asset Monitor Panel é uma ferramenta revolucionária para traders que precisam monitorar vários mercados simultaneamente. Este painel inovador permite que você acompanhe qualquer símbolo e qualquer timeframe de que precisar, tudo em uma única interface organizada. Com até três listas de símbolos e templates personalizáveis do MT5, você pode adaptar sua configuração de monitoramento para se ajustar à sua estratégia de negociação específica. O que diferencia o Multi Asset Monitor Panel é su
=== > O que esse indicador faz? Ele traça uma única média SMA com a escolha do período de tempo
Você coloca esse indicador em seus gráficos quantas vezes for necessário para calcular a média. Escolha os parâmetros e características da sua média e pronto!!! **** Veja a captura de tela 01 a 02 Não hesite em me pedir o código iCustom para integrar facilmente esta média em seus próprios códigos, outro indicador ou EA
Escolher O prazo alvo O número de períodos O turno O OHLC desejado A cor da te
=== > O que esse indicador faz? Ele traça uma única média EMA com a escolha do período de tempo
Você coloca esse indicador em seus gráficos quantas vezes for necessário para calcular a média. Escolha os parâmetros e características da sua média e pronto!!! **** Veja a captura de tela 01 a 02 Não hesite em me pedir o código iCustom para integrar facilmente esta média em seus próprios códigos, outro indicador ou EA
Escolher O prazo alvo O número de períodos O turno O OHLC desejado A cor da
=== > O que esse indicador faz? Ele traça uma única média SMMA com a escolha do período de tempo
Você coloca esse indicador em seus gráficos quantas vezes for necessário para calcular a média. Escolha os parâmetros e características da sua média e pronto!!! **** Veja a captura de tela 01 a 02 Não hesite em me pedir o código iCustom para integrar facilmente esta média em seus próprios códigos, outro indicador ou EA
Escolher O prazo alvo O número de períodos O turno O OHLC desejado A cor da
=== > O que esse indicador faz? Ele traça uma única média LWMA com a escolha do período de tempo
Você coloca esse indicador em seus gráficos quantas vezes for necessário para calcular a média. Escolha os parâmetros e características da sua média e pronto!!! **** Veja a captura de tela 01 a 02 Não hesite em me pedir o código iCustom para integrar facilmente esta média em seus próprios códigos, outro indicador ou EA
Escolher O prazo alvo O número de períodos O turno O OHLC desejado A cor da

Otimize suas estratégias de trading com o indicador RAR (Relative Adaptive RSI)! Este avançado indicador de análise técnica combina o poder do Índice de Força Relativa (RSI) com técnicas adaptativas, fornecendo sinais mais precisos e confiáveis do que um oscilador comum. O que é o Indicador RAR? O RAR é um indicador projetado para MetaTrader 5 que utiliza Médias Móveis Exponenciais (EMA) e Médias Móveis Adaptativas (AMA) para suavizar o RSI e ajustá-lo dinamicamente às condições do mercado. Essa
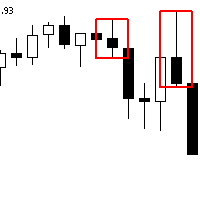
The Advanced Order Block Indicator for MetaTrader 5 is designed to enhance technical analysis by identifying significant order blocks that sweep liquidity and create Fair Value Gaps (FVG) when pushing away. This indicator is ideal for traders who focus on institutional trading concepts and wish to incorporate advanced order flow and price action strategies into their trading routine. Overview Order Block Identification : An order block represents a price area where a substantial number of orders
FREE

O LIVRO VISUAL é uma ferramenta que auxilia na identificação de escoras e renovação de ordens, para quem opera Tape Reading ou fluxo no gráfico é uma excelente ferramenta. Porem ele funciona somente em Mercados Centralizados ou com profundidade nível 2. É de fundamental importância você saber que ele não funciona em Mercado de FOREX. Porem pode ser utilizado no Mercado da B3.
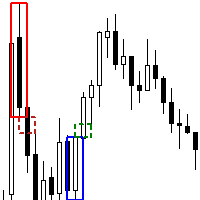
The Order Block FVG Box indicator for MetaTrader 5 is a powerful tool designed for discerning traders looking to identify and capitalize on high-probability trading opportunities. This indicator excels at pinpointing valid Order Blocks that are immediately followed by Fair Value Gaps (FVG), enhancing your trading strategy with precise visual cues. Key Features: Order Block Identification : Detects valid Order Blocks, which are significant areas where institutional buying or selling has occurred,
FREE

Product Description: Adaptive Y-Axis Scaling is a powerful MT5 indicator designed to enhance your trading experience by providing precise control over the Y-axis (price) scaling of your charts. This innovative tool allows you to customize the price scaling by specifying the number of pips from the visible chart's highs and lows. The calculated price range from this input is then used to set the maximum and minimum prices for the open chart, ensuring an optimized and comprehensive view of market
FREE

Conquistador is a fundamental technical indicator designed to assess the current market situation and determine the optimal entry and exit points in the currency pairs market with minimal risk. This indicator was created on the basis of original indicators for searching for extremes and is excellent for determining a reversal or sharp movement of the market. Thanks to Conquistador, you can recognize such moments in a timely manner and receive notifications in the form of colored dots on the cha

The purpose of the remaining time indicator on the K-line is to assist traders in gaining a deeper understanding of market dynamics and making more precise trading decisions, particularly in the realm of forex and binary short-term trading. The significance of this indicator and its application to various trading strategies will be thoroughly examined below: Enhancement of Trading Timing Accuracy - Precision: By displaying the remaining time of the current K-line cycle, traders can achieve great
FREE
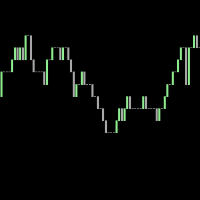
This is a tick indicator which compares the current bid price with the previous bid directly before it, and draws candles based on a comparison of the current ticks. It does not use historical ticks. Everything happens in real time, data moves from right to left, and the newest data arrives at the right. A trend line can be added which points in the direction of the price shifts.
FREE
Engulfing Candle Signal Alert: Elevate Your Trading Strategy Unlock the full potential of your trading with the Engulfing Candle Indicator, the ultimate tool for identifying market reversals and enhancing your trading precision. Designed specifically for traders who value accuracy and timely alerts, this powerful indicator detects engulfing candle patterns, a key signal in technical analysis that often indicates a potential shift in market direction. What is an Engulfing Candle?
An engulfing ca
FREE

Este indicador pode ser usado para ajudar a aprender o 'sistema de contagem de barras' de Al Brooks. Ele encontra e marca as barras H, L, Externa e Interna (Outside e Inside Bars). Barras H / L: Encontra e sinaliza 'H' e 'L' nas barras de entrada. A barra de sinal é a barra anterior. (não conta barras/pernas... você terá que fazer sua própria contagem para L1, L2... H1, H2, etc.) Encontra e marca barras internas (inside bar) com '+' e barras externas (outside bar) com 'E'.
FREE

This simple yet remarkably effective trend-continuation and breakout indicator acts as a powerful tool designed to aid traders in distinguishing genuine trend extensions from false breakouts. Through the utilization of a unique three-time-unit correctional phase guideline, it provides clear signals, offering trading opportunities with attractive risk-reward ratios.
Key Features Reliable Signals: The indicator confirms a genuine trend continuation or breakout if the price continues to trade h
>>> BIG SALE PROMOTION: 50% OFF + GIFT EA! - Promo price: $64 / Regular price $129 <<< - The promotion will end soon!
The Forex Trend Tracker is an advanced tool designed to enhance the trading capabilities of forex traders. This sophisticated indicator uses complex mathematical formulas alongside the Average True Range (ATR) to detect the beginnings of new upward and downward trends in the forex market. It offers visual cues and real-time alerts to give traders a competitive advantage in th

This spread indicator displays the actual spread of each candle. It highlights the maximum spread and the minimum spread of the chosen symbol. This indicator is very helpful to see in real time the spread evolution helping to avoid taking a trade when the spread is too high.
Inputs:
Print value in Points: if true displays the spread as a whole number
D isplay minimum and maximum spread of the past N days: select the number of days to consider the maximum and minimum spread
Automatically

Description of the Indicator The indicator "BullsBearsPulse" is designed for MetaTrader 5 and provides a visual representation of the Bulls Power and Bears Power indicators. These indicators are useful tools for technical analysis, particularly for the EUR/USD currency pair, to help traders identify potential trading opportunities. Functionality Bulls Power : This indicator measures the strength of the bulls (buyers) in the market. It calculates the difference between the highest price and a 20

The Engulf Seeker indicator is a powerful tool designed to detect engulfing candlestick patterns with precision and reliability. Built on advanced logic and customizable parameters, it offers traders valuable insights into market trends and potential reversal points.
Key Features and Benefits: Utilizes revised logic to analyze previous candles and identify strong bullish and bearish engulfing patterns. Convenient arrow-based alert system notifies traders of pattern occurrences on specific symb
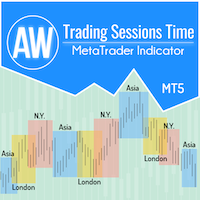
Para comodidade dos traders na obtenção de dados sobre o desempenho dos mercados e na melhor formulação de estratégias de negociação, desenvolvemos um indicador de sessão de negociação. O horário de funcionamento de várias bolsas afeta as negociações, pois afeta a atividade do mercado e os volumes de negociação. Estes factores determinam a volatilidade e as oportunidades de negociação de diferentes instrumentos. O indicador AW Trading Sessions Time exibe os horários de negociação dos mercados a
FREE

Fractals Dynamic Fractals Dynamic – é um indicador fractal livre modificado de Bill Williams, no qual você pode definir manualmente o número de barras à esquerda e à direita, construindo assim padrões exclusivos no gráfico. Agora, todas as estratégias de negociação baseadas ou baseadas no indicador Fractals Dynamic terão um sinal adicional.
Além disso, os fractais podem atuar como níveis de suporte e resistência. E em algumas estratégias de negociação para mostrar os níveis de liquidez. Pa
FREE

Course Crystal é um indicador que ajuda os traders a determinar a direção da tendência no mercado. Ele usa um algoritmo exclusivo para analisar os movimentos de preços e exibe os resultados em um gráfico como áreas coloridas. Azul indica uma oportunidade de compra, enquanto vermelho indica uma oportunidade de venda. Instruções de uso - https://www.mql5.com/en/blogs/post/757800 Sistema de negociação manual:
Determinação de tendência: O indicador Course Crystal analisa dados de preços atuais e

MinMax Levels MinMax Levels – é um indicador dos níveis de preço máximo, mínimo e de abertura para períodos de negociação importantes: dia, semana e mês.
Cada participante do mercado Forex utiliza níveis em seu sistema de negociação. Podem ser o sinal principal para a realização de transações ou um sinal adicional, atuando como ferramenta analítica. Neste indicador, dias, semanas e meses foram selecionados como períodos importantes, uma vez que são os principais períodos de negociação dos

Ultimate Pivot Levels indicator for MetaTrader 5 Ultimate_Pivot_Levels is versatile tool designed to enhance your trading experience by accurately plotting pivot levels on your charts. It allows entering your desired values manually or using well known pivot calculation methods to create pivot levels. It draws the levels in the background and allows you to customize levels, size and colors of areas, and it keeps your adjustments while extending the levels to every new bar. Whether you are a novi
FREE

ATR é um indicador importante para qualquer mercado financeiro. A abreviatura ATR corresponde a Average True Range. Este indicador é um instrumento para determinar a volatilidade do mercado, sendo este o seu objetivo direto. ATR mostra o movimento médio de preços para o período de tempo selecionado. O preço inicial do indicador é 63$. O preço aumentará a cada 10 vendas até 179$ O indicador ATR original está presente em muitos programas de negociação. O indicador ATR não é muito informativo, en

Se você precisa de um indicador que mostre os pontos de entrada no mercado, então este é o seu indicador.
O indicador não é redesenhado. Mostra pontos de compra e venda para qualquer TF (período de tempo) e qualquer par de moedas. As configurações são ajustáveis para todos os instrumentos. Você pode configurar cada parâmetro para qualquer corretora, para qualquer conta.
Este é um ALMOFADA confortável :)) Dá só uma olhada.....
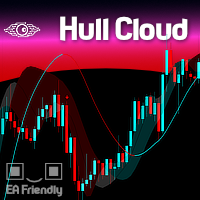
A Média Móvel de Hull é conhecida por sua capacidade de reduzir o atraso e fornecer uma representação mais clara e precisa das tendências do mercado. Ao suavizar os dados de preço de maneira mais eficaz do que as médias móveis tradicionais, ajuda os traders a identificar direções e reversões de tendência com maior precisão. O indicador Hull Cloud eleva isso usando quatro Médias Móveis de Hull que trabalham juntas como uma orquestra. Esta combinação cria um sistema dinâmico que destaca tendências

This indicator is the converted Metatrader 5 version of the TradingView indicator "ATR Based Trendlines - JD" by Duyck. This indicator works by automatically and continuously drawing trendlines not based exclusively on price, but also based on the volatility perceived by the ATR. So, the angle of the trendlines is determined by (a percentage of) the ATR. The angle of the trendlines follows the change in price, dictated by the ATR at the moment where the pivot point is detected. The ATR percentag
FREE

Volume plays a crucial role in trading, serving as a key indicator of market activity and investor sentiment. Here are some important roles of volume in trading:
Confirming trends: Dow Theory emphasizes the importance of volume in determining market trends. Larger volume usually indicates greater disagreement between bulls and bears, while smaller volume may indicate higher market agreement with the current price. Capturing institutional moves: By analyzing volume over a period of time, one c

This indicator displays the remaining time of the current candle, providing a visual representation of the time left until the candle closes and a new one begins, helping traders to make more informed decisions and stay on top of market fluctuations with precise timing, enhancing their overall trading experience and strategy execution, and allowing them to optimize their trades and maximize their profits.
FREE
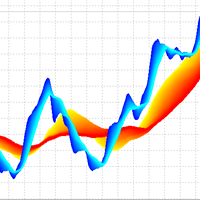
3D Trend Indicator is a non-repaint indicator using multiple moving averages with a 3D surface view. By using this indicator, you can remove uncertainties that can happen using a single and fixed moving average period. You can use a cloud area using a range of moving average periods. Also a wide range of visual settings are added to this indicator to have a better view from the cloud area. Alert and notification system added to the indicator to inform the trader about the action of candles on t
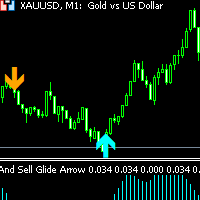
Buy and Sell Glide Arrow non-repaint and arrow appears on current candlestick orange arrow is a sell signal blue arrow is a buy signal Buy and Sell Glide Arrow works on 1 minute, 5 minutes and 15 minutes timeframes only as it is a scalping indicator. Pairs to trade: Forex pairs such as EURUSD,GBPUSD and other METALS: XAUUSD(GOLD) and other INDICES: Boom and crash 1000, Volatility Pairs such as VIX 10 - VIX 100 and other Lastly BTC AND LTC and other

Contact me for instruction, any questions! Introduction A flag can be used as an entry pattern for the continuation of an established trend. The formation usually occurs after a strong trending move. The pattern usually forms at the midpoint of a full swing and shows the start of moving. Bullish flags can form after an uptrend, bearish flags can form after a downtrend.
Flag Pattern Scanner Indicator It is usually difficult for a trader to recognize classic patterns on a chart, as well as sear

Contact me for instruction, any questions! Introduction V Bottoms and Tops are popular chart patterns among traders due to their potential for identifying trend reversals. These patterns are characterized by sharp and sudden price movements, creating a V-shaped or inverted V-shaped formation on the chart . By recognizing these patterns, traders can anticipate potential shifts in market direction and position themselves accordingly. V pattern is a powerful bullish/bearish reversal pattern
Apresentamos o Indicador de novo grafico - uma ferramenta poderosa para traders que buscam uma análise de preço suave e clara. Este indicador inovador calcula a média simples dos preços, oferecendo uma visão precisa e ajustada dos movimentos do mercado. Como Funciona : O Indicador de Média de Preços Simples (SMA) utiliza uma fórmula simples e eficaz: Ele soma o valor do último preço com o preço anterior. Em seguida, divide essa soma por 2 para obter a média. Fórmula : SMA = U ˊ ltimo Pre c ¸ o +

This is the test product. Please, DO NOT BUY IT! This is the test product. Please, DO NOT BUY IT! This is the test product. Please, DO NOT BUY IT! This is the test product. Please, DO NOT BUY IT! This is the test product. Please, DO NOT BUY IT! This is the test product. Please, DO NOT BUY IT! This is the test product. Please, DO NOT BUY IT! This is the test product. Please, DO NOT BUY IT!

74% discount for the next 10 buyers (original price $605): 1 left
Get a 50% bonus by buying (or even renting) any of our products. After buying (or renting), send a message for more information. 3 Indicators in 1 indicator
Strategy based on price action
Made specifically for the best forex currency pairs
Can be used in the best time frame of the market
at a very reasonable price This indicator is basically 3 different indicatos . But we have combined these 3 indicators in 1 indicator so th

Introduction
The "Smart Money Concept" transcends the realm of mere technical trading strategies to embody a comprehensive philosophy on the dynamics of market operations. It posits that key market participants engage in price manipulation, thereby complicating the trading landscape for smaller, retail traders.
Under this doctrine, retail traders are advised to tailor their strategies in alignment with the maneuvers of "Smart Money" - essentially, the capital operated by market makers

Os candles do tipo Heikin Ashi são uma ferramenta poderosa para os traders, oferecendo uma visualização clara e suave das tendências do mercado. Diferente dos candles tradicionais, eles filtram o ruído do mercado, proporcionando uma visão mais limpa da direção e força do mercado, ajudando os traders a tomar decisões mais informadas. O indicador Hull Heikin Ashi Smoothed da Minions Labs leva isso um passo além, integrando a Hull Moving Average para maior suavização e precisão. Este indicador não

MultiFractal Levels MultiFractal Levels – é um indicador fractal modificado de Bill Williams com níveis adicionais. Os fractais são construídos a partir de todos os TFs permitidos nas configurações.
Os níveis são construídos apenas com base nos fractais mais recentes que ainda não foram testados por preço. Vantagens sobre o indicador terminal original: Conveniência Visibilidade Informatividade Níveis mais recentes Fractal personalizável Níveis personalizáveis O indicador é conveniente porque v

Contact me for instruction, any questions! Introduction The breakout and retest strategy is traded support and resistance levels. it involves price breaking through a previous level. The break and retest strategy is designed to help traders do two main things, the first is to avoid false breakouts. Many false breakouts start with a candlestick that breaks out of a level but ends with an immediate candlestick that brings the price back into the level. The second thing that the breakout and rete

Go with the trend. Yes, wait for an entry signal, whether buy or sell, and enter with the price, and the profit is taken when the drawing line changes, the profit is booked, or when an opposite signal appears. It is very simple and works on all currencies, metals, indices, and on all frames. How to enter? Wait for a buy or sell signal and enter with it. You can take or reserve profit after a change appears in the drawing line or the appearance of an opposite signal.

This is actually just a combination of 3 classic TTM_Squeeze indicators, nothing special. As I know exactly this is implemented in original TTM_Squeeze PRO indicator. It shows strong, middle and weak squeeze. If someone interested, TTM_Squeeze is not completely John Carter's invention. Concept of squeeze is commonly known as well as the method of squeeze search using Bollinger Bands and Kelthner Channels. How to use
As always there is a lot of variations. For example here is simple strategy Us
FREE

The indicator determines the ATR value (points) in a classic way (taking into calculation paranormal bars/candles) and more correctly - ignoring paranormal movements of the Instrument. Correctly it is excluding paranormal bars from the calculation, extremely small bars (less than 5%( customizable ) of the standard ATR) and extremely large bars (more than 150% ( customizable ) of the standard ATR) are ignored. This is a Extended version - allows you to set calculation parameters a

Overview
In the evolving landscape of trading and investment, the demand for sophisticated and reliable tools is ever-growing. The AI Trend Navigator is an indicator designed to meet this demand, providing valuable insights into market trends and potential future price movements. The AI Trend Navigator indicator is designed to predict market trends using the k-Nearest Neighbors (KNN) classifier.
By intelligently analyzing recent price actions and emphasizing similar values, it help

The Boom300 Spike Indicator is a powerful tool designed to identify significant price spikes in the market.
Key Features: Real-time Spike Detection: The indicator continuously scans the market for sudden spikes in price action, providing timely alerts when significant spikes occur. Customizable Alerts: Traders can customize alerts to suit their preferences, including audible alerts, email notifications, and push notifications to mobile devices. User-Friendly Interface: The indicator offers a

Description: The Spike Sniper Crash Market Indicator is a sophisticated tool designed to identify and navigate volatile market conditions, often associated with sudden price spikes and market crashes. Leveraging advanced algorithms and technical analysis, this indicator serves as a vigilant guardian, alerting traders to potential market disruptions and providing actionable insights to mitigate risks and capitalize on opportunities. Key Features: Precision Spike Detection: The indicator employs c
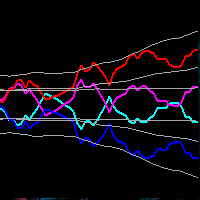
This indicator obeys the popular maxim that: "THE TREND IS YOUR FRIEND" Channel indicators incorporate volatility to capture price action. The Bollinger Bands is widely used, however, there are other options to capture swing action opportunities. Each study you will find here is unique, and reveals different types of price action.
https://www.mql5.com/en/market/product/116256
https://www.mql5.com/en/market/product/115553
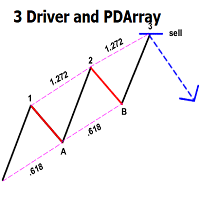
This indicator automatically identifies the SMC 3-Drive pattern and sends notifications to users when the pattern is detected. Additionally, the indicator identifies PDArray (including FVG and OB) and offers an option to combine the 3-Drive pattern with PDArray. This combination provides users with more reliable signals. What is the 3-Drive Pattern? This pattern is formed by three price pushes in one direction, providing a strong reversal signal (Figure 3). The key to identifying this pattern is

This is the MT5 version of Ku-Chart.
This is an indicator devised by Ku-chan, a famous Japanese trader, based on the dealings of Lehman Brothers' discretionary traders. Unify the measuring stick of currencies to display the true value of currencies.
Although it is an indicator, it does not use a buffer and is displayed using objects such as trend lines. Also, instead of drawing on the subchart, it is drawn in an area far above the current price of the main chart, so you can switch from the

TMA CG FAST MT4 REPLICADO PARA MT5 Cuenta con todas las caracteristicas del original con la funcion adicional de tener señal al fallo que consiste en que despues de una cantidad de velas establecida por el usuario emita una preseñal para una potencial entrada tiene alerta sonora para la posible entrada y la entrada definitiva tiene la posibilidad de repintar o no , queda a eleccion de usuario

Introducing our state-of-the-art Wave Indicator, meticulously designed for the discerning traders of the MQL5 community! At the core of this innovative tool lies an unmatched sensitivity to capture even the slightest market movements. Our Wave Indicator serves as the foundational element for constructing comprehensive trading strategies, providing you with an unwavering edge in the dynamic world of finance. Whether you're aiming to refine short-term tactics or develop long-term systems, this ind
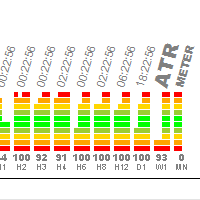
O indicador é projetado para determinar rapidamente a volatilidade de um instrumento. É muito conveniente alterar os gráficos para entender imediatamente em quais instrumentos e períodos de tempo há uma negociação animada, e onde ocorre a calmaria. O indicador usa os dados do indicador ATR convertidos em juros. Se você colocar o ATR no gráfico, cerca de 100-300 barras serão visíveis na tela, eu calculei a média desse valor e defini 150 por padrão (você pode alterar nas configurações a seu crité

Claro, aqui está a tradução para o português: Apresentando o Indicador de Astronomia para MT4 / MT5 : Seu Companheiro Celestial Definitivo no Trading Você está pronto para elevar sua experiência de trading a alturas celestiais? Não procure mais do que o nosso revolucionário Indicador de Astronomia para MT4. Essa ferramenta inovadora transcende os indicadores de trading tradicionais, aproveitando o poder de algoritmos complexos para fornecer insights astronômicos incomparáveis e cálculos de pre

Certainly! Let me introduce you to a powerful tool for MetaTrader 5 (MT5) that can automatically identify and draw support and resistance (S&R) levels on your trading charts. This tool is called the “Support and Resistance Levels Guru” . Support Resistance Levels Guru The Support & Resistance Indicator automatically displays essential S&R levels on your chart. These levels are crucial for technical analysis and are used by many traders. Resistance levels (zones) are shown in R ed , while suppo
FREE
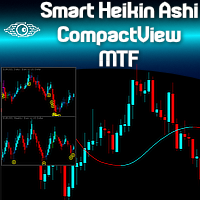
Você já é fã da ferramenta de análise de gráficos Minions Labs Smart Heikin Ashi ? Ou talvez esteja procurando um gráfico Heikin Ashi versátil que funcione em múltiplos períodos de tempo? Quer ver o panorama geral antes de se aprofundar nos detalhes para tomar decisões mais inteligentes de ENTRADA? Deseja construir seu próprio Painel de Ativos dentro de apenas um ÚNICO gráfico, sem lidar com a confusão das múltiplas janelas do MT5? Bem-vindo ao indicador Minions Labs Smart Heikin Ashi CompactVi

Highly configurable Trader Dynamic Index (TDI) indicator.
Features: Highly customizable alert functions (at levels, crosses, direction changes via email, push, sound, popup) Multi timeframe ability (higher and lower timeframes also) Color customization (at levels, crosses, direction changes) Linear interpolation and histogram mode options Works on strategy tester in multi timeframe mode (at weekend without ticks also) Adjustable Levels Parameters:
TDI Timeframe: You can set the lower/higher
FREE

Liquidity Pro The Liquidity Pro pin points liquidity zones in any financial instrument, including currency pairs, cryptocurrencies, commodities, equities and indices. The Liquidity Pro shows previous and current liquidity zones, down to the present minute, providing essential information about your chosen trading pair, when conducting chart analysis or initiating trades. The Liquidity Pro allows you to observe where price consolidates, retraces, resists, or settles within support areas. It pinp
The indicator determines the ATR value (points) in a classic way (taking into calculation paranormal bars/candles) and more correctly - ignoring paranormal movements of the Instrument. Correctly it is excluding paranormal bars from the calculation, extremely small bars (less than 5% of the standard ATR) and extremely large bars (more than 150% of the standard ATR) are ignored. The Extended version - allows you to set calculation parameters and a lot of other input parameters Version for МТ4 ->

The Supernova Momentum indicator facilitates visual perception of the price chart and reduces the time spent on analysis: the absence of a signal means the absence of a transaction, and when an opposite signal appears, it is recommended to close the current position. This arrow indicator is designed to determine the trend.
The indicator implements a trend trading strategy, provides filtering and includes all the necessary functions in one tool! Its operating principle is to automatically dete

Introduction
"Smart money" is money invested by knowledgeable individuals at the right time, and this investment can yield the highest returns.
The concept we focus on in this indicator is whether the market is in an uptrend or downtrend. The market briefly takes a weak and reversal trend with "Minor BoS" without being able to break the major pivot.
In the next step, it returns to its main trend with a strong bullish move and continues its trend with a "Major BoS". The "order bloc

The Ultimate Trend and Reversals Detector The Ultimate Trend and Reversals Detector is a powerful tool designed to identify potential trend reversal zones in the financial markets. Here are the key features: Objective : Detect trend directions and reversals. Signal Colors : Green : Indicates a potential bullish trend reversal. Red : Signals a potential bearish trend reversal. Non-Repainting : The indicator’s signals are not redrawn, providing reliable information. Suitable for All Styles : Scal

Using the Future Trend indicator, you can predict the future price movement a certain number of bars ahead. This indicator creates a line depicting simulated future price values, providing you with valuable information for making decisions about entering or exiting the market, and for setting or adjusting stop losses accompanying your position.
In addition, the Future Trend indicator has several parameters: HistoricBars - determines the number of historical bars that are used for analysis. Fu

Introduction
The "Smart Money Concept" transcends mere technical trading strategies; it embodies a comprehensive philosophy elucidating market dynamics. Central to this concept is the acknowledgment that influential market participants manipulate price actions, presenting challenges for retail traders.
As a "retail trader", aligning your strategy with the behavior of "Smart Money," primarily market makers, is paramount. Understanding their trading patterns, which revolve around supply

FOTSI (Forex Overview True Strength Index) for MT5! FOTSI is an indicator that analyzes the relative strength of currencies in major Forex pairs. It aims to anticipate corrections in currency pairs following strong trends by identifying potential entry signals through overbought and oversold target areas. Theoretical Logic of Construction: Calculation of Individual Currency Momentum: FOTSI starts by calculating the momentum for each currency pair that includes a specific currency, then aggregat

PMax is a brand new indicator developed by KivancOzbilgic in earlier 2020.
It's a combination of two trailing stop loss indicators;
One is Anıl Özekşi's MOST (Moving Stop Loss) Indicator and the other one is well known ATR based SuperTrend. Both MOST and SuperTrend Indicators are very good at trend following systems but conversely their performance is not bright in sideways market conditions like most of the other indicators.
Profit Maximizer - PMax tries to solve this problem. PMax

The indicator illustrates the divergence between the price movements of two financial instruments, such as EURUSD and GBPUSD or US500 and US30 or Gold and Silver. These divergences are plotted in the form of segments on the price chart of the dominant instrument. The dominant instrument refers to the one that exhibits a stronger bullish trend in the case of a bullish divergence, or a stronger bearish trend in the case of a bearish divergence. Investors are encouraged to independently seek correl
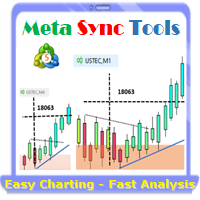
Supercharge Your MetaTrader Analysis and Trading with Meta Sync Tools! Struggling to analyze price action across different timeframes? Meta Sync Tools eliminates the frustration of unsynced crosshairs and charts, allowing seamless multi-timeframe analysis. Missing key correlations between assets and constantly switching between charts? Meta Sync Tools empowers you to visualize relationships between instruments effortlessly. Tired of wasting time on repetitive tasks? With 30+ Customizable Short
O Mercado MetaTrader contém robôs de negociação e indicadores técnicos para traders, disponíveis diretamente no terminal.
O sistema de pagamento MQL5.community está disponível para todos os usuários registrados do site do MQL5.com para transações em todos os Serviços MetaTrader. Você pode depositar e sacar dinheiro usando WebMoney, PayPal ou um cartão de banco.
Você está perdendo oportunidades de negociação:
- Aplicativos de negociação gratuitos
- 8 000+ sinais para cópia
- Notícias econômicas para análise dos mercados financeiros
Registro
Login
Se você não tem uma conta, por favor registre-se
Para login e uso do site MQL5.com, você deve ativar o uso de cookies.
Ative esta opção no seu navegador, caso contrário você não poderá fazer login.