YouTubeにあるマーケットチュートリアルビデオをご覧ください
ロボットや指標を購入する
仮想ホスティングで
EAを実行
EAを実行
ロボットや指標を購入前にテストする
マーケットで収入を得る
販売のためにプロダクトをプレゼンテーションする方法
MetaTrader 5のための新しいテクニカル指標

この強力なツールは、トレンドラインを自動的に識別し、取引戦略を合理化し、より多くの情報に基づいた決定を下すのに役立ちます。 mt4バージョン
重要な機能 自動トレンドライン検出 :「基本的なトレンドライン」インジケーターは、潜在的なトレンドラインの市場をスキャンし、チャートに即座に表示します。これにより、貴重な時間を節約し、重要な傾向を見逃すことはありません。 ユーザーフレンドリーパネル :私たちのインジケータには、さまざまなトレンドラインを簡単に描画できる美しく直感的なパネルが付属しています。パネルは、すべてのエクスペリエンスレベルのトレーダー向けに設計されているため、数回クリックしてトレンドラインを追加、編集、または削除できます。 お気に入りのトレンドラインを保存して管理 :あなたにとって最も重要なトレンドラインを追跡します。私たちのインジケータを使用すると、好みのトレンドラインを保存し、チャートを再訪するたびに常に利用できるようにします。 汎用アプリケーション :外国為替、株、または暗号通貨を取引しているかどうかにかかわらず、「基本的なトレンドライン」インジケーターはさまざま

MSnR Lines は、サポートとレジスタンスの水準をチャート上に表示するカスタムインジケーターです。これらの水準は、マレーシアのSNR理論に基づいています。この理論では、水準は特定の価格水準を指し、エリアではありません。これらの価格水準は、ラインチャートのピークと谷に基づいています。 特徴: A-Level、V-Level、ギャップレベルの3つの種類の水準。 水準の新鮮さインジケータ:新鮮な水準は、未テストの水準や取引された水準よりも重要です。 新鮮な水準と新鮮でない水準の色とスタイルをカスタマイズ可能。 新鮮な水準のみを表示するか、すべての水準を表示するかを選択できます。 バックテスト期間と現在の価格上下の水準の数を調整可能。 複数のタイムフレームをサポート。 用途:
トレーダーは、MSnR Linesを使用して潜在的なサポートとレジスタンスの水準を識別し、取引の意思決定を行うことができます。新鮮な水準はより重要であり、より良い取引機会を提供する可能性があります。また、異なるタイムフレームの水準を使用してマルチタイムフレーム分析を行い、取引の精度と信頼性を向上させることがで
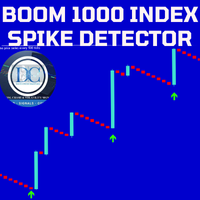
Our Spike Detector is specifically engineered to cater to the unique needs of traders in the Boom and Crash indices markets. This tool is optimized for M1 (1-minute) and M5 (5-minute) timeframes, ensuring you receive timely and actionable insights.
Key Features: 1. **Non-Repainting**: Our detector guarantees accuracy with non-repainting signals, ensuring your data remains consistent and reliable. 2. **Push Notifications**: Stay updated with real-time push notifications, so you never miss a cr

Divergence Force 1.0 ダイバージェンスインジケーター 1.0 説明 Divergence Force 1.0 は、資産の価格とMACD(移動平均収束拡散)との間のダイバージェンスを識別するために設計されたインジケーターです。このインジケーターは、価格とMACDの高値と安値に自動的にトレンドラインを描き、潜在的な取引機会を強調します。 主な機能 ダイバージェンスの自動識別 : インジケーターは、価格とMACDの間の強気と弱気のダイバージェンスを自動的に検出します。 トレンドラインの追跡 : 価格の連続する高値と安値に自動的にトレンドラインを描き、MACDの高値と安値と比較します。 買いと売りのシグナル : ダイバージェンスが識別されると、グラフに明確に買い("Buy")と売り("Sell")のシグナルを表示します。ダイバージェンスが検出されない場合は"Neutral"を表示します。 標準MACDパラメータ : 標準のMACDパラメータ(12, 26, 9)を使用して計算し、信頼性のある認知された結果を保証します。 異なるタイムフレームとの互換性 : 1時間のタイムフレ
FREE
===>この指標は何をしますか? これは出来高で重み付けされた移動平均であり、交換された出来高に応じて正確に平滑化されます。
時間枠を選択して単一の WWMA 平均をプロットします。
平均するために必要な回数だけ、このインジケーターをチャート上にドロップします。
平均値のパラメーターと特性を選択するだけです。 ****スクリーンショット01〜02を参照してください
この平均をあなた自身のコード、別のインジケーター、またはEAに簡単に統合するためのICUSTOMコードを私に尋ねることを躊躇しないでください
選ぶ ターゲットの時間枠 期間数 遅延 望ましいOHLC トレンディな色 「William210」という名前で、CodeBaseとMarketplaceですべての出版物を見つけることができます。
===>いくつかの例 マルチフレームモバイル平均を使用する簡単な例を次に示します
ビットコインの例 2つのモバイルを追加する平均20、1つは毎日1つ、H6に1つをH1に表示します **** 3〜5のスクリーンショットを参照してください
S&P500の例 3つの
===>この指標は何をしますか? 時間枠を選択して単一の VEMA 平均をプロットします。
出来高加重指数移動平均 (VEMA) は、最近のデータと出来高の多いバーにより重点を置いた移動平均です。
これは、大量のバーの価格変動がVEMAに大きな影響を与えることを意味します。
平均するために必要な回数だけ、このインジケーターをチャート上にドロップします。
平均値のパラメーターと特性を選択するだけです。 ****スクリーンショット01〜02を参照してください
この平均をあなた自身のコード、別のインジケーター、またはEAに簡単に統合するためのICUSTOMコードを私に尋ねることを躊躇しないでください
選ぶ ターゲットの時間枠 期間数 遅延 望ましいOHLC トレンディな色 「William210」という名前で、CodeBaseとMarketplaceですべての出版物を見つけることができます。
===>いくつかの例 マルチフレームモバイル平均を使用する簡単な例を次に示します
ビットコインの例 2つのモバイルを追加する平均20、1つは毎日1つ、H6に1つをH1に
=== > このインジケーターは何をするのですか? ATRに基づいてスーパートレンドを表すラインを描きます。
選ぶ ATR倍率 ATR期間 それがすべてです!!! **** スクリーンショット 01 から 2 を参照
この SuperTrend を独自のコードに簡単に統合するための iCustom コードについて、お気軽にお問い合わせください。
=== > ビットコインの例 **** スクリーンショット 03 を参照
=== > 誰のため? あなたが裁量トレーダー、アルゴリズムトレーダー、または開発者であっても、インジケーターはあなたのニーズを満たすように設計されています。私はお金が関係する場合、信頼性と効率性の重要性を理解しており、この責任を非常に真剣に受け止めています。
インジケーターは PC または VPS 上のリソースをほとんど消費しません。
アルゴリズムトレーダーと開発者のために、両方のバッファへの完全なアクセスを提供します。 SuperTrend 値用のバッファ 1 スーパートレンドの方向用のバッファ 2
=== > なぜですか? ATR の

PyNinjaTrader - NinjaTrader 8 用のドラッグ アンド ドロップ Python API コネクタ
PyNinjaTrader は、シンプルなドラッグ アンド ドロップ戦略を使用して、Python スクリプトを NinjaTrader 8 にシームレスに接続します。この完全にテストされた高速で効率的なソリューションは、通信に Websocket を使用し、戦略がサーバーとして機能し、Python スクリプトがクライアントとして機能します。
機能: - NinjaTrader 8 ターミナルへの Python ログイン - 継続的な接続のためのキープアライブ機能 - Python クライアントへの NinjaTrader 8 アカウント情報の取得 - Python から直接注文をオープン、変更、クローズ - 静的および動的なアカウント情報にアクセス - 包括的な市場データと実行情報を取得 - バー データをダウンロードし、1 行のコードでライブ フィードを作成 - apextrading アカウントの特別割引 - 最大 90% 割引!
インストール:

Introducing our exciting new Price Retest indicator! Get instant alerts when the price retests, giving you a powerful edge in your trading strategy. Remember to do your own analysis before making any moves in the market. MT4 Version - https://www.mql5.com/en/market/product/118031 Here’s a detailed explanation of how the Price Retest indicator works, its components, and how you can incorporate it into your trading strategy: The Price Retest indicator is designed to notify traders when the price
FREE

KMeans Price Zones Detector を使ったトレーディングの未来へようこそ。これは、機械学習の力を利用して主要な価格ゾーンを特定する革新的なMetaTrader指標です。このツールは、価格データ内の重心を動的に検出するためにKMeansクラスタリングアルゴリズムを利用し、価格がサポート、レジスタンス、または統合に遭遇しやすいエリアを強調します。 革新的なKMeansアルゴリズム KMeans Price Zones Detectorは、パターン認識においてその効率と精度で知られる機械学習の基本であるKMeansクラスタリングアルゴリズムを高度に活用することで際立っています。過去の価格データを分析することで、この指標は重要な価格レベルを表すクラスタまたは重心を識別します。これらの重心を使用してサポートとレジスタンスゾーンを計算し、トレーダーに価格の反転、ブレイクアウト、および統合の可能性に関する重要な情報を提供します。 主な特徴 動的ゾーン検出: 指標は最新の市場データに基づいて価格ゾーンを継続的に更新し、トレーダーが常に最も関連性の高い情報を持つことを保証します。

Bem-vindo a uma nova era de trading com o indicador AI Moving Average, um avançado indicador do MetaTrader 5 projetado para fornecer aos traders insights preditivos sobre os movimentos do mercado. Esta ferramenta combina o poder da IA com a confiabilidade de uma média móvel exponencial sem atraso para oferecer previsões precisas e oportunas das tendências futuras dos preços. Modelo Inovador de Regressão Linear O AI Moving Average aproveita um modelo de aprendizado de máquina de regressão linear
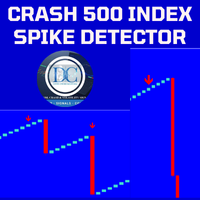
Spike Detector for Boom and Crash Indices
The Spike Detector is specifically designed to cater to the unique needs of traders in the Boom and Crash indices markets. Optimized for M1 (1-minute) and M5 (5-minute) timeframes, this tool ensures you receive timely and actionable insights. Below, you'll find a comprehensive guide on its key features, advantages, installation process, and how to use it effectively.
Key Features and Advantages
1. Non-Repainting: The Spike Detector guarantees accu
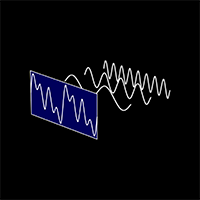
The "Cycle Extraction" indicator for MetaTrader 5 uses the Fast Fourier Transform (FFT) to discern cycles in financial time series. It facilitates the configuration of parameters such as the maximum number of bars, moving average settings, and specification of frequency thresholds, optimizing the analysis of repetitive market phenomena. Instructions Input Settings : Adjust variables such as Bar Count, Period, Method, and Applied to Price to customize the analysis to the user's needs. Data Visual
FREE
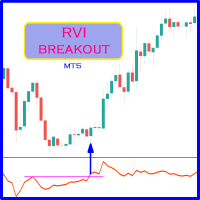
Probability emerges to record higher prices when Relative Vigor Index early breaks out oscillator historical resistance level when exhibit overbought values. It's strongly encouraged to confirm price breakout with oscillator early breakout since they have comparable effects to price breaking support and resistance levels; short trades will undoubtedly result in the same outcome. RVi oscillator breakout has advantage at ranging trend (trending horizontally) as only early breakout signals that nee
FREE

Introducing the Raymond Cloudy Day indicator, a groundbreaking tool conceived by Raymond and brought to life on the MT5 platform by my coding expertise. This state-of-the-art indicator revolutionizes trading strategies by combining the robustness of an innovative calculation method that goes beyond traditional Pivot Points, with the precision of advanced algorithms. Key Features: Innovative Calculation Method : At the heart of the Raymond Cloudy Day indicator is a novel calculation meth
FREE

Probability emerges to record higher prices when Relative Vigor Index early breaks out oscillator historical resistance level when exhibit overbought values. It's strongly encouraged to confirm price breakout with oscillator early breakout since they have comparable effects to price breaking support and resistance levels; short trades will undoubtedly result in the same outcome. RVi oscillator breakout has advantage at ranging trend (trending horizontally) as only early breakout signals that ne
FREE

Live Trading Results MT4 Version Contact for Manual Guide Next Price $125 Hello Everyone, We are excited to introduce one of the most reliable and high win rate patterns in trading: the Cup and Handle . This is the first time we are releasing this meticulously crafted indicator, boasting an impressive 95% success rate . It is versatile and effective across all types of pairs, stocks, indices, bonds, and futures.
This pattern represents the most complex code we have developed t

Our Spike Detector is specifically engineered to cater to the unique needs of traders in the Boom and Crash indices markets. This tool is optimized for M1 (1-minute) and M5 (5-minute) timeframes, ensuring you receive timely and actionable insights.
Key Features:
1. **Non-Repainting**: Our detector guarantees accuracy with non-repainting signals, ensuring your data remains consistent and reliable. 2. **Push Notifications**: Stay updated with real-time push notifications, so you never miss a
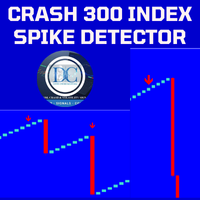
Spike Detector for Boom and Crash Indices
The Spike Detector is specifically designed to cater to the unique needs of traders in the Boom and Crash indices markets. Optimized for M1 (1-minute) and M5 (5-minute) timeframes, this tool ensures you receive timely and actionable insights. Below, you'll find a comprehensive guide on its key features, advantages, installation process, and how to use it effectively.
Key Features and Advantages
1. Non-Repainting: The Spike Detector guarantees accu
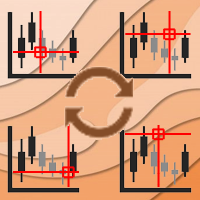
Async Charts is an indicator to synchronize charts and display a customized crosshair (cursor) on all selected charts. This is a useful utility for traders using multiple timeframes of analyzing multiple symbols for trade entry or exit.
Main Features : Real time Crosshair Synchronization on All Selected Charts
Supports Multiple Timeframes and Multiple Symbols at the same time
Auto Scroll Option
Graphical Adjustment of Color, Font, Size, ...
Locking All or Locking Specific Charts
More and
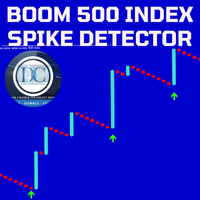
Our Spike Detector is specifically engineered to cater to the unique needs of traders in the Boom and Crash indices markets. This tool is optimized for M1 (1-minute) and M5 (5-minute) timeframes, ensuring you receive timely and actionable insights.
Key Features:
1. Non-Repainting**: Our detector guarantees accuracy with non-repainting signals, ensuring your data remains consistent and reliable. 2. Push Notifications**: Stay updated with real-time push notifications, so you never miss a cr

** Attention! This indicator is a market tool that can lead to substantial losses; use it at your own risk ** Operation: Histograms with positive or negative values, where positive means possible strength of the current movement, and negative means possible weakness. Colors: red indicates relative strength to the downside, green indicates an upward movement, and yellow indicates an alert state! The calculation period can be adjusted to your liking! I recommend using it on a demo account before u

Sync Cursor MT5 | MT4 Sync Cursor MT4 https://www.mql5.com/en/market/product/118067 MT5 Tool will It make the Horizontal Line + Vertical Line in the Screen That it is always present on the screen and that it moves along with the candle (with the price). I am sure that something so simple will be a Treasure in the hands of many people.
Some of my personal trades are posted voluntary and free of charge in this Public channel https://t.me/FXScalpingPro
Contact: https://t.me/TuanNguyenTrader
FREE

This indicator shows the engulfing pattern, which is the most direct manifestation of capital flow. Engulfing Pattern is a common price reversal pattern in technical analysis, which usually appears at the end of a price trend or at key support and resistance levels. It can be divided into two types: Bullish Engulfing Pattern and Bearish Engulfing Pattern. Bullish Engulfing Pattern feature: Previous K-line: This is the negative line of a small entity (the opening price is higher than the closing

Trend reversal identification: The K-line countdown indicator helps traders capture trend reversal signals by identifying excessive buying and selling behavior in the market. This indicator is particularly effective when the market is in extreme states. Risk management: This indicator can help traders identify potential risks in the market before the trend reverses and adjust positions in time to avoid losses. For example, you might consider reducing your long position when a bullish countdown c
The Interactive RSI indicator can generate RSI divergence with the availability of user defined filters. It can generate voice alerts for RSI oversold and RSI Overbought situations. Moreover it can also generate voice alerts for RSI Divergneces as well as when price breaks above or breaks below the support and resistances created upon divergence ouccurence. The voice alerts are generated in a way that you will know which market has reached the oversold and overbought conditions as well as the r
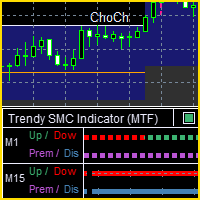
The Trendy SMC ( MTF ) indicator monitors trends and SMC concepts from multiple timeframes, allowing you to see what's happening from different perspectives, but on the one chart.
It is designed to help with a range of trading strategies related to trends and SMC concepts (such as Premium / Discount prices, Fib retracement levels and Fair Value Gaps). Features include:
Determining the trend based on market structure (breaks of highs and lows) Displaying the current trading range (between the

Индикатор тиковых объемов представляет собой инструмент технического анализа, используемый для оценки активности трейдеров на рынке. Этот индикатор отображает количество тиков (изменений цен) за определенный временной период и показывает преобладание тиков, направленных на покупку или продажу.
Основные характеристики и функции индикатора тиковых объемов: Гистограмма объемов:
Белый цвет: Означает преобладание тиков, направленных на покупку. Когда количество покупок превышает количество прода

Basic Support and Resistance インジケータは、テクニカル分析を強化するために必要なソリューションです。このインジケータを使用すると、チャートにサポートレベルとレジスタンスレベルを投影できます/ mt4バージョン
機能
フィボナッチレベルの統合: サポートと抵抗レベルとともにフィボナッチレベルを表示するオプションを使用すると、私たちの指標は市場行動と逆転領域の可能性についてさらに深い洞察を提供します。
パフォーマンスの最適化: 各バーの開口部のみで拡張ラインを更新するオプションを使用すると、インジケータは、サポートレベルと抵抗レベルの精度を犠牲にすることなく最適なパフォーマンスを保証します。
入力 メイン設定 Timeframe: この入力を通じて、より高い時間枠のサポートラインとレジスタンスラインをチャート上に表示することを選択できます。 Support/Resistance Strength [Number of Bars]: この入力を使用して、サポートと抵抗の強度を決定できます。数が高いほど、サポート/抵抗がより強くなります。
===>この指標は何をしますか? 彼は時間枠を選択して平均SMAを1つだけ描いています
このインジケーターをグラフィックに、平均が必要な場合に何度も配置します。
平均のパラメーターと特性を選択してください。 ****スクリーンショット01〜02を参照してください
この平均をあなた自身のコード、別のインジケーター、またはEAに簡単に統合するためのICUSTOMコードを私に尋ねることを躊躇しないでください
選ぶ ターゲットの時間枠 期間数 遅延 望ましいOHLC トレンディな色 「William210」という名前で、CodeBaseとMarketplaceですべての出版物を見つけることができます。
===>いくつかの例 マルチフレームモバイル平均を使用する簡単な例を次に示します
ビットコインの例 2つのモバイルを追加する平均20、1つは毎日1つ、H6に1つをH1に表示します **** 3〜5のスクリーンショットを参照してください
S&P500の例 3つのモバイルを追加して、毎日の高、中央値の価格に適用され、H1を見てください **** 6〜7のスクリーンシ
===>この指標は何をしますか? 彼は時間枠を選択して平均EMAを1つだけ描いています
このインジケーターをグラフィックに、平均が必要な場合に何度も配置します。
平均のパラメーターと特性を選択してください。 ****スクリーンショット01〜02を参照してください
この平均をあなた自身のコード、別のインジケーター、またはEAに簡単に統合するためのICUSTOMコードを私に尋ねることを躊躇しないでください
選ぶ ターゲットの時間枠 期間数 遅延 望ましいOHLC トレンディな色 「William210」という名前で、CodeBaseとMarketplaceですべての出版物を見つけることができます。
===>いくつかの例 マルチフレームモバイル平均を使用する簡単な例を次に示します
ビットコインの例 2つのモバイルを追加する平均20、1つは毎日1つ、H6に1つをH1に表示します **** 3〜5のスクリーンショットを参照してください
S&P500の例 3つのモバイルを追加して、毎日の高、中央値の価格に適用され、H1を見てください **** 6〜7のスクリーンシ
===>この指標は何をしますか? 彼は時間枠を選択して平均SMMAを1つだけ描いています
このインジケーターをグラフィックに、平均が必要な場合に何度も配置します。
平均のパラメーターと特性を選択してください。 ****スクリーンショット01〜02を参照してください
この平均をあなた自身のコード、別のインジケーター、またはEAに簡単に統合するためのICUSTOMコードを私に尋ねることを躊躇しないでください
選ぶ ターゲットの時間枠 期間数 遅延 望ましいOHLC トレンディな色 「William210」という名前で、CodeBaseとMarketplaceですべての出版物を見つけることができます。
===>いくつかの例 マルチフレームモバイル平均を使用する簡単な例を次に示します
ビットコインの例 2つのモバイルを追加する平均20、1つは毎日1つ、H6に1つをH1に表示します **** 3〜5のスクリーンショットを参照してください
S&P500の例 3つのモバイルを追加して、毎日の高、中央値の価格に適用され、H1を見てください **** 6〜7のスクリーン
===>この指標は何をしますか? 彼は時間枠を選択して平均LWMAを1つだけ描いています
このインジケーターをグラフィックに、平均が必要な場合に何度も配置します。
平均のパラメーターと特性を選択してください。 ****スクリーンショット01〜02を参照してください
この平均をあなた自身のコード、別のインジケーター、またはEAに簡単に統合するためのICUSTOMコードを私に尋ねることを躊躇しないでください
選ぶ ターゲットの時間枠 期間数 遅延 望ましいOHLC トレンディな色 「William210」という名前で、CodeBaseとMarketplaceですべての出版物を見つけることができます。
===>いくつかの例 マルチフレームモバイル平均を使用する簡単な例を次に示します
ビットコインの例 2つのモバイルを追加する平均20、1つは毎日1つ、H6に1つをH1に表示します **** 3〜5のスクリーンショットを参照してください
S&P500の例 3つのモバイルを追加して、毎日の高、中央値の価格に適用され、H1を見てください **** 6〜7のスクリーン

RAR(Relative Adaptive RSI)インディケーターでトレーディング戦略を最適化しましょう! この高度なテクニカル分析インディケーターは、相対力指数(RSI)の力を適応技術と組み合わせ、一般的なオシレーターよりも正確で信頼性の高いシグナルを提供します。 RARインディケーターとは? RARはMetaTrader 5用に設計されたインディケーターで、指数移動平均(EMA)と適応移動平均(AMA)を使用してRSIを平滑化し、市場の状況に動的に適応させます。この革新的な組み合わせにより、市場のトレンドと強さの変化をより正確かつ迅速に検出することができます。 RARインディケーターの利点 動的適応性 : RARは市場の変化する条件に自動的に適応し、従来のRSIと比較してシグナルの精度を向上させます。 市場ノイズの削減 : EMAとAMAを使用してRSIを平滑化し、市場ノイズを減少させ、より明確で信頼性の高いシグナルを提供します。 直感的な視覚化 : カラーヒストグラムを含み、市場のトレンドと強さの変化を識別しやすくし、より情報に基づいたトレーディングの意思決定を支援します。 効
Engulfing Candle Signal Alert: Elevate Your Trading Strategy Unlock the full potential of your trading with the Engulfing Candle Indicator, the ultimate tool for identifying market reversals and enhancing your trading precision. Designed specifically for traders who value accuracy and timely alerts, this powerful indicator detects engulfing candle patterns, a key signal in technical analysis that often indicates a potential shift in market direction. What is an Engulfing Candle?
An engulfing ca
FREE
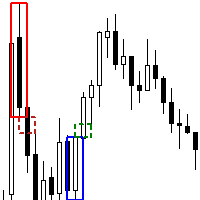
The Order Block FVG Box indicator for MetaTrader 5 is a powerful tool designed for discerning traders looking to identify and capitalize on high-probability trading opportunities. This indicator excels at pinpointing valid Order Blocks that are immediately followed by Fair Value Gaps (FVG), enhancing your trading strategy with precise visual cues. Key Features: Order Block Identification : Detects valid Order Blocks, which are significant areas where institutional buying or selling has occurred,
FREE
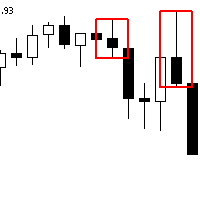
The Advanced Order Block Indicator for MetaTrader 5 is designed to enhance technical analysis by identifying significant order blocks that sweep liquidity and create Fair Value Gaps (FVG) when pushing away. This indicator is ideal for traders who focus on institutional trading concepts and wish to incorporate advanced order flow and price action strategies into their trading routine. Overview Order Block Identification : An order block represents a price area where a substantial number of orders
FREE

The Multi Asset Monitor Panel is a game-changer for traders who need to keep an eye on multiple markets simultaneously. This innovative panel allows you to monitor any symbol and any timeframe you need, all within a single, organized interface. With up to three lists of symbols and customizable MT5 templates, you can tailor your monitoring setup to fit your specific trading strategy. What sets the Multi Asset Monitor Panel apart is its flexibility and customization options. You can control the s

Conquistador is a fundamental technical indicator designed to assess the current market situation and determine the optimal entry and exit points in the currency pairs market with minimal risk. This indicator was created on the basis of original indicators for searching for extremes and is excellent for determining a reversal or sharp movement of the market. Thanks to Conquistador, you can recognize such moments in a timely manner and receive notifications in the form of colored dots on the cha

This indicator can be used to help learn the Al Brooks 'bar counting system'. It finds and labels H, L, Outside and Inside bars. H / L Bars: Finds and labels 'H' and 'L' at entry bars. The signal bar is the previous bar. (does not count bars/legs...you'll have to do your own counting for L1 L2...H1 H2 etc.) Finds and flags inside bars with '+' and outside bars with 'E'.
FREE

Product Description: Adaptive Y-Axis Scaling is a powerful MT5 indicator designed to enhance your trading experience by providing precise control over the Y-axis (price) scaling of your charts. This innovative tool allows you to customize the price scaling by specifying the number of pips from the visible chart's highs and lows. The calculated price range from this input is then used to set the maximum and minimum prices for the open chart, ensuring an optimized and comprehensive view of market
FREE

O LIVRO VISUAL é uma ferramenta que auxilia na identificação de escoras e renovação de ordens, para quem opera Tape Reading ou fluxo no gráfico é uma excelente ferramenta. Porem ele funciona somente em Mercados Centralizados ou com profundidade nível 2. É de fundamental importância você saber que ele não funciona em Mercado de FOREX. Porem pode ser utilizado no Mercado da B3.

The purpose of the remaining time indicator on the K-line is to assist traders in gaining a deeper understanding of market dynamics and making more precise trading decisions, particularly in the realm of forex and binary short-term trading. The significance of this indicator and its application to various trading strategies will be thoroughly examined below: Enhancement of Trading Timing Accuracy - Precision: By displaying the remaining time of the current K-line cycle, traders can achieve great
FREE
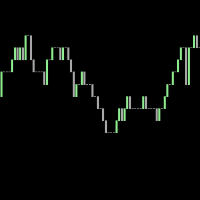
This is a tick indicator which compares the current bid price with the previous bid directly before it, and draws candles based on a comparison of the current ticks. It does not use historical ticks. Everything happens in real time, data moves from right to left, and the newest data arrives at the right. A trend line can be added which points in the direction of the price shifts.
FREE

This simple yet remarkably effective trend-continuation and breakout indicator acts as a powerful tool designed to aid traders in distinguishing genuine trend extensions from false breakouts. Through the utilization of a unique three-time-unit correctional phase guideline, it provides clear signals, offering trading opportunities with attractive risk-reward ratios.
Key Features Reliable Signals: The indicator confirms a genuine trend continuation or breakout if the price continues to trade h
>>> BIG SALE PROMOTION: 50% OFF + GIFT EA! - Promo price: $64 / Regular price $129 <<< - The promotion will end soon!
The Forex Trend Tracker is an advanced tool designed to enhance the trading capabilities of forex traders. This sophisticated indicator uses complex mathematical formulas alongside the Average True Range (ATR) to detect the beginnings of new upward and downward trends in the forex market. It offers visual cues and real-time alerts to give traders a competitive advantage in th

This spread indicator displays the actual spread of each candle. It highlights the maximum spread and the minimum spread of the chosen symbol. This indicator is very helpful to see in real time the spread evolution helping to avoid taking a trade when the spread is too high.
Inputs:
Print value in Points: if true displays the spread as a whole number
D isplay minimum and maximum spread of the past N days: select the number of days to consider the maximum and minimum spread
Automatically

Description of the Indicator The indicator "BullsBearsPulse" is designed for MetaTrader 5 and provides a visual representation of the Bulls Power and Bears Power indicators. These indicators are useful tools for technical analysis, particularly for the EUR/USD currency pair, to help traders identify potential trading opportunities. Functionality Bulls Power : This indicator measures the strength of the bulls (buyers) in the market. It calculates the difference between the highest price and a 20

The Engulf Seeker indicator is a powerful tool designed to detect engulfing candlestick patterns with precision and reliability. Built on advanced logic and customizable parameters, it offers traders valuable insights into market trends and potential reversal points.
Key Features and Benefits: Utilizes revised logic to analyze previous candles and identify strong bullish and bearish engulfing patterns. Convenient arrow-based alert system notifies traders of pattern occurrences on specific symb

This is the test product. Please, DO NOT BUY IT! This is the test product. Please, DO NOT BUY IT! This is the test product. Please, DO NOT BUY IT! This is the test product. Please, DO NOT BUY IT! This is the test product. Please, DO NOT BUY IT! This is the test product. Please, DO NOT BUY IT! This is the test product. Please, DO NOT BUY IT! This is the test product. Please, DO NOT BUY IT!
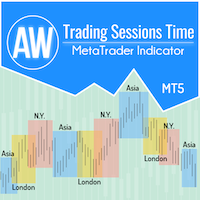
トレーダーが市場のパフォーマンスに関するデータを取得し、より適切な取引戦略を立てる際の利便性のために、当社は取引セッションインジケーターを開発しました。さまざまな取引所の営業時間は、市場活動や取引量に影響を与えるため、取引に影響します。これらの要因によって、さまざまな商品のボラティリティと取引機会が決まります。 AW トレーディング セッション インジケーターは、アジア、ロンドン、ニューヨーク市場の取引時間を表示します。トレーダーは、より良い体験のために、さまざまなタイム ゾーンを表示または非表示にすることができます。チャートでは、セッションの終了までの時間と、取引セッションのサイズを確認できます。チャート上のデータの表示には、さまざまなスタイルの取引チャートに適した柔軟なグラフィック調整機能があります。
その他の製品 -> こちら
利点:
アジア、ロンドン、ニューヨークの取引セッションを表示します。 必要に応じてセッションサイズを数字で表示します。 オンにすると、取引セッションの終了までの時間が表示されます。 取引セッションは個別に無効にすることができます。 チャート上の
FREE

Fractals Dynamic Fractals Dynamic – これで、フラクタルダイナミックインジケーターに基づく、またはそれに基づくすべての取引戦略に追加のシグナルが表示されます。 さらに、フラクタルはサポートレベルと抵抗レベルとして機能することができます。 そして、いくつかの取引戦略では、流動性レベルを示しています。 この目的のために、このバージョンのマルチフラクタルおよびマルチフレームインジケータ MultiFractal Levels でレベルが導入されました。 あなたは、この指標は、より有益な視覚的かつ任意の価格チャート上のあなたの取引のアシスタントとして有用であることがわかります。 あなたの取引システムへの追加として Fractals Dynamic 指標を使用してください
また、市場で私の他の製品を試してみてください https://www.mql5.com/ru/users/capitalplus/seller
取引であなたのための大きな利益!
FREE

Course Crystal は、トレーダーが市場のトレンドの方向性を判断するのに役立つ指標です。 独自のアルゴリズムを使用して価格変動を分析し、結果をチャート上に色付きの領域として表示します。 青は買いの機会を示し、赤は売りの機会を示します。 使用説明書 - https://www.mql5.com/en/blogs/post/757800 手動取引システム:
トレンドの決定: Course Crystal インジケーターは、現在および過去の価格データを分析して、トレンドの一般的な方向を決定します。 データの大部分が価格の上昇を示している場合、インジケーターは青に変わります。 データが価格の下落を示している場合、インジケーターが赤に変わります。 取引開始のシグナル: インジケーターの色が赤から青に変わる場合、これは購入のシグナルである可能性があります。 インジケーターの色が青から赤に変わると、売りシグナルである可能性があります。 リスク管理: リスクを管理するには、取引ごとにストップロスと利益確定を常に設定することが重要です。 ストップロスは、前回の高値または安値より上(買い)

MinMax Levels MinMax Levels – は、重要な取引期間 (日、週、月) の最高値、最低値、始値レベルを示す指標です。
各外国為替市場参加者は、取引システムのレベルを使用します。 それらは、トランザクションを行うための主なシグナルであることも、分析ツールとして機能する追加のシグナルであることもできます。 この指標では、大規模な市場参加者の主要な取引期間であるため、日、週、月が重要な期間として選択されました。 ご存知のとおり、価格はレベルからレベルへと移動するため、重要なレベルに対する価格の位置を把握しておくと、取引の意思決定を行う際に有利になります。 また、便宜上、両方のレベル自体を有効または無効にするためのボタンが追加されており、ボタンを折りたたんで価格チャートの作業ウィンドウのスペースを空けることができます。
各外国為替市場参加者は、取引システムのレベルを使用します。 それらは、トランザクションを行うための主なシグナルであることも、分析ツールとして機能する追加のシグナルであることもできます。 この指標では、大規模な市場参加者の主要な取引期

Ultimate Pivot Levels indicator for MetaTrader 5 Ultimate_Pivot_Levels is versatile tool designed to enhance your trading experience by accurately plotting pivot levels on your charts. It allows entering your desired values manually or using well known pivot calculation methods to create pivot levels. It draws the levels in the background and allows you to customize levels, size and colors of areas, and it keeps your adjustments while extending the levels to every new bar. Whether you are a novi
FREE

ATR is an important indicator for any financial market. The abbreviation ATR stands for Average True Range. This indicator is a tool to determine the volatility of the market, this is its direct purpose. ATR shows the average price movement for the selected period of time. The initial price of the indicator is 63$. The price will increase every 10 sales up to 179$ The original ATR indicator is present in many trading programs. The ATR indicator is not very informative, so I modified its data a

If you need an indicator that shows market entry points, then this is your indicator.
The indicator is not redrawn. Shows buy and sell points for any TF (time frame) and any currency pair. Settings are adjustable for all instruments. You can configure each parameter for any broker, for any account.
This is a PILLOW that is comfortable :)) Just check it out.....
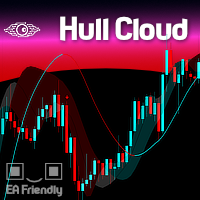
The Hull Moving Average is known for its ability to reduce lag and provide a clearer, more accurate depiction of market trends. By smoothing price data more effectively than traditional moving averages, it helps traders identify trend directions and reversals with greater precision. The Hull Cloud indicator elevates this by using four Hull Moving Averages working together like an orchestra. This combination creates a dynamic system that highlights short, medium, and long-term trends, giving trad

This indicator is the converted Metatrader 5 version of the TradingView indicator "ATR Based Trendlines - JD" by Duyck. This indicator works by automatically and continuously drawing trendlines not based exclusively on price, but also based on the volatility perceived by the ATR. So, the angle of the trendlines is determined by (a percentage of) the ATR. The angle of the trendlines follows the change in price, dictated by the ATR at the moment where the pivot point is detected. The ATR percentag
FREE

Volume plays a crucial role in trading, serving as a key indicator of market activity and investor sentiment. Here are some important roles of volume in trading:
Confirming trends: Dow Theory emphasizes the importance of volume in determining market trends. Larger volume usually indicates greater disagreement between bulls and bears, while smaller volume may indicate higher market agreement with the current price. Capturing institutional moves: By analyzing volume over a period of time, one c

This indicator displays the remaining time of the current candle, providing a visual representation of the time left until the candle closes and a new one begins, helping traders to make more informed decisions and stay on top of market fluctuations with precise timing, enhancing their overall trading experience and strategy execution, and allowing them to optimize their trades and maximize their profits.
FREE
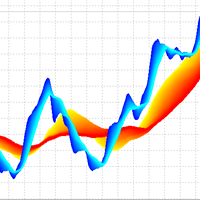
3D Trend Indicator is a non-repaint indicator using multiple moving averages with a 3D surface view. By using this indicator, you can remove uncertainties that can happen using a single and fixed moving average period. You can use a cloud area using a range of moving average periods. Also a wide range of visual settings are added to this indicator to have a better view from the cloud area. Alert and notification system added to the indicator to inform the trader about the action of candles on t
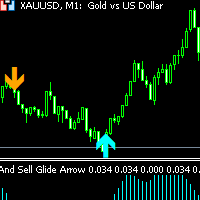
Buy and Sell Glide Arrow non-repaint and arrow appears on current candlestick orange arrow is a sell signal blue arrow is a buy signal Buy and Sell Glide Arrow works on 1 minute, 5 minutes and 15 minutes timeframes only as it is a scalping indicator. Pairs to trade: Forex pairs such as EURUSD,GBPUSD and other METALS: XAUUSD(GOLD) and other INDICES: Boom and crash 1000, Volatility Pairs such as VIX 10 - VIX 100 and other Lastly BTC AND LTC and other

Contact me for instruction, any questions! Introduction A flag can be used as an entry pattern for the continuation of an established trend. The formation usually occurs after a strong trending move. The pattern usually forms at the midpoint of a full swing and shows the start of moving. Bullish flags can form after an uptrend, bearish flags can form after a downtrend.
Flag Pattern Scanner Indicator It is usually difficult for a trader to recognize classic patterns on a chart, as well as sear

Contact me for instruction, any questions! Introduction V Bottoms and Tops are popular chart patterns among traders due to their potential for identifying trend reversals. These patterns are characterized by sharp and sudden price movements, creating a V-shaped or inverted V-shaped formation on the chart . By recognizing these patterns, traders can anticipate potential shifts in market direction and position themselves accordingly. V pattern is a powerful bullish/bearish reversal pattern
Apresentamos o Indicador de novo grafico - uma ferramenta poderosa para traders que buscam uma análise de preço suave e clara. Este indicador inovador calcula a média simples dos preços, oferecendo uma visão precisa e ajustada dos movimentos do mercado. Como Funciona : O Indicador de Média de Preços Simples (SMA) utiliza uma fórmula simples e eficaz: Ele soma o valor do último preço com o preço anterior. Em seguida, divide essa soma por 2 para obter a média. Fórmula : SMA = U ˊ ltimo Pre c ¸ o +

3 Indicators in 1 indicator
Strategy based on price action
Made specifically for the best forex currency pairs
Can be used in the best time frame of the market
at a very reasonable price This indicator is basically 3 different indicatos . But we have combined these 3 indicators in 1 indicator so that you can use 3 indicators at the lowest price.
All three strategies are based on price action. But based on different trends. Long term, medium term and short term
Attributes : No repaintin

Introduction
The "Smart Money Concept" transcends the realm of mere technical trading strategies to embody a comprehensive philosophy on the dynamics of market operations. It posits that key market participants engage in price manipulation, thereby complicating the trading landscape for smaller, retail traders.
Under this doctrine, retail traders are advised to tailor their strategies in alignment with the maneuvers of "Smart Money" - essentially, the capital operated by market makers

MultiFractal Levels MultiFractal Levels – は、レベルを追加して修正された Bill Williams フラクタル インジケーターです。 フラクタルは、設定で許可されているすべての TF から構築されます。
レベルは、価格によってまだテストされていない最新のフラクタルにのみ基づいて構築されます。 オリジナルのターミナルインジケーターに比べて次のような利点があります。 利便性 可視性 有益性 最新レベル カスタマイズ可能なフラクタル カスタマイズ可能なレベル このインジケーターは、作業中に別の時間枠に切り替える必要がないため便利です。
可視性 - 1 つのチャートで、小規模市場から中規模市場、および大規模市場の動きまでのチャートの構造を確認できます。
情報コンテンツ - グラフィックスに関するより多くの情報を視覚的に取得します。
カスタム フラクタルは 2 つの側面から変更できます。左右のバーの数は設定で指定できます。
カスタマイズ可能なレベルは変更できます。極端値に従って描画するか、信号の影 (中央のローソク足) に従ってゾー

Contact me for instruction, any questions! Introduction The breakout and retest strategy is traded support and resistance levels. it involves price breaking through a previous level. The break and retest strategy is designed to help traders do two main things, the first is to avoid false breakouts. Many false breakouts start with a candlestick that breaks out of a level but ends with an immediate candlestick that brings the price back into the level. The second thing that the breakout and rete
MetaTraderマーケットは自動売買ロボットとテクニカル指標を販売するための最もいい場所です。
魅力的なデザインと説明を備えたMetaTraderプラットフォーム用アプリを開発するだけでいいのです。マーケットでプロダクトをパブリッシュして何百万ものMetaTraderユーザーに提供する方法をご覧ください。
取引の機会を逃しています。
- 無料取引アプリ
- 8千を超えるシグナルをコピー
- 金融ニュースで金融マーケットを探索
新規登録
ログイン