Volume Volatility
- Indicators
- Dominik Mandok
- Version: 3.0
- Updated: 16 June 2020
- Activations: 10
Volume Volatility is an indicator which analyzes currency pairs, indices, commodities etc. in terms of extremely high and extremely low accumulation to distribution ratio in comparison to values from past.
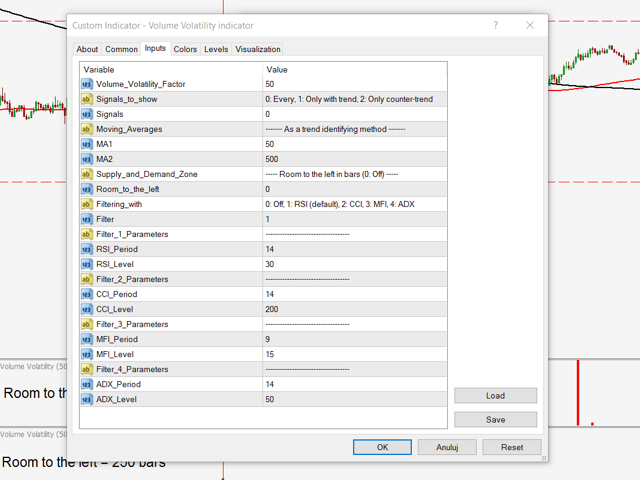
The most important parameter is "Volume Volatility Factor" - this parameter, in big simplification, determines how far distance in the past is analyzed. The lower value of the parameter, the indicator analyzes less data from the past. I recommend you to set and test e.g. 3, 5, 15, 35, and 48 with different timeframes and currency pairs and adjust it to your trading style.
Next parameter is "Signals" which filter signals to show as bars on indicator window.
0: Every,
1: Only with trend,
2: Only counter-trend.
Trend is recognized using two moving averages (MA1 and MA2). If faster MA1 is above slower MA2 - trend is upward, if MA1 is below MA2 - trend is downward.
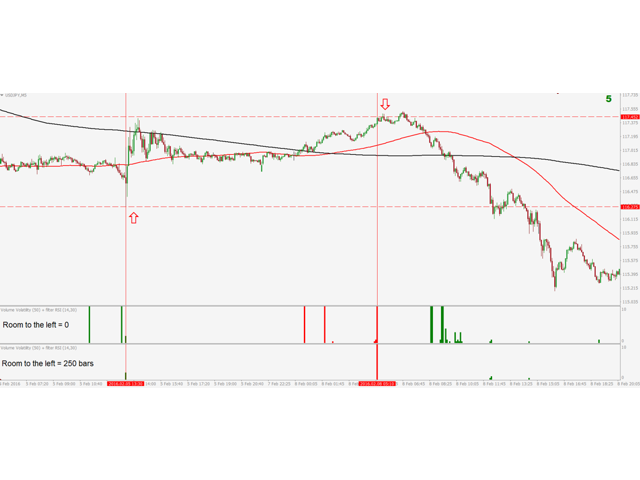
Next parameter called "Room to the left" allows to determine if price is in Supply and Demand Zone (or Support/Resistance in other words) by setting number of bars to the left on chart where the price wasn't so high (with signals to sell) or so low (with signals to buy). This parameter allows filtering many bad signals which don't indicate retracements or reversals clearly.
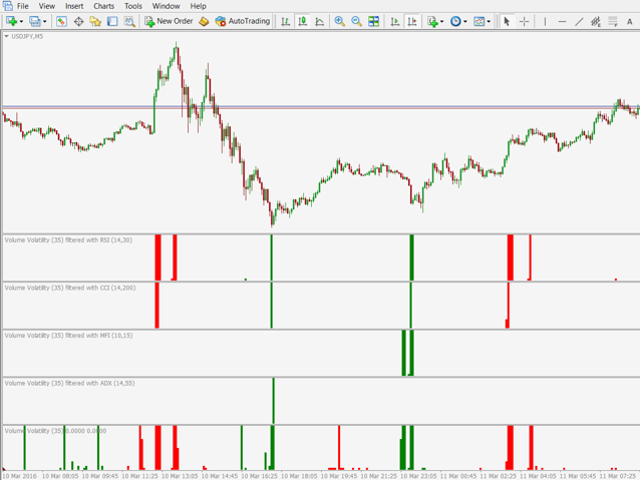
Next parameter is "Filter", which you can use to filter signals with one of the following methods:
0: Off,
1: RSI (default),
2: CCI,
3: MFI,
4: ADX.
Another parameters refer to used filters. We can set the period for each filter and level (for first three filters: above higher and below lower levels we get signals). "RSI Level" is lower level and higher level is 100-"RSI Level". For CCI higher level is "CCI Level" and lower is -"CCI Level" (negative). For MFI, "MFI Level" is lower level and 100-"MFI Level" is higher level. ADX has only one level and signals come only above or equal to "ADX Level".
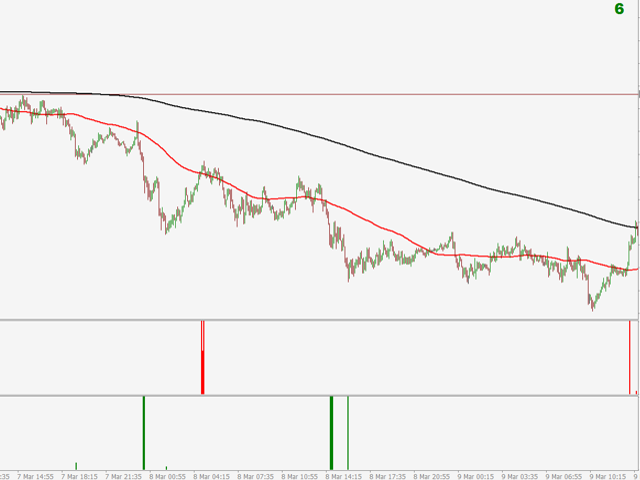
Each signal as a green bar (meaning that you can search opportunity to buy) or red bar (sell) on indicator window may have values from 1 to 10. Value 10 means the highest impact and the highest probability that the trend will change, value 1 - the smallest. Sometimes, small bars are enough to reveal trend retracement or reversal and often are forecast of big bars. If after big (and also small) bars is a Price Action pattern as Doji/Pinbar or Engulfing pattern it's a good opportunity to consider entering the trade or opening pending order above or below some important level. Likewise, if the signal appears in the zone of a strong support or resistance zone from past it's always good opportunity to trade.
Volume Volatility can recognize volume extremes which often lead to reverse of trend or retracements. Using well-chosen and tuned filters we can eliminate a lot of bad signals to make high-probability strategy. I always recommend using higher timeframes which are more likely "noise free", but it doesn't mean that it is impossible to create a scalping strategy with this indicator. You can check it out by yourself and just choose the most appropriate timeframe and parameters for your trading style.
Remember to be always careful when important political and macro-economic messages are published, when price oscillates around important support and resistance levels, pivots or round numbers always pay special attention to the price action. It is also very important to check trend on a higher timeframes before entering the market.
Remember, no one except yourself is responsible for any investment decision made by you. You are responsible for your own investment research and investment decisions.
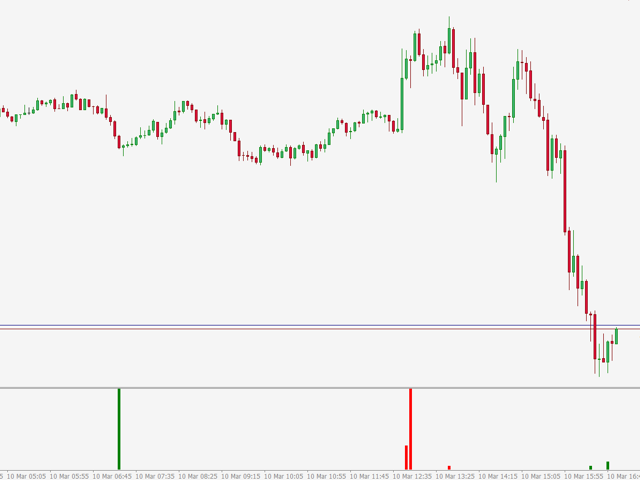
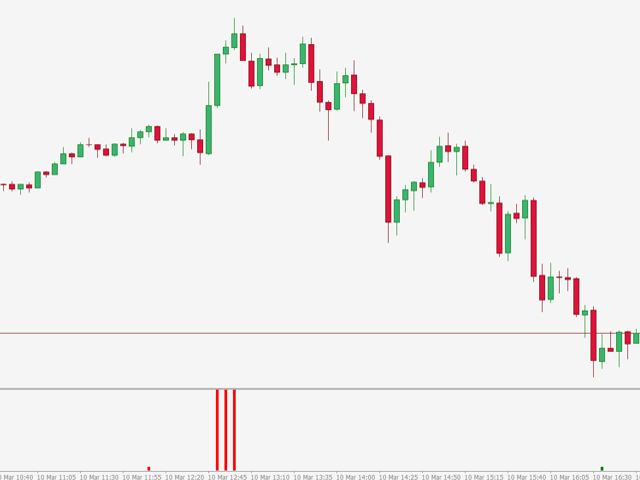
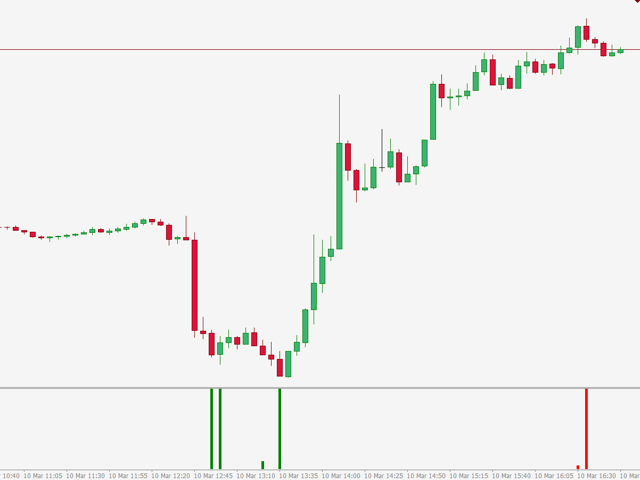
Volume Volatility is a helpful tool to use for trade entry / trade exit confirmation. It is best used in combination with other price action signals. I wouldn't just place a sell order because I see a red bar or a buy order because I see a green bar. Rather, I would take these signals as a warning that something is about to change, and then wait for that change to happen before considering entering or exiting a trade.