• 概述
  • 评论
  • 评论 (3)

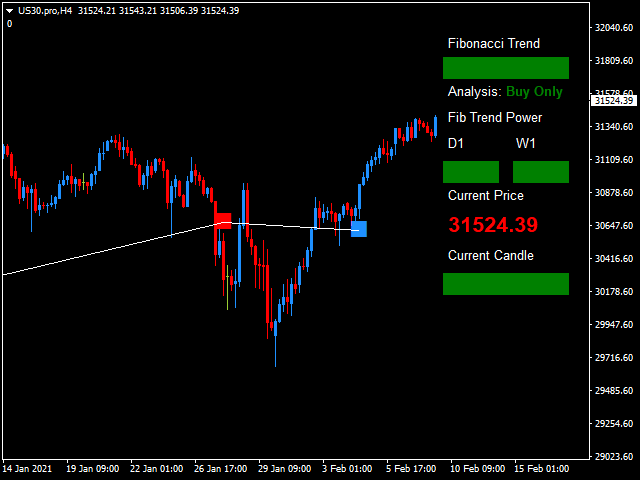
Entry and exit Trend power

buy and sell indicator It will show you the exact entry where to buy and sell along with the indicator that will tell you the bias of the trend. For it has the ability to make your drawdowns less painful and your winning % higher, as you are following with the trend. Entries will be indicated via blue and red boxes right beside with the candles, if blue boxes will show in the charts it means buy and for the red it means sell, you follow it up with the secondary indicator which is the fib trends.


推荐产品
Forex Gump
Andrey Kozak
2.83 (6)
Forex Gump is a fully finished semi-automatic trading system. In the form of arrows, signals are displayed on the screen for opening and closing deals. All you need is to follow the instructions of the indicator. When the indicator shows a blue arrow, you need to open a buy order. When the indicator shows a red arrow, you need to open a sell order. Close orders when the indicator draws a yellow cross. In order to get the most effective result, we recommend using the timeframes H1, H4, D1. There
Noize Absorption Index MT4
Ekaterina Saltykova
5 (1)
Noize Absorption Index - is the manual trading system that measures the difference of pressure between bears forces and bulls forces. Green line - is a noize free index that showing curent situation. Zero value of index shows totally choppy/flat market.Values above zero level shows how powerfull bullish wave is and values below zero measures bearish forces.Up arrow appears on bearish market when it's ready to reverse, dn arrow appears on weak bullish market, as a result of reverse expectation. S
Owl smart levels
Sergey Ermolov
4.63 (54)
MT5版本  |  FAQ Owl Smart Levels Indicator   是一個完整的交易系統,包含   Bill Williams   的高級分形、構建正確的市場波浪結構的 Valable ZigZag 以及標記準確入場水平的斐波那契水平等流行的市場分析工具 進入市場和地方獲利。 策略的详细说明 指示灯使用说明 顾问-贸易猫头鹰助手助理 私人用户聊天 ->购买后写信给我,我会将您添加到私人聊天中,您可以在那里下载所有奖金 力量在於簡單! Owl Smart Levels   交易系統非常易於使用,因此適合專業人士和剛開始研究市場並為自己選擇交易策略的人。 策略和指標中沒有隱藏的秘密公式和計算方法,所有策略指標都是公開的。 Owl Smart Levels 允許您快速查看進入交易的信號,突出顯示下訂單的水平並向您發送有關已出現信號的通知。 優點很明顯: 清楚地顯示主要和更高時間框架的趨勢方向。 指示儀器信號的出現。 標記開單、止損設置和固定利潤的水平。 沒有多餘的,只有必要的結構! ZigZag   表示全球趨勢的方向,因此也表示貿易方向。 市場反轉點的短線清楚地表明在
VR Cub
Vladimir Pastushak
VR Cub 这是获得高质量切入点的指标。该指标的开发是为了促进数学计算并简化对仓位入场点的搜索。多年来,该指标所针对的交易策略已被证明其有效性。交易策略的简单性是其巨大的优势,即使是新手交易者也能成功进行交易。 VR Cub 计算开仓点以及获利和止损目标水平,这显着提高了效率和易用性。查看使用以下策略进行交易的屏幕截图,了解简单的交易规则。 设置、设置文件、演示版本、说明、问题解决,可以从以下位置获取 [博客] 您可以在以下位置阅读或撰写评论 [关联] 版本为 [MetaTrader 5] 计算入场点的规则 开仓 要计算入场点,您需要将 VR Cub 工具从最后一个高点拉伸到最后一个低点。 如果第一个点在时间上早于第二个点,交易者等待柱线收于中线上方。 如果第一个点在时间上晚于第二个点,交易者等待柱线收于中线下方。 根据上述条件,严格在 柱线收盘 后建仓。 换句话说,如果我们在小时图上进行交易,那么从最高点到最低点的时间距离必须超过24小时,最高点和最低点之间的点数必须大于或等于平均价格变动每天。 维持和改变市场地位 可以有多个未平仓头寸;每个头寸都可以单独修改。 VR Cu
这是一个预测蜡烛收盘价的指标。 该指标主要用于 D1 图表。 该指标适用于传统外汇交易和二元期权交易。 该指标可以用作独立的交易系统,也可以作为您现有交易系统的补充。 该指标分析当前蜡烛,计算蜡烛本身内部的某些强度因素,以及前一根蜡烛的参数。 因此,该指标预测市场走势的进一步方向和当前蜡烛的收盘价。 由于这种方法,该指标既适用于短期盘中交易,也适用于中长期交易。 该指标允许您设置指标在分析市场情况期间将产生的潜在信号的数量。 在指标设置中有一个特殊的参数。 此外,该指标可以通过图表上的消息、电子邮件以及推送通知的形式通知新信号。感谢您的关注!交易愉快! 购买后一定要写信给我! 我会给你我的交易指标的建议! 还可以获得奖金!
Key level wedge
Presley Annais Tatenda Meck
4.86 (7)
The Key level wedge indicator automatically draws rising wedge pattern and falling wedge pattern for you on the chart. This pattern is really good when used as a confirmation entry at key support & resistance, supply & demand and reversal zones. Advantages  The Key level wedge block DOES NOT RE-PAINT, giving you confidence when a signal appears and also helps when looking back.  The Key level wedge includes an on/off button on the chart to easily keep the charts clean after analysis by jus
HMA Trend Professional MT4
Pavel Zamoshnikov
4.57 (7)
Improved version of the free HMA Trend indicator (for MetaTrader 4) with statistical analysis. HMA Trend is a trend indicator based on the Hull Moving Average (HMA) with two periods. HMA with a slow period identifies the trend, while HMA with a fast period determines the short-term movements and signals in the trend direction. The main differences from the free version: Ability to predict the probability of a trend reversal using analysis of history data. Plotting statistical charts for analyz
这个多时间框架和多符号指示器提醒 Heiken Ashi 平滑颜色变化。作为奖励,它还可以扫描赫尔移动平均线趋势(颜色)的变化。结合您自己的规则和技术,该指标将允许您创建(或增强)您自己的强大交易系统。 特征 可以同时监控您的市场报价窗口中可见的所有交易品种。将该指标仅应用于一张图表,并立即监控整个市场。 可以监控从 M1 到 MN 的每个时间范围,并在识别出颜色变化时向您发送实时警报。支持所有 Metatrader 本地警报类型。 该指示器包括一个交互式面板。当您单击面板中的信号时,将打开带有相关交易品种和时间范围的新图表。请看下面的截图。 选择延迟一个或多个条形的警报以确认颜色(趋势)变化。 该指标可以将信号写入一个文件,EA 可以使用该文件进行自动交易。比如 这个产品 。 输入参数 输入参数的描述和解释可以在 这里 找到。 重要的 请注意,由于具有多功能性,既不会在安装指标的图表上绘制买入/卖出建议,也不会绘制线条和箭头。强烈建议将指标放在干净(空)图表上,不要在其上放置任何其他可能干扰扫描仪的指标或智能交易系统。
斐波那契折返和扩展画线工具 适用于MT4平台的斐波那契折返和扩展画线工具,适合于使用黄金分割交易的交易者 优点:没有多余的线,没有过长的线,易于观察发现交易的机会 试用版: https://www.mql5.com/zh/market/product/35884 主要功能: 1.可以直接画出多组斐波那契折返,可以看出重要折返点之间的关系; 2.可以画出斐波那契扩展,比率有三种0.618,1,1.618 3.画出的斐波那契折返和扩展均可左右移动,有数值显示,方便观察 4.可通过数字键切换周期 使用指南和功能键: 1.按 [ 或R画折返,按需要画折返,最多云持8组折返; 2.按 ] 或E画扩展; 3.按 \ 删除当前周期下的所有扩展和折返,其余周期的不受影响 4.如何左右移动折返和扩展 (1)点击第一组折返的F5字符,可以左右移动折返; (2)点击COP的字符 ,可以左右移动扩展; 5. (1)点击第一组折返的F5字符,按del 可以删除这组折返; (2)点击COP的字符, 按del 可以删除这组扩展; 6.修改折返和扩展(随着市场的运行
QM Pattern Scanner MT4
Reza Aghajanpour
4.83 (6)
QM (Quasimodo) Pattern is based on Read The Market(RTM) concepts. The purpose of this model is to face the big players of the market (financial institutions and banks), As you know in financial markets, big traders try to fool small traders, but RTM prevent traders from getting trapped. This style is formed in terms of price candles and presented according to market supply and demand areas and no price oscillator is used in it. RTM concepts are very suitable for all kinds of investments, includi
Trend and Fibo Mr Beast
Luis Mariano Vazquez Marcos
Indicador Trend and Fibonacci ProTrader Mr Beast  El Indicador Fibonacci ProTrader v1.0 es una potente herramienta diseñada para optimizar tus estrategias de trading en MetaTrader, aprovechando la precisión y la lógica de la secuencia de Fibonacci. Este indicador incorpora señales avanzadas de take profit, tendencia take profit y stop loss, proporcionando una guía estratégica sólida para tus operaciones. Características Principales: Secuencia de Fibonacci Dinámica: El indicador traza automátic
The principle of this indicator is very simple: detecting the trend with Moving Average, then monitoring the return point of graph by using the crossing of Stochastic Oscillator and finally predicting BUY and SELL signal with arrows, alerts and notifications. The parameters are fixed and automatically calculated on each time frame. Example: If you install indicator on EURUSD, timeframe M5: the indicator will detect the main trend with the Moving Average on this timeframe (for example the Moving
Intraday Levels shows intraday levels grid for intraday trading Shows a grid for the day levels, gives you a guide to know the trend and to measure intraday trades (stop-loss and take-profit). Parameters are: Levels Mode: Basic mode: Shows highest, lowest and middle levels. Advanced mode: Shows highest, lowest, middle and intermediate levels. Fibonacci mode: Shows session Fibonacci retracements levels. Momentum mode: Shows delayed Advanced levels to identify momentum. Smooth Period (Momentum
This is an arrow indicator without a future function,developed based on the most advanced profit trading algorithms.It has the most innovative and advanced dual trend analysis module, as well as the latest and highly effective market trend prediction algorithm.Trends are your friends, and following larger trends can earn the maximum profit in foreign exchange. This indicator helps traders identify current trends and track them. Someone once made a profit of 10 times in a week by relying on it.No
Vizzion
Joel Protusada
Vizzion is a fully automated scalping Expert Advisor that can be run successfully using GBPJPY currency pair at H1 timeframe. Very Important This Expert Advisor can not run with any EAs in the same account. As part of the money management plan, it calculates and monitors the Margin Level % and assumes that all open trades are created by it. If you want an Expert Advisor that trades in a daily basis, this EA is not for you because using this requires a patience to wait for a few days or weeks o
Stepping Trend
Mpendulo Chiliza
The Stepping Trend Indicator     The Steppi ng Trend indicator uses the  average true range  (ATR indicator) in its calculation. This gives you control to set your own average true range period, I set the Default as 10.   Indicator Details. Green Arrow Up: This means you are at the starting point of a new bullish trend, it’s time to buy.   Red  Arrow  Down : This means you are at the starting point of a new  bearish  trend, it’ s time to sell .   What if you miss the Arrow Signal?   No
Advanced Trend Regime
Shellard Securities (Pty) Ltd
The indicator has been designed to function on any time-frame and any pair.   This regime filter will help the trader better evaluate whether the current market is trending, and in which direction. It quickly reacts to changes in market dynamics using a series of advanced calculations. The user is able to select whether the calculation remains standard, or if a further filter constraint is added to the calculation.   A Yellow moving average of the signal has been included for the trader to smoot
Binary Options Assistant (BOA) Multi Currency Dashboard for Binary Options (MT4) . You can use any of the BOA Signals Indicators with the dashboard. Just change the BOA Signals Indicator Name in the dashboard settings to the indicator you want to get signals from. For example: CHILL. BOA_BURN_Indicator_v1   Strategy :   Ana Trader Binary Options Strategy (MACD & Stochastic) BOA_COLD_Indicator_v1   Strategy :  Amalia Trader Binary Options Strategy (Keltner & Stochastic) BOA_CHILL_Indicator_
Trend PA
Mikhail Nazarenko
5 (3)
The Trend PA indicator uses   Price Action   and its own filtering algorithm to determine the trend. This approach helps to accurately determine entry points and the current trend on any timeframe. The indicator uses its own algorithm for analyzing price changes and Price Action. Which gives you the advantage of recognizing, without delay, a new nascent trend with fewer false positives. Trend filtering conditions can be selected in the settings individually for your trading style. The indicator
Monster Harmonic Indicator
Paul Geirnaerdt
4.61 (31)
Monster Harmonics Indicator is a harmonic pattern indicator. It recognizes Gartley, Bat, Crab, Butterfly, Cypher, White Swan, Black Swan, Shark and several other patterns. Projected patterns that are not yet completed are recognized, too. Monster even shows the PRZ (Potential Reversal Zone). Users can add their own user defined patterns to Monster. Besides the current pattern, Monster also shows all patterns in the symbols history. Monster will provide alerts for developing patterns. Introduced
RTrends
Nikolay Likhovid
The RTrends indicator does two things: first, it automatically draws the layout of the price chart by plotting trend lines and, secondly, it produces bearish and bullish signals. The layout reflects the fractal nature of the market. Trends from different time horizons are applied simultaneously on the chart. Thus, from a single chart a trader can see trend lines of higher timeframes. The lines, depending on the horizon, differ in color and width: the older the horizon, the thicker the line is. T
Meta Sniper
Samir Tabarcia
Requirements Optimized to work with   EURUSD-EURCHF-USDJPY, AUDUSD-CADJPY-AUDNZD, CHFJPY-NZDJPY-NZDUSD For timeframe 4H. *(Minimum recommended deposit is $300 for each Pair) for initial lot set to 0.10, My favorite Pair are (CHFJPY-NZDJPY-EURUSD-AUDNZD-USDJPY) Warning it will be SALE only 5 Copys at 60$ Then it will be update up to 200$  You can use it the way it is, For new Set Files will be add on (Comments) ECN broker with low spread is recommended to get better results. Setup is
Gvs Undefeated Trend   indicator is designed for trend and signal trading. This indicator generates trend signals.  It uses many algorithms and indicators to generate this signal. It tries to generate a signal from the points with the highest trend potential. This indicator is a complete trading product. This indicator does not need any additional indicators.  You can only trade with this indicator. The generated signals are displayed on the graphical screen.  Thanks to the alert features you ca
我们为您提供一个指标"蜡烛收盘台",它将成为您在贸易领域不可或缺的助手。 这就是为什么知道蜡烛何时关闭会有所帮助的原因: 如果你喜欢使用蜡烛花纹进行交易,你就会知道蜡烛何时关闭。 此指标将允许您检查是否形成了已知模式以及是否存在交易的可能性。 该指标将帮助您做好市场开放和市场关闭的准备。 可以设置一个计时器来创建计划新闻的预览,这样就可以检查市场对此的反应。 您可以设置指示灯,以便在蜡烛关闭前几秒钟发送警报/警告。 通知/警报/警报可以发送到: 屏幕警报 电子邮件 移动应用 MT4烛台计时器指示器为什么有用 那么烛台计时器什么时候有用呢?如果你长期交易,你可能不需要蜡烛计时器指示器,因为你的参赛不会受到一分钟或一小时的太大影响。但是,如果你在短时间内是黄牛或交易员,那么你知道时机非常重要。 外汇市场24小时开放,只在周末关门,有些策略可能会受到您入仓时出现错误时机的严重影响。 MT4蜡烛计时器指示器可以显示当前蜡烛中的剩余时间,以便为下一次蜡烛打开做好准备。 可以从这一指标中受益的一些情况例子有: 预定消息传出 地理市场开闭 预定发生的事件,通常是金融、经济或
首先,值得强调的是,这个交易工具是非重绘、非重画和非滞后的指标,非常适合专业交易。 在线课程,用户手册和演示。 智能价格行动概念指标是一个非常强大的工具,既适用于新手,也适用于经验丰富的交易者。它将超过20个有用的指标合并到一个指标中,结合了高级交易思想,如内圈交易员分析和智能资金概念交易策略。该指标侧重于智能资金概念,提供有关大型机构交易方式的见解,帮助预测它们的动向。 它在流动性分析方面尤其擅长,有助于理解机构的交易方式。它擅长预测市场趋势,并仔细分析价格波动。通过将您的交易与机构策略对齐,您可以更准确地预测市场走向。该指标多才多艺,擅长分析市场结构,识别重要的订单区块,并识别各种模式。 它擅长识别BOS和CHoCH等模式,理解动量的转变,并突出显示供需强劲的关键区域。它还擅长发现强大的不平衡,并分析价格创造更高高点或更低低点的模式。如果您使用斐波那契回撤工具,该指标可以满足您的需求。它还可以识别相等的高点和低点,分析不同的时间框架,并通过仪表板显示数据。 对于使用更高级策略的交易者,该指标提供了工具,如公平价值差指标和优惠和折扣区域的识别。它特别关注高时间框架订单
Laguerre SuperTrend Clouds adds an Adaptive Laguerre averaging algorithm and alerts to the widely popular SuperTrend indicator. As the name suggests, Laguerre SuperTrend Clouds (LSC) is a trending indicator which works best in trendy (not choppy) markets. The SuperTrend is an extremely popular indicator for intraday and daily trading, and can be used on any timeframe. Incorporating Laguerre's equation to this can facilitate more robust trend detection and smoother filters. The LSC uses the impro
Gyroscopes
Nadiya Mirosh
Gyroscope        professional forex expert   (for EURUSD, GBPUSD, USDJPY, AUDUSD, USDCHF, EURGBP, EURJPY, NZDUSD, USDCAD, EURCHF, AUDJPY, CADJPY pairs)   alyzing the market using the Elliot Wave Index. Elliott wave theory is the interpretation of processes in financial markets through a system of visual models (waves) on price charts. The author of the theory, Ralph Elliott, identified eight variants of alternating waves (of which five are in the trend and three are against the trend). The mo
ZhiBiCCI MT4
Qiuyang Zheng
5 (1)
【ZhiBiCCI】指标适合所有的周期使用,也适合所有的市场品种。 【ZhiBiCCI】绿色实线是逆转看涨背离。绿色虚线是经典的看涨背离。 【ZhiBiCCI】向红色实线是反向看跌背离。红色虚线是古典看跌背离。 【ZhiBiCCI】可以在参数里面设置(Alert、Send mail、Send notification),设置为(true)就可以发送即时信号到警报窗口、电子邮件、即时消息。 参数设置说明: 【displayAlert】:这是警报开关,设置成true,如果出现箭头就会自动警报提示;设置成false,则不会警报提示。 【sendmail_NO_OFF】:这是发送邮件的开关,设置成true,如果出现箭头就会发送邮件到你在MT4设置好的邮箱里面;设置成false,则不会发邮件。 【sendnotification_NO_OFF】:这是发送即时消息的开关,设置成true,如果出现箭头就会发送消息到你的移动设备;设置成false,则不会发消息。 更多好用的指标网址: https://www.mql5.com/en/users/zhengqiuyang/seller
Lyne
Maksim Kalachev
About the Lyne indicator Lyne is a Metatrader 4 (MT4) indicator, the essence of which is to transform the accumulated historical data. The Lyne indicator makes it possible to detect various features and patterns in price dynamics that are invisible to the naked eye. Based on this information, traders can anticipate further price movement and adjust their strategy accordingly. This indicator has proven itself in the scalping strategy. The indicator works without repainting.
Pirate
Anatoliy Lukanin
3.9 (20)
Deposit :   from 100 deposit units Trading pairs: I recommend currency pairs: EURAUD, CHFJPY, EURCHF, EURGBP, AUDCHF, CADCHF, USDCHF. Trading period :  Any Account: You should use ECN-ECN.Pro accounts with five-digit quotes with a moderate size (spread). Parameters: USING - Choice, trading risk or fixed lot RISK/LOT - Lot Risk Value RESTORING_THE_BALANCE - Restoring balance* HOW_THE_RESET_WINDOW - Reset the Global Variable TAKE_PROFIT - Set profit STOP_LOSS - Set loss COUNT_BUY - The number of
该产品的买家也购买
Atomic Analyst
Issam Kassas
5 (3)
首先值得强调的是,该交易指标是非重绘、非延迟的指标,这使其成为手动和机器人交易的理想选择。 用户手册:设置、输入和策略。 Atomic Analyst是一种PA价格行动指标,利用价格的力量和动量来寻找市场上更好的机会。配备了高级过滤器,可帮助去除噪音和假信号,并提高交易潜力。使用多层复杂的指标,Atomic Analyst扫描图表,并将复杂的数学计算转化为任何初学者都能理解并用来做出一致交易决策的简单信号和颜色。 “Atomic Analyst”是专为新手和经验丰富的交易者量身定制的综合交易解决方案。它将高级指标和一流功能融合为一体的交易策略,使其成为所有类型交易者的多功能选择。 日内交易和剥头皮策略:专为快速准确的日内交易和短期交易而设计。 日内和摆动交易策略:可用作追求价格大幅波动的日内和摆动交易者的可靠工具。 多货币和市场:凭借其可靠的精度,在不同的工具和市场上运作。 多个时间框架:可在多个时间框架上使用,性能良好。 稳定性:所有指标均不重绘、不重绘和不滞后,确保可靠的信号。 信号清晰度:提供箭头信号,用于清晰的入场和出场点。 实时警报:通过交易入场、SL和TP警报通知交
TPSpro RFI Levels
Roman Podpora
4.8 (15)
Reversal First Impulse levels (RFI)    INSTRUCTIONS        RUS       -       ENG              R ecommended to use with an indicator   -   TREND PRO -  Version MT5 A key element in trading is zones or levels from which decisions to buy or sell a trading instrument are made. Despite attempts by major players to conceal their presence in the market, they inevitably leave traces. Our task was to learn how to identify these traces and interpret them correctly. Main functions: Displaying active zones
FX Volume
Daniel Stein
4.6 (35)
通过 mql5 和 Telegram 上 的 " 晨间简报 "获取每日市场更新,包括详细信息和屏幕截图 ! 外汇交易量(FX Volume)是第一个也是唯一一个从经纪商角度真正洞察市场情绪的交易量指标。 直接在您的图表上看到这些信息是真正改变游戏规则和突破性的交易解决方案。 受益于独特的市场数据洞察,如 比率(Ratios )显示货币多头和空头头寸的比率(百分比 比率变化 显示所选时间段内的多头比率及其百分比变化 总交易量 显示货币的总交易量(多头和空头),以手为单位 多头 交易量显示货币所有多头头寸的交易量 空头 交易量显示所有货币空头头寸的交易量 净多头 显示净多头交易量,即所有多头头寸减去所有空头头寸(以手为单位)。 净多头百分比 显示货币净多头交易量的变化 请阅读我们的基本教程 -> "如何使用外汇交易量进行交易 " 获取更多信息,如常见问题、交易技巧和教程视频,请访问我们的 外汇交易量公共信息频道 请 安装并运行 SI Connect 以建立与我们数据中心的持续连接 背景信息 我们都知道,外汇是一个分散的市场。这就是为什么我们必须打破常规思维,开发一个独
Enigmera
Ivan Stefanov
5 (2)
ENIGMERA:市场核心 https://www.enigmera.com 简介 该指标和交易系统是金融市场的一种非凡方法。ENIGMERA 利用分形周期精确计算支撑位和阻力位。它能显示真实的累积阶段,并给出方向和目标。 该系统无论在趋势中还是在修正中都能发挥作用。 它是如何运行的? ENIGMERA 由三条线组成:支撑/阻力线、目标线和偏离线。与一般市场指标将过去的数据推断为现在和未来的情况不同,该系统能提供当前的完整情况。如果你处于支撑位,这意味着真正的支撑;如果你处于阻力位,这意味着真正的阻力。如果突破某一水平,则表示趋势发生变化。没有重绘。 由于市场在不断变化,ENIGMERA 不断调整其评估工具,定期修改策略。  这保证了每种情况都能得到全面评估。这一市场指标的独特性显而易见,其能力不言而喻。  ENIGMERA 为金融分析师和咨询师提供服务,他们需要可靠的见解与客户分享,也为投资者提供服务,他们需要最精确和最可靠的保证。 该系统能够达到最佳精度,使交易者能够自信、清晰地评估他们的选择。 ENIGMERA 将 20 年的交易专长和知识整合到一个综合软件
Gann Swing Structure
Kirill Borovskii
5 (1)
This indicator is based on the mathematics of the great trader W.D. Ganna. With its help, you can easily find strong levels by analyzing swings to find the optimal entry point. The indicator works on all instruments and all timeframes. The indicator is fully manual and has control buttons. All you need to do is press the NEW button, a segment will appear, which you can place on any movement, swing or even 1 candle that you want to analyze. By placing the segment, press the OK button. A grid (th
目前八折优惠! 对任何新手或专家交易者来说都是最好的解决方案! 这个仪表板软件适用于28种货币对。它基于我们的两个主要指标(高级货币强度28和高级货币冲动)。它对整个外汇市场提供了一个伟大的概述。它显示高级货币强度值,货币运动速度和28个外汇对在所有(9)时间段的信号。想象一下,当你可以使用图表上的单一指标观察整个市场,以确定趋势和或剥头皮的机会时,你的交易将得到改善 我们已经在这个指标中建立了一些功能,使你更容易识别强势和弱势货币,同时识别和确认潜在的交易。该指标以图形方式显示货币的强势或弱势是增加还是减少,以及它在所有时间段的表现。 增加的新功能是动态市场斐波那契水平,它适应当前的市场条件变化,这是一个已经在我们的高级货币强度28和高级货币冲动指标中使用的成熟的加分项。 在交易时,总是将弱势货币和强势货币配对,这个新指标将帮助你做到这一点。 用户手册:点击这里  https://www.mql5.com/en/blogs/post/708783 特点  显示每个时间段的ACS28和GAP-speed(冲动)的货币强度值。 列:颜色代码以7种颜色
Dragon Multi Indicator MT4
Mansour Babasafary
5 (4)
3 Indicators in 1 indicator Strategy based on price action Made specifically for the best forex currency pairs Can be used in the best time frame of the market at a very reasonable price This indicator is basically 3 different indicatos . But we have combined these 3 indicators in 1 indicator so that you can use 3 indicators at the lowest price. All three strategies are based on price action. But based on different trends. Long term, medium term and short term Attributes : No repaintin
TrendMaestro
Stefano Frisetti
5 (3)
note: this indicator is for METATRADER4, if you want the version for METATRADER5 this is the link:  https://www.mql5.com/it/market/product/108106 TRENDMAESTRO ver 2.4 TRENDMAESTRO recognizes a new TREND in the bud, he never makes mistakes. The certainty of identifying a new TREND is priceless. DESCRIPTION TRENDMAESTRO identifies a new TREND in the bud, this indicator examines the volatility, volumes and momentum to identify the moment in which there is an explosion of one or more of these data a
PZ Trend Trading
PZ TRADING SLU
4.75 (4)
许多盈利交易者不仅知道如何识别市场趋势,而且也能把握趋势建立后的交易机会。 Pz 趋势交易 指标设计用来在趋势行情中尽可能的赚取利润。 已建立的趋势提供了一揽子交易机会,但大多数趋势交易指标完全忽视了它们,让交易者在趋势行情时完全不知道该如何做!一般趋势指标只通知有关的趋势变化,但根本不足以得到卓越的回报. Pz 趋势交易 指标比一般趋势指标显示多达 20 倍的交易 , 因为它注重所谓的市场时机。它不仅显示当前的市场趋势,也有回调,内柱线的突破和调整。它令您在趋势回调之后介入,安全的柱线内突破金字塔加仓,以及发现潜在的反转,和已知的调整。 趋势改变 一个趋势改变在市场方向变化时发生。趋势变化在图表上用带数字的彩色圆圈显示。蓝色 (1) 信号为上涨开始, 而红色 (1) 信号为下跌开始。趋势变化并非评估当前价格动作的结果, 它意味着交易设置是不定时地。如果您正确使用本指标, 在趋势变化时, 您将将已经入场 (参看下面的调整)。 回调 但凡趋势在运动中,行情上下抖动,盈利者收割利润,且其它参与者入场。趋势回调代表好的买入机会,通常是由主力获利离场导致。如果行情在回调后回归上行, 指
Full Forex Market View Dashboard
Opengates Success International
5 (2)
完整的外汇市场视图仪表板指示器 这是一个自定义指标,旨在让交易者全面了解市场上正在发生的事情。 它使用实时数据访问市场并显示成功交易所需的每一点信息。 安装: 在将此指标附加到您的窗口图表之前,请转到您的 MT4 的市场观察面板并隐藏所有您不需要或交易的货币对,并将其余货币对留在那里。 原因是 FFMV 仪表板将显示出现在 MT4 市场观察中的所有货币对。 它最多可以显示 30 个或更少的货币对。 如果它超过您 MT4 的市场观察中的那个,它会模糊和毁坏 FFMV 仪表盘上的字体和图像! 它不会正确显示。 用法:      单人交易      对于篮子交易(见截图如何)      也可用于多单交易      确认从您自己的交易系统等收到的信号的有效性。 成分:      时间范围:从 M1 到 MN1 当前蜡烛状态(买入/卖出      趋势:币种整体走势      影响:货币变动的幅度/波动性,见下文:      建立:货币正在建立      好:货币越来越严重      高:币值值得关注      强:要考虑方向  
ECM Channel MT4
Paulo Rocha
5 (1)
ECM Elite Channel is a volatility-based indicator, developed with a specific time algorithm, which consists of finding possible corrections in the market. This indicator shows two outer lines, an inner line (retracement line) and an arrow sign, where the channel theory is to help identify overbought and oversold conditions in the market. The market price will generally fall between the boundaries of the channel. If prices touch or move outside the channel, it's a trading opportunity. The
Volatility Trend System - a trading system that gives signals for entries. The volatility system gives linear and point signals in the direction of the trend, as well as signals to exit it, without redrawing and delays. The trend indicator monitors the direction of the medium-term trend, shows the direction and its change. The signal indicator is based on changes in volatility and shows market entries. The indicator is equipped with several types of alerts. Can be applied to various trading
Backtesting Simulator MT4
Diego Arribas Lopez
3.5 (2)
[ MT5 Version ] Backtesting Simulator Are you tired of spending months on demo or live accounts to test your trading strategies? The Backtesting Simulator is the ultimate tool designed to elevate your backtesting experience to new heights. Utilizing Metatrader historical symbol information, it offers an unparalleled simulation of real market conditions. Take control of your testing speed, test ideas quickly or at a slower pace, and witness remarkable improvements in your testing performance. For
SMCpro VIP MT4  Original Price  $630   ---  Currently Price 25% OFF ( for unlimited use )   BONUS  AUX VIP Club 2024 : Include  EA Airbag  and  Load Data History  to enhance the performance of this tool to its maximum potential  Click Here to Download Files   ( for users only )   Hello World! Introducing.. SMCpro VIP tool and Indicator for MetaTrader 4, designed to revolutionize your trading experience with the ICT Smart Money Concept. This system is meticulously crafted to empower trad
Shepherd Harmonic Pattern
Abdullah Alrai
4.68 (59)
这个指标将检测手动和自动方法在图表上绘制的谐波模式。 您可以从此链接查看用户手册: 添加您的评论并联系我们以获得它 有一个免费版本可以在mt4上尝试此产品。 您可以使用它来检测Gartley和Nenstar模式: https://www.mql5.com/en/market/product/30181 您可以从以下链接购买完整的MT4版本: https://www.mql5.com/en/market/product/15212 注意 指标具有控制面板,并将保存每个(图表和时间框架)设置。 您可以将其最小化以在图表上获得更多空间,并且如果您更喜欢使用其他分析工具,则可以按关闭按钮隐藏所有指标数据 当您使用此指标并更改设置,添加诸如移动平均线或布林带之类的指标时,此指标将自动保存您的模板编辑,并且您可以随时加载它们。 如果您使用的是Windows 10,请右键单击MetaTrader图标>兼容性>更改高DPI设置>系统(增强)以获得最佳屏幕设置(应在高清设备中完成)。 指标只是谐波交易理论的解释,用于检测图表上的谐波模式。 如果您想学习它,可以搜索Scott Carney的书,名为“Ha
Indicator : RealValueIndicator Description : RealValueIndicator is a powerful tool designed specifically for trading on the EURUSD pair. This indicator analyzes all EUR and USD pairs, calculates their real currency strength values, and displays them as a single realistic value to give you a head start on price. This indicator will tell you moves before they happen if you use it right. RealValueIndicator allows you to get a quick and accurate overview of the EURUSD currency pair tops and bottoms,
ON Trade Optuma Astro
Abdullah Alrai
5 (4)
当然可以!以下是您提供的文本的中文翻译: 引入 MT4 天文指标:您的终极天体交易伙伴 您准备好将交易体验提升到天文高度了吗?不用再寻找,就在我们的革命性 MT4 天文指标中。这个创新工具超越了传统的交易指标,利用复杂的算法提供无与伦比的天文洞察力和精确计算。 指尖上的宇宙信息: 瞻仰一个详尽的面板,展示了一宝藏般的天文数据。了解行星的地理/太阳心坐标,太阳/地球距离,亮度,伸长度,星座,黄道和赤道坐标,甚至是水平坐标——每个细节都经过精心计算并呈现得美轮美奂。指标生成的垂直线对应于时间值,为您的交易旅程提供了宇宙的视角。 行星线条与关系: 在您的图表上欣赏行星线条的魔力,具有可自定义的比例和角度。通过直观的控制面板轻松切换每个行星线条的可见性。通过连结、六分、四分、三分、对冲和逆行等指标,发现行星关系的艺术。在您选择的时间范围内探索这些宇宙构造,使您能够识别重要的交易机会。 揭示甘恩的智慧: 通过受甘恩启发的平方垂直线揭示潜在的反转时机。这种创新修改将甘恩历经考验的原则带入现实,帮助您提前了解市场的转向和趋势。 月亮引导: 在您的图表上优雅地导航月相,因为新月和满月点缀其间。月亮周期
Cycle Sniper
Elmira Memish
4.39 (36)
NEW YEAR SALE PRICE FOR LIMITED TIME!!! Please contact us after your purchase and we will send you the complimentary indicators to complete the system Cycle Sniper is not a holy grail but when you use it in a system which is explained in the videos, you will feel the difference. If you are not willing to focus on the charts designed with Cycle Sniper and other free tools we provide, we recommend not buying this indicator. We recommend watching the videos about the indiactor and system before pu
The indicator of a Professional Trader is an arrow indicator for predicting the direction of price movement. I have been working on this indicator since 2014. You can use this indicator as your main indicator, use its entry signals, and use it as your only indicator to find entry points. About the product: Recommended TF [H4-D1-W1]   . The indicator predicts the direction of the next candle. Fits a variety of tools; Flexibility in settings for different instruments and intervals through the
PZ Swing Trading
PZ TRADING SLU
5 (4)
Swing Trading 是第一个旨在检测趋势方向的波动和可能的反转波动的指标。它使用在交易文献中广泛描述的基准摆动交易方法。该指标研究多个价格和时间向量,以追踪总体趋势方向,并检测市场超卖或超买并准备好进行修正的情况。 [ 安装指南 | 更新指南 | 故障排除 | 常见问题 | 所有产品 ] 市场波动的利润不会被窃取 指示器始终显示趋势方向 彩色价格带代表机会基准 彩色虚线表示可能的反转波动 该指标分析其自身的质量和性能 它实现了一个多时间仪表板 可定制的趋势和波动周期 它实现了电子邮件/声音/推送警报 指示器为非重涂或重涂 什么是摇摆交易 摇摆交易是一种尝试在一天到一周内从证券中获得收益的交易方式,尽管某些交易最终可以保持更长的寿命。摇摆交易者使用技术分析来买入弱点和卖出力量,并有耐心等待这些机会的发生,因为在发生一波抛售浪潮之后购买证券而不是陷入抛售更有意义。 机会基准 关于历史数据的大量研究证明,适合于波动交易的市场倾向于在基线价格带上下交易,基线价格带由图表显示,使用平均真实区间计算得出。波动交易者使用基线,该策略是购买常态和卖出躁狂,或做空常态并掩盖沮丧。
Weis Wave with Alert
Trade The Volume Waves Single Member P.C.
4.8 (20)
Rental/Lifetime Package Options and Privileges' * For optimum results the yearly or lifetime package is suggested due to live training and Discord  channel trading with the  creator! Rent Monthly Six Months   Yearly/Lifetime Weis Wave with Speed with Alert+Speed Index x x x Manual  x x x Quick Set up Video x x x Blog x x x Lifetime Updates x x x Setup and Training Material x x Free Rectangle Break Alert Tool      x Discord Access Channel "The SI traders" x 2-hour live methodology traini
XQ Indicator MetaTrader 4
Marzena Maria Szmit
3 (2)
Step into the realm of Forex trading with confidence and precision using XQ, a cutting-edge Forex indicator designed to elevate your trading game to unprecedented heights. Whether you're a seasoned trader or just stepping into the world of currency exchange,   XQ Forex Indicator   empowers you with the insights and signals needed to make informed trading decisions. The signal conditions are a combination of three indicators, and XQ Forex Indicator only display  medium and long-term trends . The
Multi Advanced Arrow
Alfred Kamal
5 (2)
It is the same of Advanced Arrow indicator but shows the signal of 8 currencies pairs at the same time on 5 Timeframes without any TPs line or SL. Features You will know when exactly you should enter the market. This indicator does not repaint it's signals. Signal Types and Timeframes Used You can use this indicator on any timeframes but i recommend you to use it on H1, H4 frames. The indicator gives you four signals (Ready to Buy "RBuy", Ready to Sell "RSell", Buy, Sell). When RBuy appear y
IA Trendx3 PRO
Marco Aurelio Santos Costa
What if God Created a Trade System? No miracles... Just see how mathematics can be effective in the market. We managed to combine technical analysis / price action into indicators, creating the best setup for trading, be it in Forex, Indices, or stocks. It took us 2 years to create something that really works, and now it's time for you to discover it. TrendX3 is a revolution in trend analysis. Based on advanced algorithms and real-time data, it provides valuable insights so that you can make inf
引入神奇外汇指标:释放精准交易的力量 你是否厌倦了寻找在所有时间框架上都能取得出色结果的完美外汇指标?别再继续寻找了!神奇外汇指标已经来到,改变您的交易体验,将您的利润推向新的高度。 神奇外汇指标基于尖端技术和多年的精心开发,堪称外汇市场上的强大和精确的巅峰之作。这个卓越的工具旨在满足各个层次的交易者需求,在追求持续盈利性方面提供无与伦比的优势。 神奇外汇指标的独特之处在于其无与伦比的适应性。无论您是日内交易者、波段交易者还是更喜欢长期持仓,该指标都经过优化,能在所有时间框架上取得出色的结果。然而,当在1小时时间框架上使用时,它的准确性和捕捉市场复杂走势的能力得到真正展示。 准备好对神奇外汇指标的准确性和可靠性感到惊讶。其先进的算法无缝结合了强大的指标、统计分析和趋势识别,实时为您提供全面的市场视图。指标的智能和动态信号使您能够自信地做出明智的交易决策,最大限度地提高获胜交易的机会。 不再犹豫和迷茫。神奇外汇指标消除了交易的猜测,使您在市场参与者中具有独特的优势。其用户友好的界面和直观的设计使得无论是经验丰富的专业人士还是初学者都能轻松掌握这一卓越工具的力量。 有了神奇外汇指标的支持,
Wolfe Wave Scanner
Jalitha K Johny
5 (2)
Wolfe Waves scanner - It scans all the Symbols and identify the movement of price and it gives confidence in trade. It automatically plots  fifth wave breaks out of the channel. According to the theory behind the pattern, a line drawn from the point at the beginning of the first wave and passing through the beginning of the fourth wave predicts a target price for the end of the fifth wave. If a trader properly identifies a Wolfe Wave as it forms, the beginning of the fifth wave represents an op
TPA True Price Action indicator reveals the true price action of the market makers through 100% non-repainting signals (except early signals mode) strictly at the close of a candle! TPA shows entries and re-entries, every time the bulls are definitely stronger than the bears and vice versa. Not to confuse with red/green candles. The shift of power gets confirmed at the earliest stage and is ONE exit strategy of several. There are available now two free parts of the TPA User Guide for our custo
Nasdaq100 Power Indicator
Teboho Edgar Rakotsoane
5 (4)
The NASDAQ 100 Power Indicator serves with TREND and trend reversals indication using automated arrows that indicates buy or sell at that price and has built-in signal provider across all time frames with alerts and provides also the automated support and resistance that can draw technical analysis patterns like double bottom, double top, head and shoulders etc. using closing and open prices, in assistance for if a trader did not see the pattern sooner for their technical analysis. The indicator
Introduction to Fractal Pattern Scanner Fractal Indicator refers to the technical indicator that makes use of the fractal geometry found in the financial market. Fractal Pattern Scanner is the advanced Fractal Indicator that brings the latest trading technology after the extensive research and development work in the fractal geometry in the financial market. The most important feature in Fractal Pattern Scanner is the ability to measure the turning point probability as well as the trend probabi
Scientific trade
Aleksey Ivanov
5 (1)
An extremely convenient indicator that truly makes the process of making money on the exchange easy. It is based on the scientifically rigorous theory of the market developed by the author, the beginning of which is presented here .                The full algorithm of this indicator operation is presented in the article .               The indicator calculates the most probable price movement trajectory and displays it on the chart. Based on the predicted price movement trajectory
筛选:
无评论
回复评论