Belkhayate Gravity Center MT4 Custom
- 指标
- Ahmed Alaoui Chrifi
- 版本: 1.0
- 激活: 10
Belkhayate Gravity Center MT4
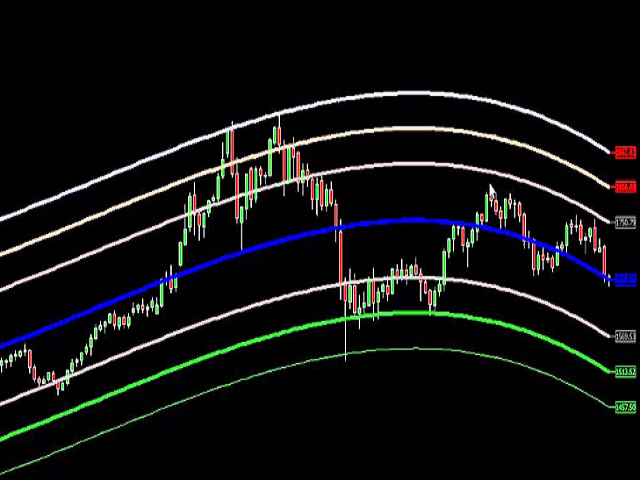
The Belkhayate center of gravity indicator is best used to confirm major turning points, and distinguish price extremes. Generally if price
reaches the upper or lower levels one should expect a turn around coming soon, or at least a pull back towards the centre line if there is a
strong trend. The upper and lower levels are red and green lines.
Our indicator use the same parameters as the well known trader M.Mostafa Belkhayate the inventor of the indicator, allow the use of buffers for your EA and allow notification for every closed bar beyond lower or upper limit to your phone.