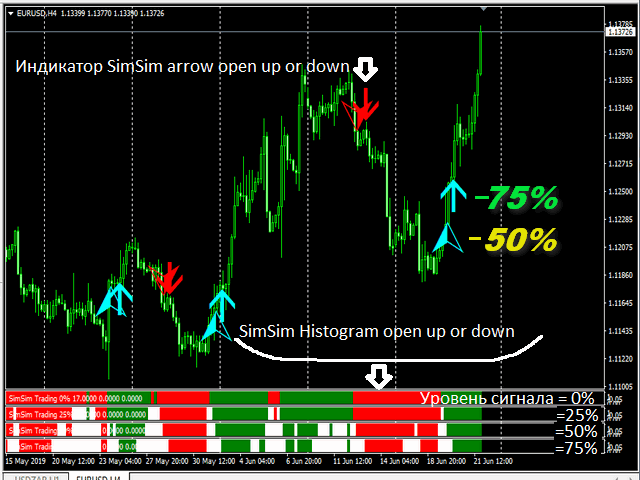
SimSim Histogram open up or down
- 指标
- Aleksandr Tyunev
- 版本: 2.1
- 更新: 23 六月 2020
- 激活: 9
SimSim Histogram open up or down
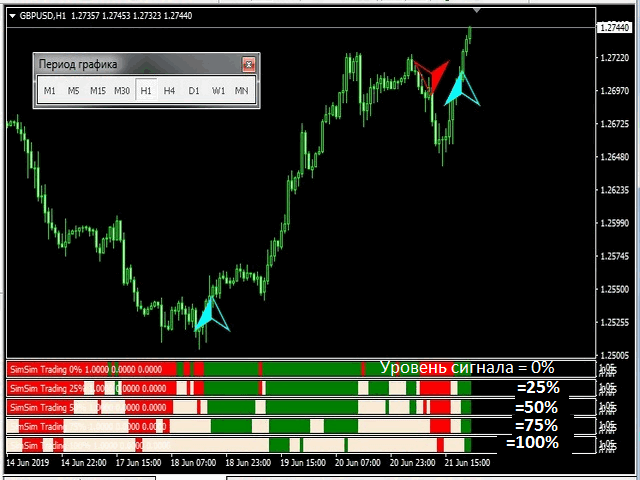
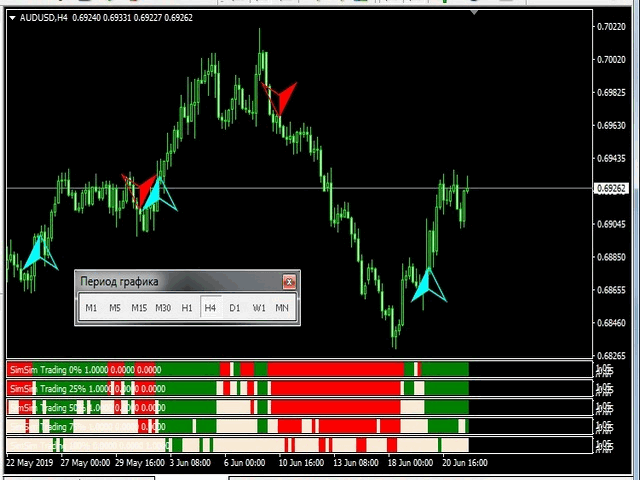
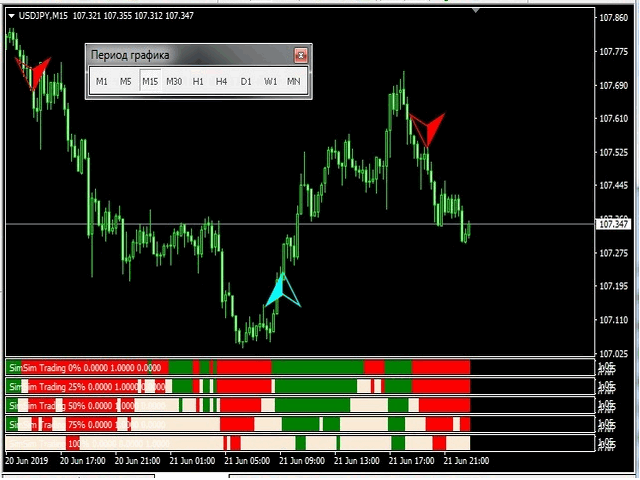
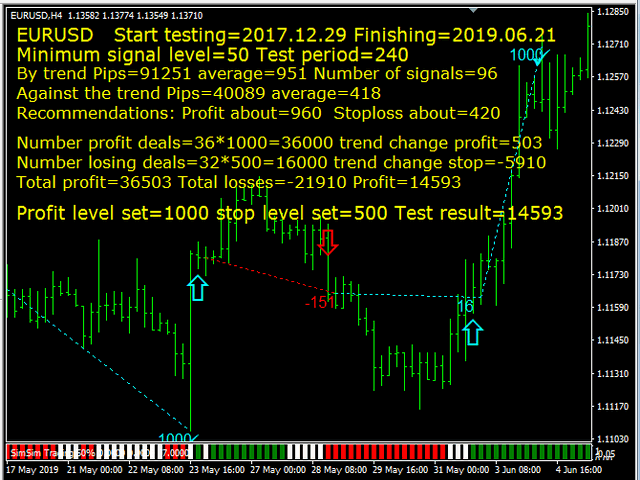
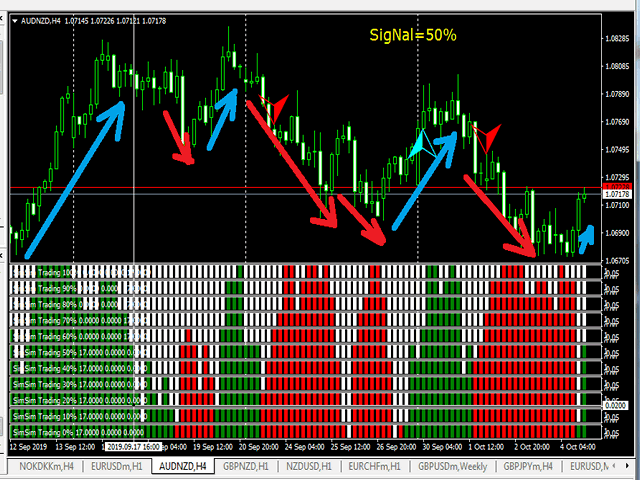
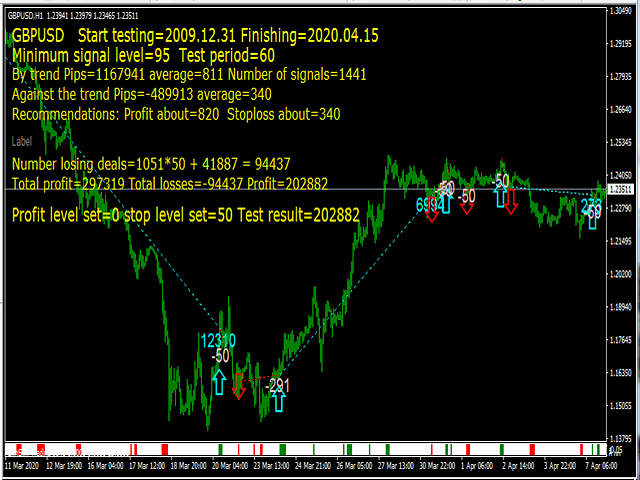
该指标计算和汇总来自25个标准指标的数据。贸易商自己确定使用什么标准指标。计算的结果是,我们获得了当前信号电平,并通过以下颜色对直方图进行了着色:买入,卖出或中性值。
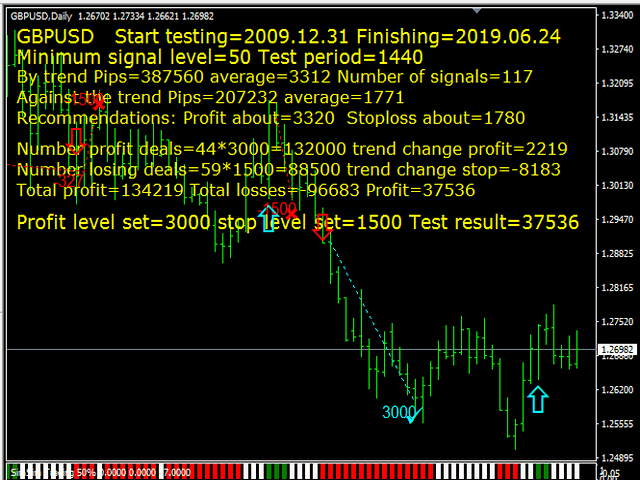
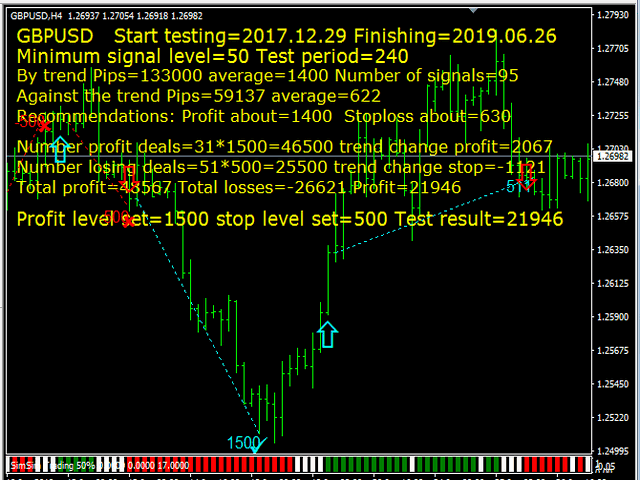
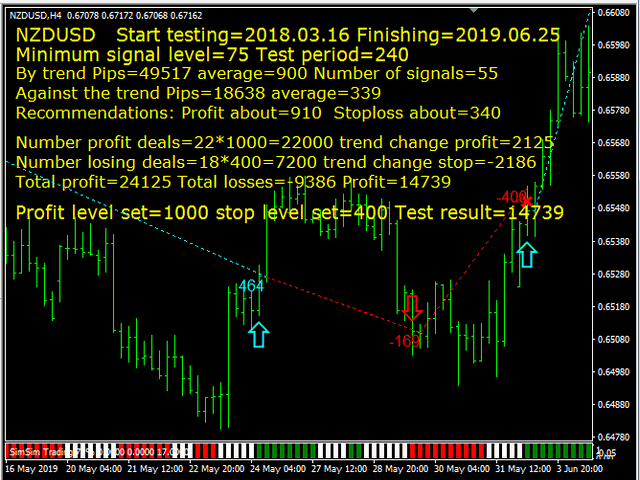
该指标实现了一个测试系统,可以通过下载演示版本进行测试。
指标可以很好地补充您的交易策略。
首次试用-租用或购买!
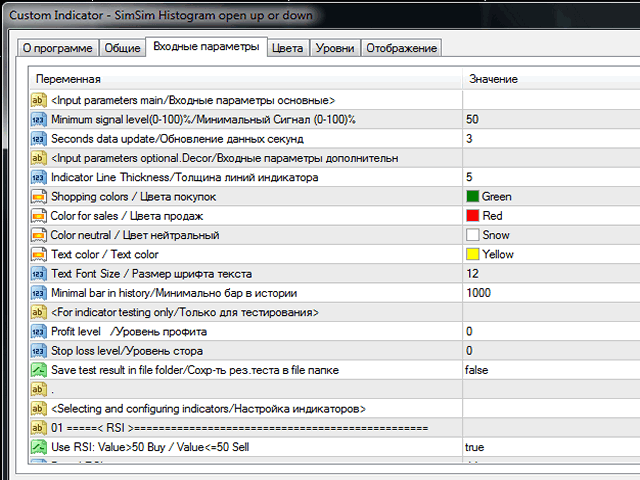
Seconds data update - 秒数据更新
输入参数可选
Shopping colors - 购物颜色-
Color for sales - 待售颜色-
Color neutral - 颜色中性-
Text color - 文字颜色-
Text Font Size - 文字字型大小-
Minimal bar in history -历史上的最低限度-
Stop loss level - 止损水平-
Save test result in file folder - 将测试结果保存在文件夹中-
用于计算信号的标准指示器的参数。 True-参与计算,False-不参与。
No. 01使用RSI:值> 50买入/值<= 50卖出-如果指标值大于50-买入信号,如果卖出信号小于或等于50。No. 03使用CCI:值> 0买入/值<= 0卖出-如果指标值大于0-买入信号,如果卖出信号小于或等于0。No. 05使用ADX:PLUSDI> MINUSID买入/ PLUSDI <= MINUSID卖出-如果指标线为PLUSDI> MINUSID-买入信号,如果PLUSDI <= MINUSID卖出信号。。 。 。
No. 25使用RVI:值> 0买入/值<= 0卖出-如果指标值大于0-买入信号,如果卖出信号小于或等于0。