• 概述
  • 评论 (37)
  • 评论 (143)
  • 新特性

EasyTrend

3.5

The EasyTrend is a seemingly simple but quite powerful trend indicator. Everyone has probably come across indicators or Expert Advisors that contain numerous input parameters that are difficult to understand. Here you will not see dozens of input parameters, the purpose of which is only clear to the developer. Instead, an artificial neural network handles the configuration of the parameters.
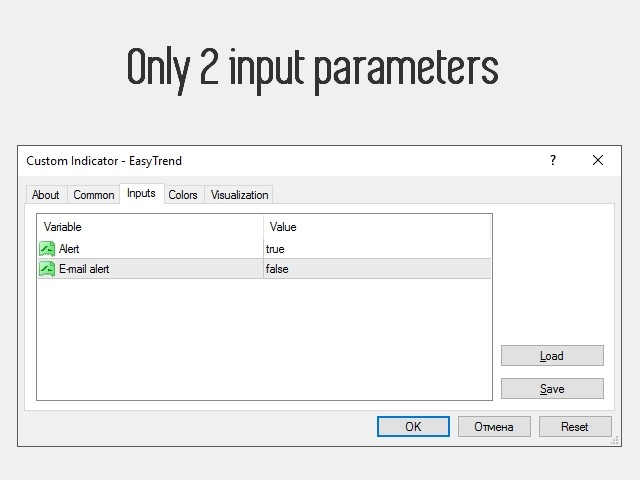

Input Parameters

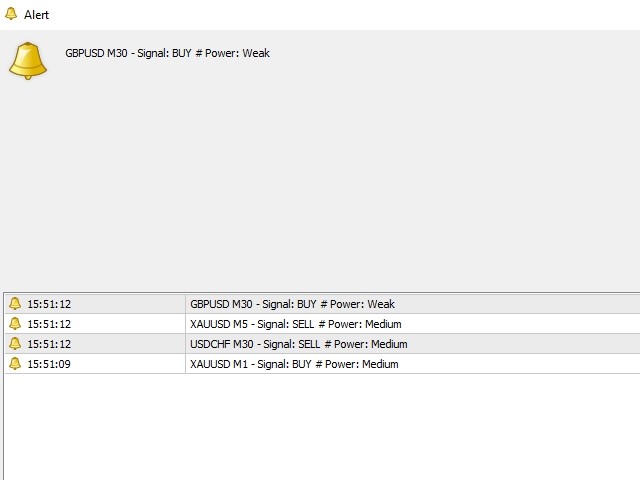
The indicator is as simple as possible, so there are only 2 input parameters: Alert - if set to true, enables sending audible and text notifications when the trend changes. If set to false — disabled.E-mail alert - if set to true, enables sending notifications to the email. If set to false — disabled. To use this function, it is necessary to configure email parameters in the terminal settings.


    How It Works and Features

    It is based on the analysis of the current change in the price deviation from its average value over a certain period and the statistical average of the absolute value of this parameter. The analysis results are adjusted by the sensitivity coefficient and vertical shifts, which in turn depend on the current trading instrument, timeframe and inclination angle of the trend channel. All internally variable parameters, values and automatic adaptation is managed by a simple neural network.

    It does not get redrawn. Suitable both for scalping, and for long-term trading. Easy to use and configure. It is possible to enable sound alert or sending notifications to your email when the trend changes. Automatically determines the trend and adapts to it: works on M1, M5, M15, M30, H1, H4, D1, W1, MN1. Automatically adapts to all currency pairs, metals, futures and even stocks. The best adaptation is provided for metals and currency pairs. It works well in combination with the classic oscillators: CCI, ADX, RSI, MFI.
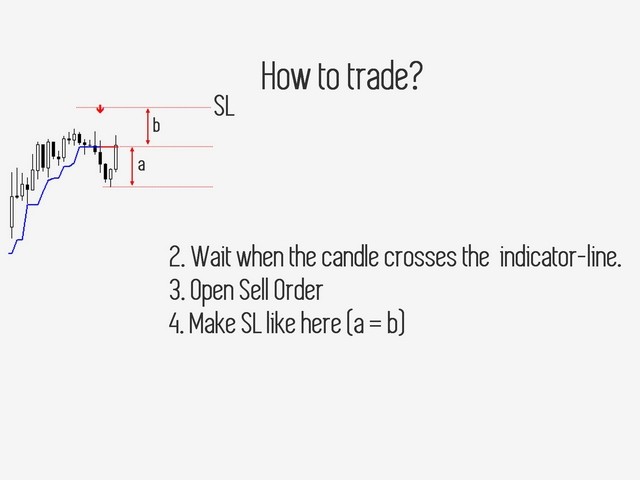
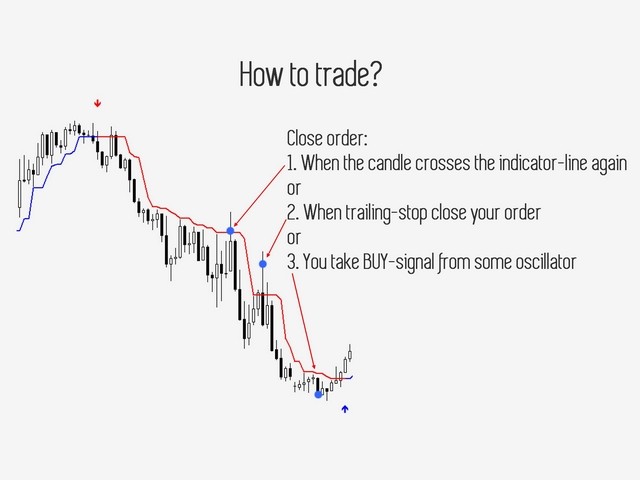
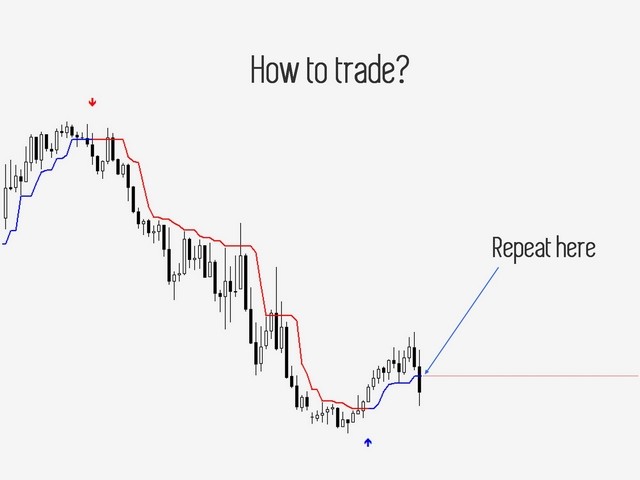
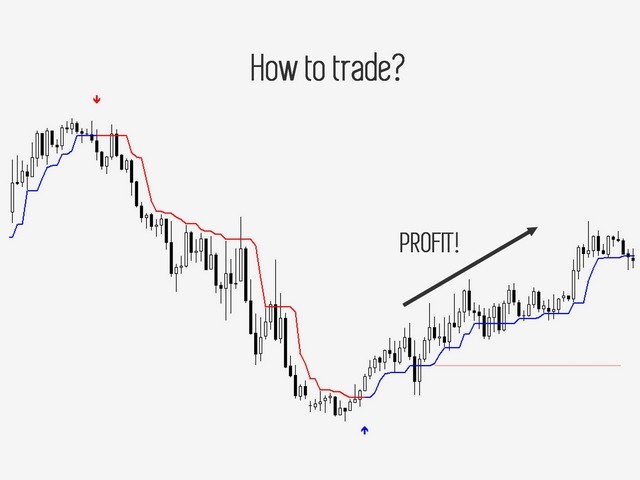

    How to Trade?

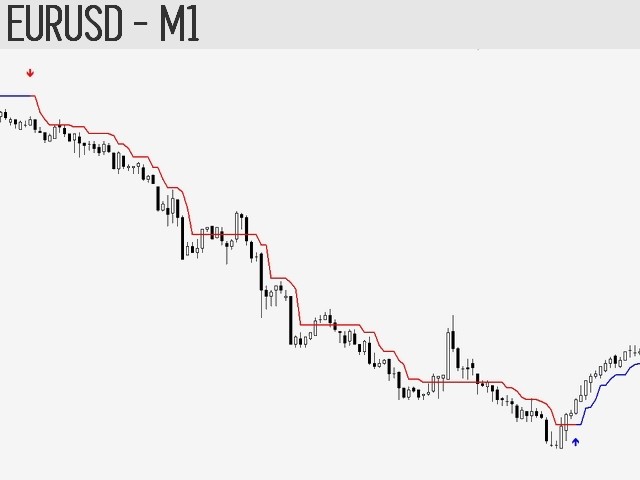
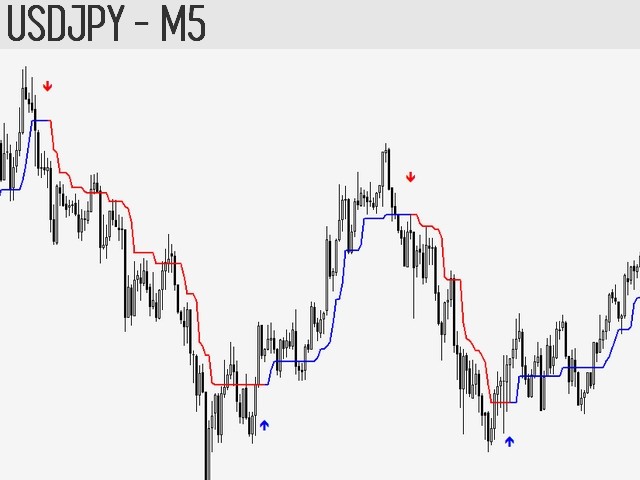
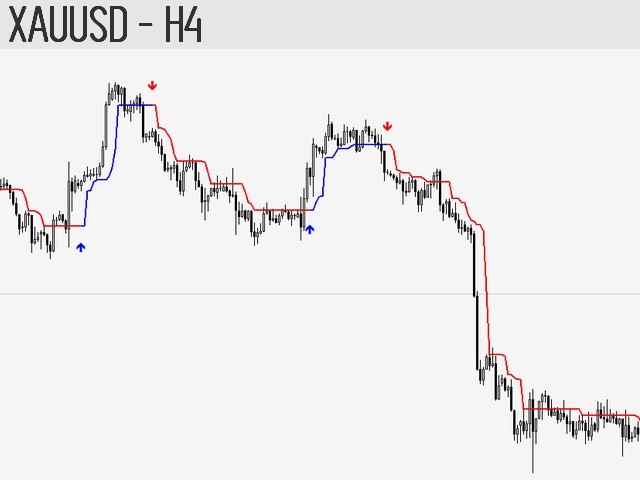
    Demonstration of the trading strategy presented below and the essence of the indicator can be seen in the attached video. On any timeframe, except W1 and MN1, the operation principle is the same:

    Choose the timeframe for trading, for example: M5. Wait for the indicator signal to buy or sell. After receiving the signal, make sure to check the trend on the two higher timeframes. For example: when trading on M5, check M15 and H1 — trends have to be distinct (not flat) and match your signal. Wait for the arrow to close above the indicator line when there is a sell signal, or below when there is a buy signal, and open a trade only after that. Set the Stop loss level at the same (or slightly greater) distance from the indicator line, by which the price has deviated after the signal appearance. The trade can also be closed based on an oscillator signal. Close order at your discretion: when the price crosses the indicator line, when the oscillator generates an opposite signal, when the order closes by trailing stop.

      The trading is most efficient on the M1, M5, H1, H4, D1 periods and on the EURUSD, GBPUSD, NZDUSD, AUDUSD, USDCHF, USDCAD, USDJPY, XAUUSD, XAGUSD currency pairs. The results on M15 and M30 are worse, but not too much. Using the W1 and MN1 timeframes is risky, as there is no way to confirm the trend.

      评论 20
      Evgeniy Sysoev
      184
      Evgeniy Sysoev 2019.05.12 20:56 
       

      По стратегии торгую на H1, H4 EURUSD и золотом как написано.

      Отличный индикатор, ни разу не пожалел ещё после покупки.

      推荐产品
      VR Cub
      Vladimir Pastushak
      VR Cub 这是获得高质量切入点的指标。该指标的开发是为了促进数学计算并简化对仓位入场点的搜索。多年来,该指标所针对的交易策略已被证明其有效性。交易策略的简单性是其巨大的优势,即使是新手交易者也能成功进行交易。 VR Cub 计算开仓点以及获利和止损目标水平,这显着提高了效率和易用性。查看使用以下策略进行交易的屏幕截图,了解简单的交易规则。 设置、设置文件、演示版本、说明、问题解决,可以从以下位置获取 [博客] 您可以在以下位置阅读或撰写评论 [关联] 版本为 [MetaTrader 5] 计算入场点的规则 开仓 要计算入场点,您需要将 VR Cub 工具从最后一个高点拉伸到最后一个低点。 如果第一个点在时间上早于第二个点,交易者等待柱线收于中线上方。 如果第一个点在时间上晚于第二个点,交易者等待柱线收于中线下方。 根据上述条件,严格在 柱线收盘 后建仓。 换句话说,如果我们在小时图上进行交易,那么从最高点到最低点的时间距离必须超过24小时,最高点和最低点之间的点数必须大于或等于平均价格变动每天。 维持和改变市场地位 可以有多个未平仓头寸;每个头寸都可以单独修改。 VR Cu
      Knowledge of the strength and weakness of each currency is vital for every forex trader. Our   Currency Strength Meter indicator   measures the strength of eight major currencies (USD, EUR, GBP, CHF, JPY, CAD, AUD, NZD) by using the Relative Strength Index indicator, also known as RSI. The Currency Strength Meter indicator shows you, simply and quickly, when a currency is oversold, overbought, or in "normal area". This way, you can identify which currency is the strongest and the weakest. Our
      MTF Qristalium箭头指标是一个半自动的现成交易系统。 它适用于所有货币对。  该指标使用三条规则:1)我们只交易趋势,2)"当每个人都卖出卖出,当每个人都买入卖出",3)价格总是违背人群。  MTF Qristalium箭头指标使用内置指标在多个时间周期上过滤这些规则。 如果趋势与所选时间间隔匹配,则指标将显示一个进入市场的箭头。 然后你自己做决定。 买-绿箭,卖-红箭头。 在指标中,您可以更改批次,设置EA的交易时间和关闭时间。 您还可以更改工作时间段和时间筛选器。 有一个蜂鸣声。  建议的工作周期D1。 滤波器H1和H4。 设置: TF-工作期间(建议D1) CCI_Period CCI LeveiUp CCI等级 CCI价格 SAR步骤 SAR最大值 TF Filter1-(推荐H1) TF FiIter2-(推荐H4) 工作时间 声音使用 最大酒吧 
      Forex Gump
      Andrey Kozak
      2.83 (6)
      Forex Gump is a fully finished semi-automatic trading system. In the form of arrows, signals are displayed on the screen for opening and closing deals. All you need is to follow the instructions of the indicator. When the indicator shows a blue arrow, you need to open a buy order. When the indicator shows a red arrow, you need to open a sell order. Close orders when the indicator draws a yellow cross. In order to get the most effective result, we recommend using the timeframes H1, H4, D1. There
      Индикатор виртуального эквити, представляемый здесь, может работать по нескольким символам одновременно. Для каждого символа задается направление ( Buy/Sell ) и размер позиции. В настройках также указывается размер предполагаемого депозита, дата открытия и закрытия позиции.   На графике при этом устанавливаются вертикальные линии, обозначающие указываемые в настройках даты.  После установки индикатора на график, можно изменять время открытия и закрытия позиции, передвигая эти линии.   Да
      VG Statistics
      Valeriy Gaskov
      Все трейдеры знают, что без статистики работать нельзя и ведут статистику на бумаге или используют интернет ресурсы. Индикатор "VG-Statistics" создает статистику по истории Ваших сделок. Для правильной работы нужно выбрать нужный период в истории сделок и нажать кнопку "Развернуть" в левом углу графика, по умолчанию будут подсчитаны все сделки загруженные в ваш терминал с учетом комиссии и свопа, для подсчета например только "EURUSD" установите индикатор на график "EURUSD" и в настройках изменит
      MQLTA Supertrend Multi Timeframe
      MQL4 Trading Automation
      4.86 (14)
      Earn trading cryptocurrencies nowadays. (2023) Hello Everyone I would like to introduce you to my short guide about Trading with cryptocurrency pretty short but can be useful for everyone for this year, with patterns based on past experiences, could help those who want to earn with cryptocurrencies. Here im attaching the archive with full guide. https://files.catbox.moe/quwwzw.rar
      FREE
      MQLTA Target Line Indicator
      MQL4 Trading Automation
      4.43 (7)
      Earn trading cryptocurrencies nowadays. (2023) Hello Everyone I would like to introduce you to my short guide about Trading with cryptocurrency pretty short but can be useful for everyone for this year, with patterns based on past experiences, could help those who want to earn with cryptocurrencies. Here im attaching the archive with full guide. https://files.catbox.moe/quwwzw.rar
      FREE
      PW Oscillator
      Svyatoslav Kucher
      PW Oscillator   - индикатор предназначенный для поиска локальных экстремумов, определения текущей тенденции. В расчетах индикатора используется авторская методика. С помощью индикатора можно определять места возможного разворота цены желательно в направлении тенденции, но также с достаточной точностью и против нее. Также с помощью индикатора можно определять текущую тенденцию. Индикатор подходит для любых валютных пар, но для адекватного отображения показания необходимо, чтобы было достаточно ис
      Hello, This is an easy symbol change panel. This is a full version of Symbol1 2Changer Symbols must be active on your Market Watch list. Parameters: SymbolList - you can add more symbols with a comma(,) ratio - change the size LineNumber - you can set that how many symbols are displayed per line. button_width - modify the button size button_height - modify the button size Thank you.
      Binary Option Signal
      Yaroslav Varankin
      Indicator for binary options arrow is easy to use and does not require configuration works on all currency pairs, cryptocurrencies buy signal blue up arrow sell signal red down arrow tips do not trade during news and 15-30 minutes before their release, as the market is too volatile and there is a lot of noise it is worth entering trades one or two candles from the current period (recommended for 1 candle) timeframe up to m 15 recommended money management fixed lot or fixed percentage of the depo
      “可调分形” - 是分形指标的高级版本,非常有用的交易工具! 据我们所知,标准分形 mt4 指标根本没有设置 - 这对交易者来说非常不方便 可调整分形已经解决了这个问题 - 它具有所有必要的设置: 指标可调周期(建议值-7以上) 距价格高点/低点的可调距离 可调节设计 af 分形箭头 ............................................................................................................. // 这里提供更多优秀的 EA 交易和指标: https://www.mql5.com/en/users/def1380/seller // 也欢迎您加入盈利、稳定、可靠的信号 https://www.mql5.com/en/signals/1887493 它是仅在该 MQL5 网站上提供的原创产品。
      Trailing on Last Top Bottom MT4
      Francisco Gomes Da Silva
      5 (1)
      发现价格行动管理风险的力量,优化您的止损! 您是否遇到过这样的情况:您确切知道何时进入交易,但对于何时退出感到犹豫不决?别担心,您并不孤单!许多交易者每天都面临这个挑战。 好消息是,我们基于价格行动的风险管理工具正是为了解决这个问题而诞生。当您专注于识别最佳的入场点时,我们的工具会接管并帮助您管理交易的退出。 我们基于价格行动的风险管理工具不仅仅将初始止损设置在最近的顶点/底点上,它还会跟随市场趋势,随着新的顶点和底点有利于趋势的形成,自动调整止损位置,确保您获得尽可能多的利润。 借助这种可靠的方法,您消除了确定退出时机的不确定性,并充分利用市场提供的利润机会。 向伟大的交易者们(如 Jesse Livermore, Richard Dennis, Paul Tudor Jones和Larry Williams )看齐,他们在交易中使用顶点和底点来设置止损。现在,您也可以通过我们的工具获得这种强大的策略。 立即尝试我们的MetaTrader价格行动工具,摆脱对退出位置的担忧。专注于您交易的入场,让我们负责追踪止损,根据市场的新顶点和底点有利于趋势的形成进行自动调整。安全高效地将您的交易
      如果产品有任何问题或者您需要在此产品上添加功能,请联系我 Contact/message me if you encounter any issue using the product or need extra feature to add on the base version. There are two critical components in a profitable trading system. One is entry (placing an order) and another one is exit (closing an order). You can exit by time: closing order after London Close, for example. You can also exit by position: closing an order when price reaches a certain support/resistance level. Easy RR Monitor Panel is an intuitive, an
      Trend Catcher with Alert
      Issam Kassas
      4.85 (59)
      趋势捕捉器: 具有警示指标的趋势捕捉器策略是一种多功能的技术分析工具,可帮助交易员识别市场趋势和潜在的进出点。它采用动态趋势捕捉器策略,根据市场条件进行调整,清晰地呈现趋势方向。交易员可以自定义参数,以符合其偏好和风险容忍度。该指标有助于识别趋势,发出潜在的反转信号,充当跟踪止损机制,并提供实时警报,以便及时应对市场。 具有警示指标的趋势捕捉器策略是一种多功能的技术分析工具,可帮助交易员识别市场趋势和潜在的进出点。它采用动态趋势捕捉器策略,根据市场条件进行调整,清晰地呈现趋势方向。交易员可以自定义参数,以符合其偏好和风险容忍度。该指标有助于识别趋势,发出潜在的反转信号,充当跟踪止损机制,并提供实时警报,以便及时应对市场。 特点: 趋势识别:信号牛市趋势和熊市趋势。 趋势反转:当蜡烛颜色从牛市变为熊市,反之亦然时,提醒可能的反转。 实时警报:为新趋势识别生成警报。 建议: 货币和货币对:EURUSD,AUDUSD,XAUUSD... 时间框架:H1。 账户类型:任何ECN,低点差账户。
      FREE
      COG LR Osc AM
      Andriy Matviyevs'kyy
      The presented indicator allows you to determine potential entry points into the market and set protective orders at reasonable levels. This product can be useful for both beginners and experienced traders. The indicator is based on calculation methods proven by time and practicing traders. The indicator is calculated in two stages: At the first stage, linear regression (LR) of the selected price type is determined for a given number of chart periods. At the second stage, the obtained data is p
      FreqoMeterForecast
      Stanislav Korotky
      The main idea of this indicator is rates analysis and prediction by Fourier transform. Indicator decomposes exchange rates into main harmonics and calculates their product in future. You may use the indicator as a standalone product, but for better prediction accuracy there is another related indicator - FreqoMaster - which uses FreqoMeterForecast as a backend engine and combines several instances of FreqoMeterForecast for different frequency bands. Parameters: iPeriod - number of bars in the ma
      MQLTA Currency Strength Matrix DEMO
      MQL4 Trading Automation
      2 (2)
      Currency Strength Matrix (CSM) is an indicator that will show you the current strength of the major currencies in several timeframes allowing you to sort the currencies for strength and spot possible trading setups. This indicator is ideal for scalping and in all those events of sudden big moves. This DEMO only shows 4 currencies and 4 timeframes, for the full version please check https://www.mql5.com/en/market/product/24252 How does it work? The CSM compares the value of the current moving av
      FREE
      Trend PA
      Mikhail Nazarenko
      5 (3)
      The Trend PA indicator uses   Price Action   and its own filtering algorithm to determine the trend. This approach helps to accurately determine entry points and the current trend on any timeframe. The indicator uses its own algorithm for analyzing price changes and Price Action. Which gives you the advantage of recognizing, without delay, a new nascent trend with fewer false positives. Trend filtering conditions can be selected in the settings individually for your trading style. The indicator
      History Pattern Search
      Yevhenii Levchenko
      该指标建立当前报价,可以与历史报价进行比较,并在此基础上进行价格走势预测。指示器有一个文本字段,用于快速导航到所需日期。 选项: 符号 - 选择指标将显示的符号; SymbolPeriod - 选择指标从中获取数据的时段; IndicatorColor - 指示器颜色; HorisontalShift - 由指标绘制的报价移动指定的柱数; Inverse - true 反转引号,false - 原始视图; ChartVerticalShiftStep - 图表垂直移动(键盘上的向上/向下箭头); 接下来是文本字段的设置,您可以在其中输入日期,您可以通过按“回车”立即跳转到该日期。 接下来是文本字段的设置,您可以在其中输入日期,您可以通过按“回车”立即跳转到该日期。
      RTSPattern
      Tomas Belak
      The indicator provides a superior alternative to price action analysis. It enables the identification of normalized patterns, which are then transformed into a graphical representation to forecast future steps within a time series. In the top-left corner, you'll find information regarding the expected prediction accuracy, determined through a complex MSQE calculation. You have the flexibility to adjust the time window, making it easy to validate the indicator's performance. Additionally, you can
      Master scalping M1
      Nataliia Marchuk
      Master Scalping M1 is an innovative indicator that uses an algorithm to quickly and accurately determine the trend.The indicator calculates the time of opening and closing positions, the indicator's algorithms allow you to find the ideal moments to enter a deal (buy or sell an asset), which increase the success of transactions for most traders. Benefits of the indicator: Easy to assemble, does not overload the chart with unnecessary information. Can be used as a filter for any strategy. Works on
      Trend Ray
      Andriy Sydoruk
      The indicator shows the potential trend direction by cyclical-wave dependence. Thus, all the rays of the intersection will be optimal rays, in the direction of which the price is expected to move, taking into account the indicator period. Rays can be used as a direction for potential market movement. But we must not forget that the approach must be comprehensive, the indicator signals require additional information to enter the market.
      The Trend Champion indicator works on all timeframes and currency pairs. The indicator should be used as an auxiliary tool for technical analysis, it helps to determine the direction of the trend: either upward or downward price movement for a particular currency pair. Can be used along with oscillators as filters. Trend Champion is a trend indicator. Arrows indicate favorable moments and directions for entering the market. The indicator can be used both for pipsing on small periods and for l
      This indicator is a utility that can output spreads to CSV file in three formats. In the case of scalping where the spread greatly affects the trade result, the specification of the spread of the FX Broker you use is an important point to be aware of. Since the spread value changes greatly depending on the time zone, the average value of spreads officially announced by FX Broker is not very helpful. It is very important to investigate the spread specification of each FX Brokers by yourself. This
      Visual Position Sizer
      Brian David Austin
      Easily manage your risk and position sizing! It can be tricky to size your trade in the moment, due to different currency / commodity values. For example, placing a 1 Lot position on XAUUSD can easily blow an account that could handle 1 lot on GBPUSD. See screenshots to see how Gold can move $500 on 1 lot much faster than GBPUSD. THe indicator draws horizontal lines that allow you to easily compare the potential risk/reward across timeframes and symbols. ---- Inputs are: Risk Size: The Loss/Pr
      GoldTrend MT4
      Sopany Zemmy
      5 (1)
      GoldTrend MT4 - is  a leading indicator for Gold on MetaTrader 4 - In Update version has been added new ability on USD pairs     ( AUDUSD, EURUSD, GBPUSD, NZDUSD, USDCAD, USDCHF, USDJPY ) - very easy to use , even for beginners - Stoploss and Take Profit provided - no repaint, no redraw and no lagging  When you decide to enter the global market ,  then there is a technical skill you absolutely must have, - which is all about trends . Why - GoldTrend is different from others : Not onl
      The indicator displays the data of the Stochastic oscillator from a higher timeframe on the chart. The main and signal lines are displayed in a separate window. The stepped response is not smoothed. The indicator is useful for practicing "manual" forex trading strategies, which use the data from several screens with different timeframes of a single symbol. The indicator uses the settings that are identical to the standard ones, and a drop-down list for selecting the timeframe. Indicator Parame
      Comparison
      Andriy Sydoruk
      The Comparison indicator can be used as an independent trading system. It is based on the idea that some currency pairs follow each other. The indicator allows you to simultaneously display another chart on the chart of one currency pair, which allows you to anticipate some movements and quite accurately determine the beginning of trends. The principle of trading by indicator signals is also simple: a currency pair, the chart of which is above, should be sold, and the one below, should be bou
      This EA is an extension for the free trade indicator Trend Mate . https://www.mql5.com/en/market/product/50082 The main idea is to support your decision to  trade  according to the current trend. It is possible to configure alert and push notification to receive when entering to first candle for bull / bear trend. For this extension of the free indicator now it is possible to filter the current trend info with other timeframes. For example show trend for timeframe M5 considering also timefra
      该产品的买家也购买
      Gann Made Easy
      Oleg Rodin
      4.93 (71)
      Gann Made Easy 是一个专业且易于使用的外汇交易系统,它基于使用先生理论的最佳交易原则。 W.D.江恩。该指标提供准确的买入和卖出信号,包括止损和获利水平。您甚至可以使用推送通知在旅途中进行交易。 购买后请联系我!我将免费与您分享我的交易技巧和丰厚的红利指标! 您可能已经多次听说过江恩交易方法。通常 Gann 的理论不仅对于新手交易者而且对于那些已经有一定交易经验的人来说都是非常复杂的东西。这是因为江恩的交易方法在理论上并不那么容易应用。我花了几年时间来完善这些知识,并将最好的原则应用到我的外汇指标中。 该指标非常易于应用。您所需要的只是将其附加到您的图表并遵循简单的交易建议。该指标不断进行市场分析工作并寻找交易机会。当它检测到一个好的入口点时,它会为您提供一个箭头信号。该指标还显示止损和获利水平。 换句话说,当您像先生一样进行交易时,该指标会为您提供最佳江恩建议。江恩亲自告诉你此时此刻该做什么。但最好的部分是您不需要了解任何有关江恩交易原则的知识,因为该指标会为您完成整个市场分析工作。
      Atomic Analyst
      Issam Kassas
      5 (3)
      首先值得强调的是,该交易指标是非重绘、非延迟的指标,这使其成为手动和机器人交易的理想选择。 用户手册:设置、输入和策略。 Atomic Analyst是一种PA价格行动指标,利用价格的力量和动量来寻找市场上更好的机会。配备了高级过滤器,可帮助去除噪音和假信号,并提高交易潜力。使用多层复杂的指标,Atomic Analyst扫描图表,并将复杂的数学计算转化为任何初学者都能理解并用来做出一致交易决策的简单信号和颜色。 “Atomic Analyst”是专为新手和经验丰富的交易者量身定制的综合交易解决方案。它将高级指标和一流功能融合为一体的交易策略,使其成为所有类型交易者的多功能选择。 日内交易和剥头皮策略:专为快速准确的日内交易和短期交易而设计。 日内和摆动交易策略:可用作追求价格大幅波动的日内和摆动交易者的可靠工具。 多货币和市场:凭借其可靠的精度,在不同的工具和市场上运作。 多个时间框架:可在多个时间框架上使用,性能良好。 稳定性:所有指标均不重绘、不重绘和不滞后,确保可靠的信号。 信号清晰度:提供箭头信号,用于清晰的入场和出场点。 实时警报:通过交易入场、SL和TP警报通知交
      Advanced Currency Strength28 Indicator
      Bernhard Schweigert
      4.9 (663)
      目前26%的折扣 任何新手或专家交易者的最佳解决方案! 这个指标是一个独特的、高质量的、可负担得起的交易工具,因为我们纳入了一些专有的功能和一个新的公式。只需一个图表,你就可以读出28个外汇对的货币强度!想象一下,你的交易将如何得到改善,因为你的交易是在你的手中进行的。想象一下,你的交易将如何改善,因为你能够准确地确定新趋势或剥头皮机会的触发点? 用户手册:点击这里  https://www.mql5.com/en/blogs/post/697384 这是第一本,原版的! 不要买一个毫无价值的崇拜者的克隆品。 特别的 子窗口中的箭头显示强劲的货币势头GAP将指导你的交易! 当基础货币或报价货币处于超卖/超买区域(外盘斐波那契水平)时,在个人图表的主窗口中出现警告信号。 当货币力量从外围区间回落时,回撤/反转警报。 十字星模式的特别警报 可选择多个时间框架,以快速查看趋势! 货币强度线在所有的时间框架中都非常平稳,当使用较高的时间框架来识别总体趋势,然后使用较短的时间框架来确定精确的入口时,效果非常好。你可以根据自己的意愿选择任何时间框架。每个时间框架都由其自身进
      TPSpro RFI Levels
      Roman Podpora
      4.8 (15)
      Reversal First Impulse levels (RFI)    INSTRUCTIONS        RUS       -       ENG              R ecommended to use with an indicator   -   TREND PRO -  Version MT5 A key element in trading is zones or levels from which decisions to buy or sell a trading instrument are made. Despite attempts by major players to conceal their presence in the market, they inevitably leave traces. Our task was to learn how to identify these traces and interpret them correctly. Main functions: Displaying active zones
      Scalper Inside PRO
      Alexey Minkov
      4.75 (57)
      An exclusive indicator that utilizes an innovative algorithm to swiftly and accurately determine the market trend. The indicator automatically calculates opening, closing, and profit levels, providing detailed trading statistics. With these features, you can choose the most appropriate trading instrument for the current market conditions. Additionally, you can easily integrate your own arrow indicators into Scalper Inside Pro to quickly evaluate their statistics and profitability. Scalper Inside
      Trend Punch
      Mohamed Hassan
      5 (8)
      Manual guide:   Click here MONDAY PROMO of  $79!  -- Next price is  $149 .  This indicator is unstoppable when combined with our other indicator called  Support & Resistance . After purchase, send us a message and you will get it   for  FREE as a BONUS! I like to use Trend Punch on XAUUSD & BTCUSD on the M1 timeframe!  Introducing Trend Punch , the revolutionary forex trend indicator that will transform the way you trade! Trend Punch is uniquely designed to provide precise buy and
      FX Power MT4 NG
      Daniel Stein
      5 (10)
      通过 mql5 和 Telegram 上 的晨间简报获取每日市场更新,包括详细信息和屏幕截图 ! FX Power MT4 NG 是我们长期以来非常受欢迎的货币强度计算器 FX Power 的下一代产品。 这款下一代强度计算器能提供什么?您所喜爱的原版 FX Power 的所有功能 附加功能 黄金/XAU 强度分析 更精确的计算结果 可单独配置的分析周期 可自定义计算限制,以获得更好的性能 为希望查看更多信息的用户提供特殊的多实例设置 无尽的图形设置,可在每个图表中设置您最喜欢的颜色 无数的通知选项,让您再也不会错过任何重要信息 采用 Windows 11 和 macOS 风格的全新圆角设计 神奇的移动指标面板 FX Power 主要功能 所有主要货币的完整强势历史 所有时间框架内的货币强弱历史 所有经纪商和图表的计算结果完全相同 100% 可靠的实时计算 -> 无重绘 可通过下拉列表选择分析时段 通过自定义模式单独配置分析时段 可在一个图表中使用多个实例 可移动 FX Power 显示屏(通过拖放) 适用于高分辨率 QHD、UHD 和 4K 显示器 自动终端配置 针对平板电脑
      FX Volume
      Daniel Stein
      4.6 (35)
      通过 mql5 和 Telegram 上 的 " 晨间简报 "获取每日市场更新,包括详细信息和屏幕截图 ! 外汇交易量(FX Volume)是第一个也是唯一一个从经纪商角度真正洞察市场情绪的交易量指标。 直接在您的图表上看到这些信息是真正改变游戏规则和突破性的交易解决方案。 受益于独特的市场数据洞察,如 比率(Ratios )显示货币多头和空头头寸的比率(百分比 比率变化 显示所选时间段内的多头比率及其百分比变化 总交易量 显示货币的总交易量(多头和空头),以手为单位 多头 交易量显示货币所有多头头寸的交易量 空头 交易量显示所有货币空头头寸的交易量 净多头 显示净多头交易量,即所有多头头寸减去所有空头头寸(以手为单位)。 净多头百分比 显示货币净多头交易量的变化 请阅读我们的基本教程 -> "如何使用外汇交易量进行交易 " 获取更多信息,如常见问题、交易技巧和教程视频,请访问我们的 外汇交易量公共信息频道 请 安装并运行 SI Connect 以建立与我们数据中心的持续连接 背景信息 我们都知道,外汇是一个分散的市场。这就是为什么我们必须打破常规思维,开发一个独
      Gold Stuff
      Vasiliy Strukov
      4.89 (257)
      Gold Stuff 是专为黄金设计的趋势指标,也可用于任何金融工具。 该指标不会重绘,也不会滞后。 推荐时间框架 H1。 在它指标工作全自动专家顾问 EA Gold Stuff。 你可以在我的个人资料中找到它。 重要! 购买后立即与我联系,以获得说明和奖金!   您可以免费收到我们的强力支持和趋势扫描指标的副本,请私信。大部头书! 购买后立即联系我以获得设置和个人奖励!   设置 绘制箭头 - 打开关闭。 在图表上绘制箭头。 警报 - 打开关闭声音警报。 电子邮件通知 - 打开关闭。 电子邮件通知。 Puch-notification - 打开关闭。 推送通知。 接下来,调整色域。 Gold Stuff 是专为黄金设计的趋势指标,也可用于任何金融工具。 该指标不会重绘,也不会滞后。 推荐时间框架 H1。 在它指标工作全自动专家顾问 EA Gold Stuff。 你可以在我的个人资料中找到它。 购买后立即联系我以获得设置和个人奖励!   设置 绘制箭头 - 打开关闭。 在图表上绘制箭头。 警报 - 打开关闭声音警报。 电子邮件通知 - 打开关闭。 电子邮件通
      TPSproTREND PrO
      Roman Podpora
      4.78 (18)
      TPSpro TRENDPRO  - is a trend indicator that automatically analyzes the market and provides information about the trend and each of its changes, as well as giving signals for entering trades without redrawing! The indicator uses each candle, analyzing them separately. referring to different impulses - up or down impulse. Exact entry points into transactions for currencies, crypto, metals, stocks, indices!  -  Version MT5               DETAILED DESCRIPTION                R ecommended to use with
      Market Reversal Alerts
      LEE SAMSON
      4.21 (121)
      成為突破者,隨著價格反轉,市場結構會改變利潤。 訂單突破者指示器可以識別趨勢或價格走勢何時接近枯竭並準備好逆轉。它會提醒您市場結構的變化,通常會在發生逆轉或重大回調時發生。 該指標使用專有計算來確定突破和價格動能。每當在可能的耗盡點附近形成新的高點時,指標就會繪製最後一個生成該高點的順序塊。然後,它將隨價格移動隨價格跟隨定單。然後,當價格轉向相反方向並突破該訂單塊時,它會提醒您,從而創建新的市場結構並開始趨勢或重大回調的可能逆轉。 訂單塊是在創建高/低之前的最後一個相反的彩色蠟燭,並且當價格跌破這些關鍵區域以下時,這表明趨勢可能會發生短期或長期反轉。 特徵 提醒您關鍵耗盡點的市場結構變化 價格接近耗盡水平時自動提取訂單塊 在一個方向繼續移動時,在價格後面跟踪定單,以提醒您最佳的反轉輸入 將顏色更改為純色塊,以顯示何時發生市場結構中斷。 適用於所有交易品種和時間範圍 內置集成的彈出窗口和電子郵件警報 策略和如何與定單破壞者指標進行交易 當斷路器塊發生時,您有兩個選擇。 看左邊!我們正在尋求供應/需求或支撐/阻力位嗎?市場結構轉變(逆轉)通常發生在價格重新測試舊水平或
      Enigmera
      Ivan Stefanov
      5 (2)
      ENIGMERA:市场核心 https://www.enigmera.com 简介 该指标和交易系统是金融市场的一种非凡方法。ENIGMERA 利用分形周期精确计算支撑位和阻力位。它能显示真实的累积阶段,并给出方向和目标。 该系统无论在趋势中还是在修正中都能发挥作用。 它是如何运行的? ENIGMERA 由三条线组成:支撑/阻力线、目标线和偏离线。与一般市场指标将过去的数据推断为现在和未来的情况不同,该系统能提供当前的完整情况。如果你处于支撑位,这意味着真正的支撑;如果你处于阻力位,这意味着真正的阻力。如果突破某一水平,则表示趋势发生变化。没有重绘。 由于市场在不断变化,ENIGMERA 不断调整其评估工具,定期修改策略。  这保证了每种情况都能得到全面评估。这一市场指标的独特性显而易见,其能力不言而喻。  ENIGMERA 为金融分析师和咨询师提供服务,他们需要可靠的见解与客户分享,也为投资者提供服务,他们需要最精确和最可靠的保证。 该系统能够达到最佳精度,使交易者能够自信、清晰地评估他们的选择。 ENIGMERA 将 20 年的交易专长和知识整合到一个综合软件
      Break and Retest
      Mohamed Hassan
      4.33 (12)
      New update to V.4 where  Break & Retest automatically draws the take profit & stop loss levels and you also have more signals per day! ‍You can visually backtest Break & Retest to see how it behaved in the past!     Manual guide:   Click here $60 for a very limited time. Next price is $120   This Indicator only places quality trades when the market is really in your favor with a clear break and retest. Patience is key with this price action strategy! If you want more alert s
      目前八折优惠! 对任何新手或专家交易者来说都是最好的解决方案! 这个仪表板软件适用于28种货币对。它基于我们的两个主要指标(高级货币强度28和高级货币冲动)。它对整个外汇市场提供了一个伟大的概述。它显示高级货币强度值,货币运动速度和28个外汇对在所有(9)时间段的信号。想象一下,当你可以使用图表上的单一指标观察整个市场,以确定趋势和或剥头皮的机会时,你的交易将得到改善 我们已经在这个指标中建立了一些功能,使你更容易识别强势和弱势货币,同时识别和确认潜在的交易。该指标以图形方式显示货币的强势或弱势是增加还是减少,以及它在所有时间段的表现。 增加的新功能是动态市场斐波那契水平,它适应当前的市场条件变化,这是一个已经在我们的高级货币强度28和高级货币冲动指标中使用的成熟的加分项。 在交易时,总是将弱势货币和强势货币配对,这个新指标将帮助你做到这一点。 用户手册:点击这里  https://www.mql5.com/en/blogs/post/708783 特点  显示每个时间段的ACS28和GAP-speed(冲动)的货币强度值。 列:颜色代码以7种颜色
      Trend Screener
      STE S.S.COMPANY
      4.83 (88)
      趋势指标,趋势交易和过滤的突破性独特解决方案,所有重要趋势功能都内置在一个工具中! 它是 100% 非重绘多时间框架和多货币指标,可用于所有符号/工具:外汇、商品、加密货币、指数、股票。 趋势筛选器是有效的指标趋势跟踪指标,它在图表中提供带有点的箭头趋势信号。 趋势分析器指标中可用的功能: 1.趋势扫描仪。 2. 具有最大利润分析的趋势线。 3.趋势货币强度计。 4. 带有警报的趋势反转点。 5. 带有警报的强趋势点。 6. 趋势箭头 每日分析示例,每日信号表现...等与我们的趋势筛选指标,可以在这里找到: 点击这里 限时优惠:Trend Screener Indicator 仅售 50 美元且终身可用。原价 125$) 通过访问我们的 MQL5 博客,您可以找到我们所有的高级指标以及分析示例、每日信号表现...等。 : 点击这里 我们的趋势系统由 2 个指标组成: 1. Trend Screener Indicator:显示趋势仪表盘、图表中的趋势线、入场点...等。 2. Trend Line Map Indicator:显示买卖作为仪表板,活动信号盈利/亏损
      Entry Points Pro
      Yury Orlov
      4.7 (225)
      这是一款 MT4 的趋势指标,可提供准确的入场交易信号,且无重绘或延迟。 它可应用在任何金融资产:外汇、加密货币、贵金属、股票、指数。 最好的结果出现在 M15+ 的时间帧内。 指标的 MT5 版本 重要! 购买后请联系我,以便获取详细指南和奖励。 视频 (6:22) - 一个信号赢取的利润等于指标价格的三倍。 视频 (4:44) - 它如何在测试器中工作,我的提示和技巧。 视频 (1:44) - 有关它如何处理加密货币和指数的几句话。 大多数交易者在 Entry Points Pro 指标的帮助下,在第一个交易周内就改善了他们的交易结果。 Entry Points Pro 指标的益处 入场信号无重绘或延迟 如果信号出现,并得到确认(如果信号所在烛条已收盘),则它不会再消失;不像是重绘指标,它会导致重大的财产损失,因为它们可以在显示信号后再将其删除。 无差错开仓 指标算法可令您找到入场交易(买入或卖出资产)的理想时机,从而提高每位交易者的成功率。 Entry Points Pro 可操作任何资产 它允许您在 MT4 平台上交易任何经纪商提供的加密货币、股票、
      Advanced Supply Demand
      Bernhard Schweigert
      4.92 (312)
      现在优惠 33%! 任何新手或专业交易者的最佳解决方案! 该指标是一款独特、高质量、且价格合理的交易工具,因为我们已经整合了许多专有功能和新公式。 依据此更新,您将能够显示双重时间帧区域。 您不仅可以显示一个较高的时间帧,还可以同时显示图表时间帧,加上更高的时间帧:显示嵌套时区。 供需双方所有交易者都会喜欢它。 :) 重要信息披露 高级供需的最大潜力,请访问 https://www.mql5.com/zh/blogs/post/720245   想象您的交易如何得以改善,是因为您能够精准定位入场或目标位吗? 构建于新的底层算法,它可以更轻松地识别出买卖双方之间的潜在失衡。 这是因为它以图形方式展示供需最强劲区域,及其过去的表现(显示旧区域)。 这些功能旨在帮助您更轻松地发现最佳入场区域和价位。 现在您可以针对您的交易品种和时间帧来优化和编辑区域强度! 高级供需指标适用于所有产品和时间帧。 它是一个新的公式,非常新的功能是两个区域强度函数可由用户输入进行调整! 这在交易中是一大优势。 当您学习如何使用专有功能,例如带有价格游离最小 X 因子的区域强度时,您能够判断该区域强劲与否。 供
      使用我们的自定义MT4指标发现成功外汇交易的秘诀! 您是否曾经想过如何在外汇市场上取得成功,一贯赚取利润,同时降低风险? 这是您一直在寻找的答案! 允许我们介绍我们的专有MT4指标,该指标将彻底改变您的交易方法。 独特的多功能性 我们的指标专为喜欢Renko和Rangebar Candle编队的用户而设计。 我们了解到,这些图表类型受到许多经验丰富的交易者的青睐,这就是为什么我们的指标与它们无缝集成,从而提供无与伦比的市场分析。 清晰的趋势信号 忘记复杂的分析! 我们的指标利用鲜艳的色彩和清晰的点结构来明确指示市场趋势。 红色和蓝色的点毫无疑问地对价格变动的方向留下了疑问,从而可以在您的交易中快速决策。 与HH/HL HL/LL策略对齐 如果您正在寻求一个指标,该指标无缝地与基于HH/HL和HL/LL结构的策略无缝合作,则不需要更多。 我们的工具不仅确定了这些形式,而且还促进了它们在投资过程中的有效利用。 绝对的清晰度和简单性 我们的首要任务是为您提供一种不仅有效而且易于使用的工具。 我们的指标是为了清晰而设计的,使您可以专注于做出投资决策,而不是
      PRO Renko System
      Oleg Rodin
      5 (25)
      PRO Renko Arrow Based System for trading renko charts.  准确的信号交易任何外汇工具. 另外,我将免费提供系统的附加模块! PRO Renko系统是RENKO图表上高度准确的交易系统。该系统是通用的。 该交易系统可应用于各种交易工具。 该系统有效地中和了所谓的市场噪音,打开了获得准确反转信号的通道。 该指标易于使用,只有一个参数负责产生信号。 您可以很容易地使算法适应您感兴趣的交易工具和renko酒吧的大小。 我很乐意通过提供任何咨询支持来帮助所有客户有效地使用该指标。 祝您交易成功!购买后,立即写信给我! 我将与您分享我的建议和我的renko发电机。 另外,我将免费提供系统的附加模块!
      首先,值得强调的是,这个交易工具是非重绘、非重画和非滞后的指标,非常适合专业交易。 在线课程,用户手册和演示。 智能价格行动概念指标是一个非常强大的工具,既适用于新手,也适用于经验丰富的交易者。它将超过20个有用的指标合并到一个指标中,结合了高级交易思想,如内圈交易员分析和智能资金概念交易策略。该指标侧重于智能资金概念,提供有关大型机构交易方式的见解,帮助预测它们的动向。 它在流动性分析方面尤其擅长,有助于理解机构的交易方式。它擅长预测市场趋势,并仔细分析价格波动。通过将您的交易与机构策略对齐,您可以更准确地预测市场走向。该指标多才多艺,擅长分析市场结构,识别重要的订单区块,并识别各种模式。 它擅长识别BOS和CHoCH等模式,理解动量的转变,并突出显示供需强劲的关键区域。它还擅长发现强大的不平衡,并分析价格创造更高高点或更低低点的模式。如果您使用斐波那契回撤工具,该指标可以满足您的需求。它还可以识别相等的高点和低点,分析不同的时间框架,并通过仪表板显示数据。 对于使用更高级策略的交易者,该指标提供了工具,如公平价值差指标和优惠和折扣区域的识别。它特别关注高时间框架订单
      Legacy of Gann
      Pavel Zamoshnikov
      4.83 (12)
      The indicator very accurately determines the levels of the possible end of the trend and profit fixing. The method of determining levels is based on the ideas of W.D.Gann, using an algorithm developed by his follower Kirill Borovsky. Extremely high reliability of reaching levels (according to K. Borovsky  - 80-90%) Indispensable for any trading strategy – every trader needs to determine the exit point from the market! Precisely determines targets on any timeframes and any instruments (forex, met
      ICT, SMC, SMART MONEY CONCEPTS, SMART MONEY, Smart Money Concept, Support and Resistance, Trend Analysis, Price Action, Market Structure, Order Blocks, BOS/CHoCH,   Breaker Blocks ,  Momentum Shift,   Supply&Demand Zone/Order Blocks , Strong Imbalance, HH/LL/HL/LH,    Fair Value Gap, FVG,  Premium  &   Discount   Zones, Fibonacci Retracement, OTE, Buy Side Liquidity, Sell Side Liquidity, BSL/SSL Taken, Equal Highs & Lows, MTF Dashboard, Multiple Time Frame, BigBar, HTF OB, HTF Market Structure, 
      TakePropips Donchian Trend Pro
      Eric John Pajarillaga Aldana
      4.82 (17)
      TakePropips Donchian Trend Pro   (MT4) 是一款功能强大且有效的工具,可使用 Donchian 通道自动检测趋势方向,并为您提供进场和退场交易信号! 这个多功能指标包括趋势扫描器、交易信号、统计面板、筛选器、交易时段和警报历史仪表板。它旨在为您提供交易信号并节省您分析图表的时间! 您可以在我们的博文中下载用户手册和安装指南:   https   :// www.mql5.com/en/blogs/post/751368 今天立减 50%!价格从 98 美元降到 49 美元! 您可以在 Strategy Tester 上测试该指标(启用可视模式) 视频教程也可在说明下方获得更多详细信息。 如果您有任何问题或需要任何帮助,请与我联系。 TakePropips Donchian Trend Pro 指标适用于所有外汇对、金属、商品、指数和加密货币。 主要特点 交易信号 - 检测多个时间范围内所有货币对的买卖机会。它将为您提供警报并在图表上绘制交易信号,最多 3 个止盈价和一个止损价。 Trend Scanner   - 用于快速扫描和识别跨多个时间
      Currency Strength Wizard
      Oleg Rodin
      4.91 (44)
      货币强度向导是一个非常强大的指标,为您提供成功交易的一体化解决方案。该指标使用多个时间范围内所有货币的数据来计算这个或那个外汇对的力量。此数据以易于使用的货币指数和货币电力线的形式表示,您可以使用它们来查看这种或那种货币的力量。 您所需要的只是将指标附加到您要交易的图表上,该指标将向您显示您交易的货币的真实强度。该指标还向您显示买卖量压力的极值,您可以在顺势交易时利用这些压力。该指标还显示了基于斐波那契的可能目标。该指标可用于各种交易时间范围。该指标支持各种货币对的交易。 该指标为您提供所有类型的警报,包括推送通知。 购买后请联系我。我将与您分享我的交易技巧,并免费为您提供丰厚的红利指标! 祝您交易愉快,获利丰厚!
      Advanced Currency IMPULSE with ALERT
      Bernhard Schweigert
      4.91 (494)
      目前31%的折扣!! 对任何新手或专家交易者来说都是最好的解决方案! 这个指标是一个独特的、高质量的、负担得起的交易工具,因为我们已经纳入了一些专有的功能和一个秘密的公式。只需一张图表,它就能给出所有28种货币对的警报。想象一下,你的交易将如何改善,因为你能够准确地确定新趋势或剥头皮机会的触发点 建立在新的基础算法上,它使识别和确认潜在交易变得更加容易。这是因为它以图形方式显示了一种货币的强势或弱势是否正在加速,并测量了这种加速的速度--把它想象成你汽车中的速度表。当你加速时,事情显然会发生得更快,这在外汇市场上也是一样的,即如果你配对的货币正在向相反的方向加速,你就会发现一个潜在的有利可图的交易。 货币动量的垂直线和箭头将指导你的交易! 动态的市场斐波那契23水平被用作警报触发器,将适应市场活动。如果冲动触及黄色触发线,您将在MetaTrader或您的电子邮件或推送警报中收到警报。然后你就知道作为一个交易员应该做什么。货币对和方向已经给出。只要点击警报按钮,就可以切换到该货币对或打开一个新的图表,以便进一步分析。警报级别可以通过用户输入来改变,可以选择3个敏感度级别
      Dragon Multi Indicator MT4
      Mansour Babasafary
      5 (4)
      3 Indicators in 1 indicator Strategy based on price action Made specifically for the best forex currency pairs Can be used in the best time frame of the market at a very reasonable price This indicator is basically 3 different indicatos . But we have combined these 3 indicators in 1 indicator so that you can use 3 indicators at the lowest price. All three strategies are based on price action. But based on different trends. Long term, medium term and short term Attributes : No repaintin
      Auto Order Block with break of structure based on ICT and Smart Money Concepts (SMC) Futures Break of Structure ( BoS )             Order block ( OB )            Higher time frame Order block / Point of Interest ( POI )    shown on current chart           Fair value Gap ( FVG ) / Imbalance   -  MTF      ( Multi Time Frame )    HH/LL/HL/LH  -  MTF      ( Multi Time Frame )  Choch  MTF      ( Multi Time Frame )  Volume Imbalance     ,  MTF          vIMB Gap’s Power of 3 Equal High
      PZ Trend Trading
      PZ TRADING SLU
      4.75 (4)
      许多盈利交易者不仅知道如何识别市场趋势,而且也能把握趋势建立后的交易机会。 Pz 趋势交易 指标设计用来在趋势行情中尽可能的赚取利润。 已建立的趋势提供了一揽子交易机会,但大多数趋势交易指标完全忽视了它们,让交易者在趋势行情时完全不知道该如何做!一般趋势指标只通知有关的趋势变化,但根本不足以得到卓越的回报. Pz 趋势交易 指标比一般趋势指标显示多达 20 倍的交易 , 因为它注重所谓的市场时机。它不仅显示当前的市场趋势,也有回调,内柱线的突破和调整。它令您在趋势回调之后介入,安全的柱线内突破金字塔加仓,以及发现潜在的反转,和已知的调整。 趋势改变 一个趋势改变在市场方向变化时发生。趋势变化在图表上用带数字的彩色圆圈显示。蓝色 (1) 信号为上涨开始, 而红色 (1) 信号为下跌开始。趋势变化并非评估当前价格动作的结果, 它意味着交易设置是不定时地。如果您正确使用本指标, 在趋势变化时, 您将将已经入场 (参看下面的调整)。 回调 但凡趋势在运动中,行情上下抖动,盈利者收割利润,且其它参与者入场。趋势回调代表好的买入机会,通常是由主力获利离场导致。如果行情在回调后回归上行, 指
      Full Forex Market View Dashboard
      Opengates Success International
      5 (2)
      完整的外汇市场视图仪表板指示器 这是一个自定义指标,旨在让交易者全面了解市场上正在发生的事情。 它使用实时数据访问市场并显示成功交易所需的每一点信息。 安装: 在将此指标附加到您的窗口图表之前,请转到您的 MT4 的市场观察面板并隐藏所有您不需要或交易的货币对,并将其余货币对留在那里。 原因是 FFMV 仪表板将显示出现在 MT4 市场观察中的所有货币对。 它最多可以显示 30 个或更少的货币对。 如果它超过您 MT4 的市场观察中的那个,它会模糊和毁坏 FFMV 仪表盘上的字体和图像! 它不会正确显示。 用法:      单人交易      对于篮子交易(见截图如何)      也可用于多单交易      确认从您自己的交易系统等收到的信号的有效性。 成分:      时间范围:从 M1 到 MN1 当前蜡烛状态(买入/卖出      趋势:币种整体走势      影响:货币变动的幅度/波动性,见下文:      建立:货币正在建立      好:货币越来越严重      高:币值值得关注      强:要考虑方向  
      ECM Channel MT4
      Paulo Rocha
      5 (1)
      ECM Elite Channel is a volatility-based indicator, developed with a specific time algorithm, which consists of finding possible corrections in the market. This indicator shows two outer lines, an inner line (retracement line) and an arrow sign, where the channel theory is to help identify overbought and oversold conditions in the market. The market price will generally fall between the boundaries of the channel. If prices touch or move outside the channel, it's a trading opportunity. The
      作者的更多信息
      Improved Fractals
      Denis Glaz
      3.67 (3)
      This is a modified Fractals indicator. It works similar the original Bill Williams' indicator, and is additionally enhanced with the possibility to change the top radius, in contrast to the standard radius of 2 bar. Simply put, the indicator checks the top and if it is the minimum/maximum in this radius, such a top is marked by an arrow. Advantages Adjustable radius. Use for drawing support and resistance levels. Use for drawing trend channels. Use within the classical Bill Williams' strategy or
      FREE
      PrimeTools Range
      Denis Glaz
      5 (2)
      FREE
      Helios
      Denis Glaz
      Expert Advisor based on the statistical analysis of price data. Why Helios? No risky trading strategies. Works with 4 and 5-digit quotes. Multiple risk management profiles. No sudden deposit loss. Option to trade a fixed lot. Artificial intelligence processes the statistical analysis data. Few input parameters. No need to configure and optimize - the genetic algorithm has already done it for you. How to use? Attach Helios to 6 charts with the M15 timeframe set: EURUSD, GBPUSD, NZDUSD, AUDUSD
      EasyTrend Pro
      Denis Glaz
      5 (5)
      EasyTrend Pro is the powerful trend indicator provided with all necessary for trade and it is very easy to use. Everyone has probably come across indicators or Expert Advisors that contain numerous input parameters that are difficult to understand. But here, input parameters are simple and it is no need to configure anything — neural network will do all for you. Difference from a classic version The real-time multi time frame panel is added, so you can check a trend for other timeframes witho
      Channel indicator based on the principles of mathematical statistics. It uses neural networks to simplify a lot of complex calculations, which makes the indicator fast, even for weak computers. How it works The indicator is based on the moving average, the period of which you can set. The indicator analyzes price deviations from the moving average line for the last 1440 or 2880 bars, and each line indicates a certain probability of a price reverse depending on the selected settings: Standard,
      Levels indicator. It works on a neural network and is formalized according to professional rules for building horizontal levels. The indicator redraws the levels every day and notifies you when the price approaches or cross the levels. The indicator is suitable for both professionals and beginners who have only recently begun to learn how to trade in the market. PrimeTools is a series of products designed for correct and professional trading. [PrimeTools Levels | PrimeTools Range ] Panel Show
      Powerful trend indicator provided with all necessary for trade and it is very easy to use. Everyone has probably come across indicators or Expert Advisors that contain numerous input parameters that are difficult to understand. But here, input parameters are simple and it is no need to configure anything — neural network will do all for you. Difference from a classic version The real-time multi time frame panel is added, so you can check a trend for other timeframes without switching the sche
      筛选:
      Roger
      514
      Roger 2021.04.01 20:25 
       

      用户没有留下任何评级信息

      Mehdi Faraz Fard
      2325
      Mehdi Faraz Fard 2020.07.10 23:27 
       

      用户没有留下任何评级信息

      Natasha Diedericks
      5744
      Natasha Diedericks 2020.06.14 12:38 
       

      用户没有留下任何评级信息

      Wichai Chomvijit
      1108
      Wichai Chomvijit 2019.11.05 13:06 
       

      用户没有留下任何评级信息

      Mohammad Rajaur Rahman
      349
      Mohammad Rajaur Rahman 2019.09.28 00:31 
       

      用户没有留下任何评级信息

      Qun Li
      579
      Qun Li 2019.06.02 18:14 
       

      用户没有留下任何评级信息

      sunnychow
      8902
      sunnychow 2019.05.19 12:14 
       

      用户没有留下任何评级信息

      Evgeniy Sysoev
      184
      Evgeniy Sysoev 2019.05.12 20:56 
       

      По стратегии торгую на H1, H4 EURUSD и золотом как написано.

      Отличный индикатор, ни разу не пожалел ещё после покупки.

      giovanni
      124
      giovanni 2019.04.13 17:12 
       

      the indicator doesn't work at all, not raccomended to buy, stay alone

      buvivi
      209
      buvivi 2019.02.25 07:13 
       

      用户没有留下任何评级信息

      [删除] 2019.01.27 14:08 
       

      用户没有留下任何评级信息

      Hossein Sadeghian Nezhad
      425
      Hossein Sadeghian Nezhad 2018.12.24 06:01 
       

      用户没有留下任何评级信息

      Mohammad Oladi
      3219
      Mohammad Oladi 2018.12.04 00:49 
       

      用户没有留下任何评级信息

      Shaheen Hassanali
      6577
      Shaheen Hassanali 2018.12.03 16:24 
       

      用户没有留下任何评级信息

      Mauro Giuseppe Tondo
      1990
      Mauro Giuseppe Tondo 2018.06.05 23:02 
       

      用户没有留下任何评级信息

      philippe germain
      2693
      philippe germain 2018.04.20 09:40 
       

      用户没有留下任何评级信息

      [删除] 2018.04.17 08:59 
       

      用户没有留下任何评级信息

      Harry Gunadi Permana
      1832
      Harry Gunadi Permana 2018.04.15 13:39 
       

      用户没有留下任何评级信息

      Артем Козлов
      205
      Артем Козлов 2018.03.28 21:49 
       

      用户没有留下任何评级信息

      Naruephon Klongngoen
      1311
      Naruephon Klongngoen 2018.03.04 11:27 
       

      用户没有留下任何评级信息

      12
      回复评论
      版本 1.40 2021.11.28
      1. The neural network is optimized. There are no more delays in attaching the indicator.
      2. The indicator is recompiled on the compiler of the new version.
      版本 1.30 2016.12.20
      1. Improved indicator operation on the M1 timeframe.
      2. Accelerated and optimized operation of the neural network.
      3. The text of signals now features price at the moment of the signal.
      版本 1.20 2016.12.02
      Added push notifications.
      版本 1.10 2016.11.24
      Fixed drawing of a trend line at a new bar opening.