PRO Dinapoli Fibonacci Tool MT4
- 指标
- Samil Bozuyuk
- 版本: 1.0
- 激活: 20
The indicator is the advanced form of the MetaTrader 4 standard Fibonacci tool. It is unique and very reasonable for serious Fibonacci traders.
Key Features
Drawing of Fibonacci retracement and expansion levels in a few seconds by using hotkeys.
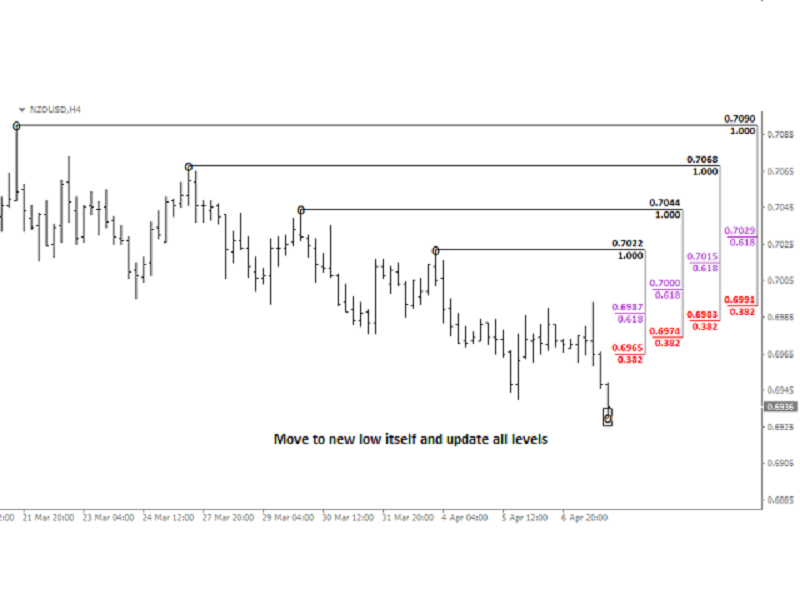
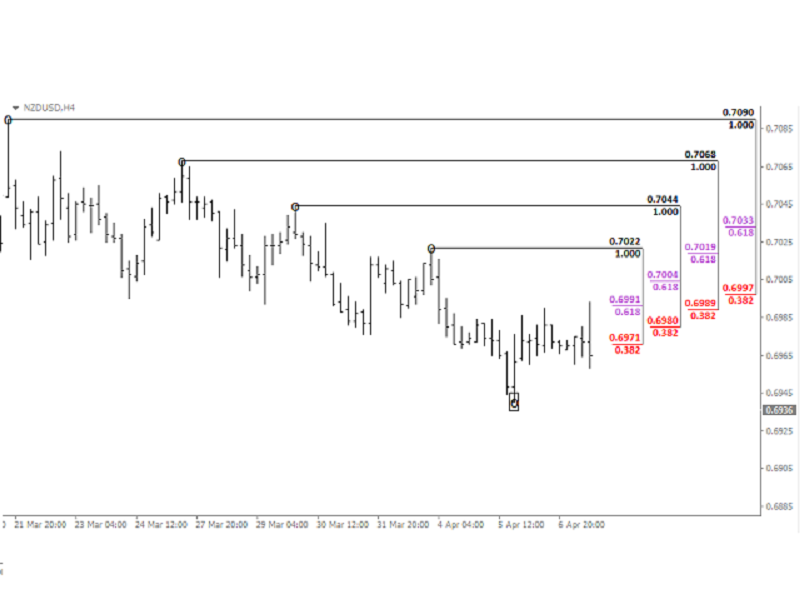
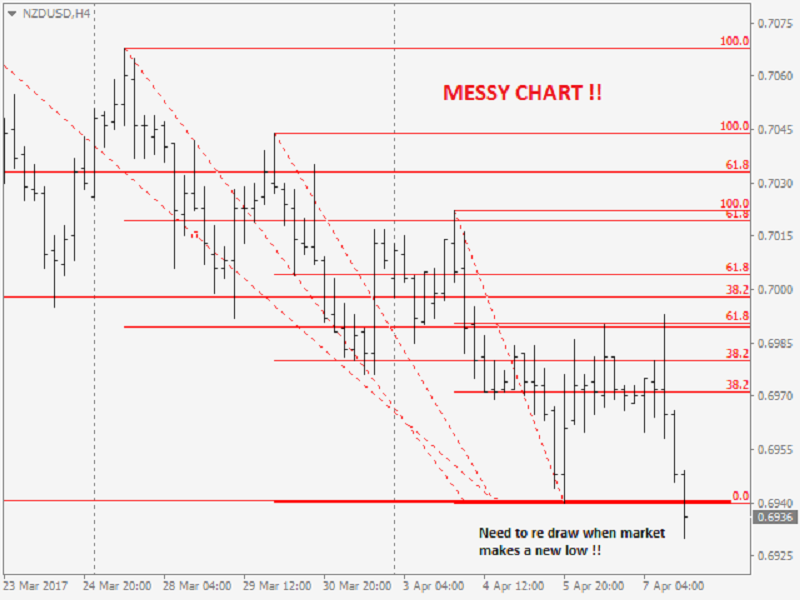
Auto adjusting of retracement levels once the market makes new highs/lows.
Ability to edit/remove any retracement & expansion levels on chart.
Auto snap to exact high and low of bars while plotting on chart.
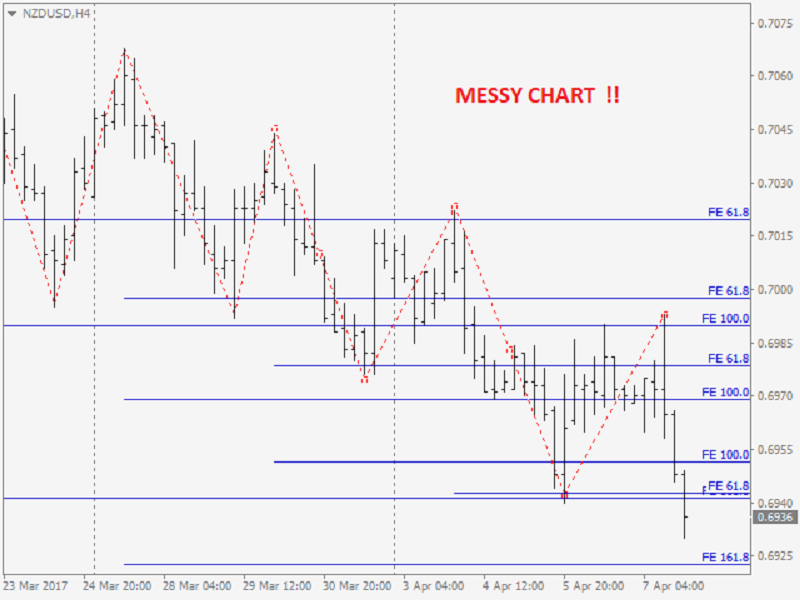
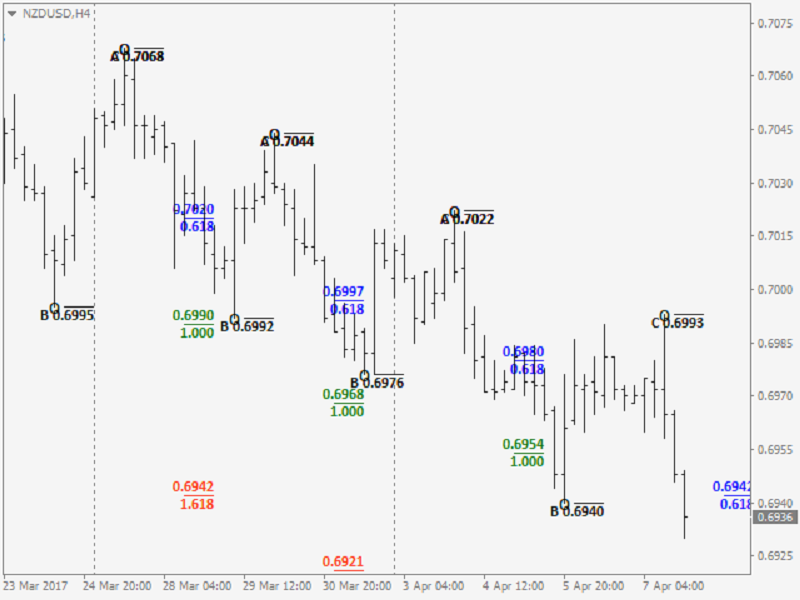
Getting very clear charts even though many retracement and expansion series drawn on it.
Keyboard Shortcuts (Hotkeys)
Shift+E: Initiate a new expansion drawing sequence.
Ctrl+Shift+E: Remove all expansions placed on a chart.
Ctrl+Shift+X: Remove last expansion placed on a chart.
Shift+X: undo last click when clicking ABC’s.
Shift+D: Initiate a new retracement drawing sequence.
Ctrl+Shift+D: Remove all retracements placed on a chart.
Ctrl+Shift+Z: Remove last retracement placed on chart.
Shift+Z: undo last click when plotting retracements.
ESC: stop drawing when tool is active.
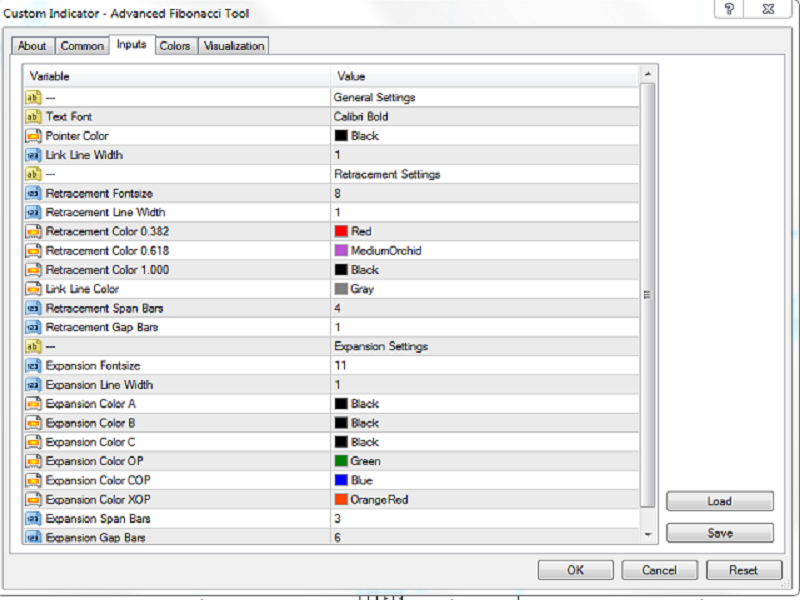
Indicator Parameters
Text Font - Font of any text on chart can be adjusted.
Font Size of Retracement Levels - Size of texts for retracement lines on chart can be adjusted.
Color of Retracement Levels - Colors of retracement lines and texts on chart.
Width of Retracement Levels - Width of retracement lines on chart.
Font Size of Expansion Levels - Size of texts for expansion lines on chart can be adjusted.
Color of Expansion Levels - Colors of expansion lines and texts on chart.
Width of Expansion Levels - Width of expansion lines on chart.
Custom Retracement - Any user defined retracement level can be displayed.
Custom Expansion - Any user defined expansion level can be displayed.
For MT5 version, please visit ► https://www.mql5.com/en/market/product/52835
For My Other Products; please visit ► https://www.mql5.com/en/users/samil34
Please see below video showing how it works by a famous Dinapoli Trader.