• 概述
  • 评论 (2)
  • 评论 (1)
  • 新特性

Enigmera

5
ENIGMERA:市场核心

简介
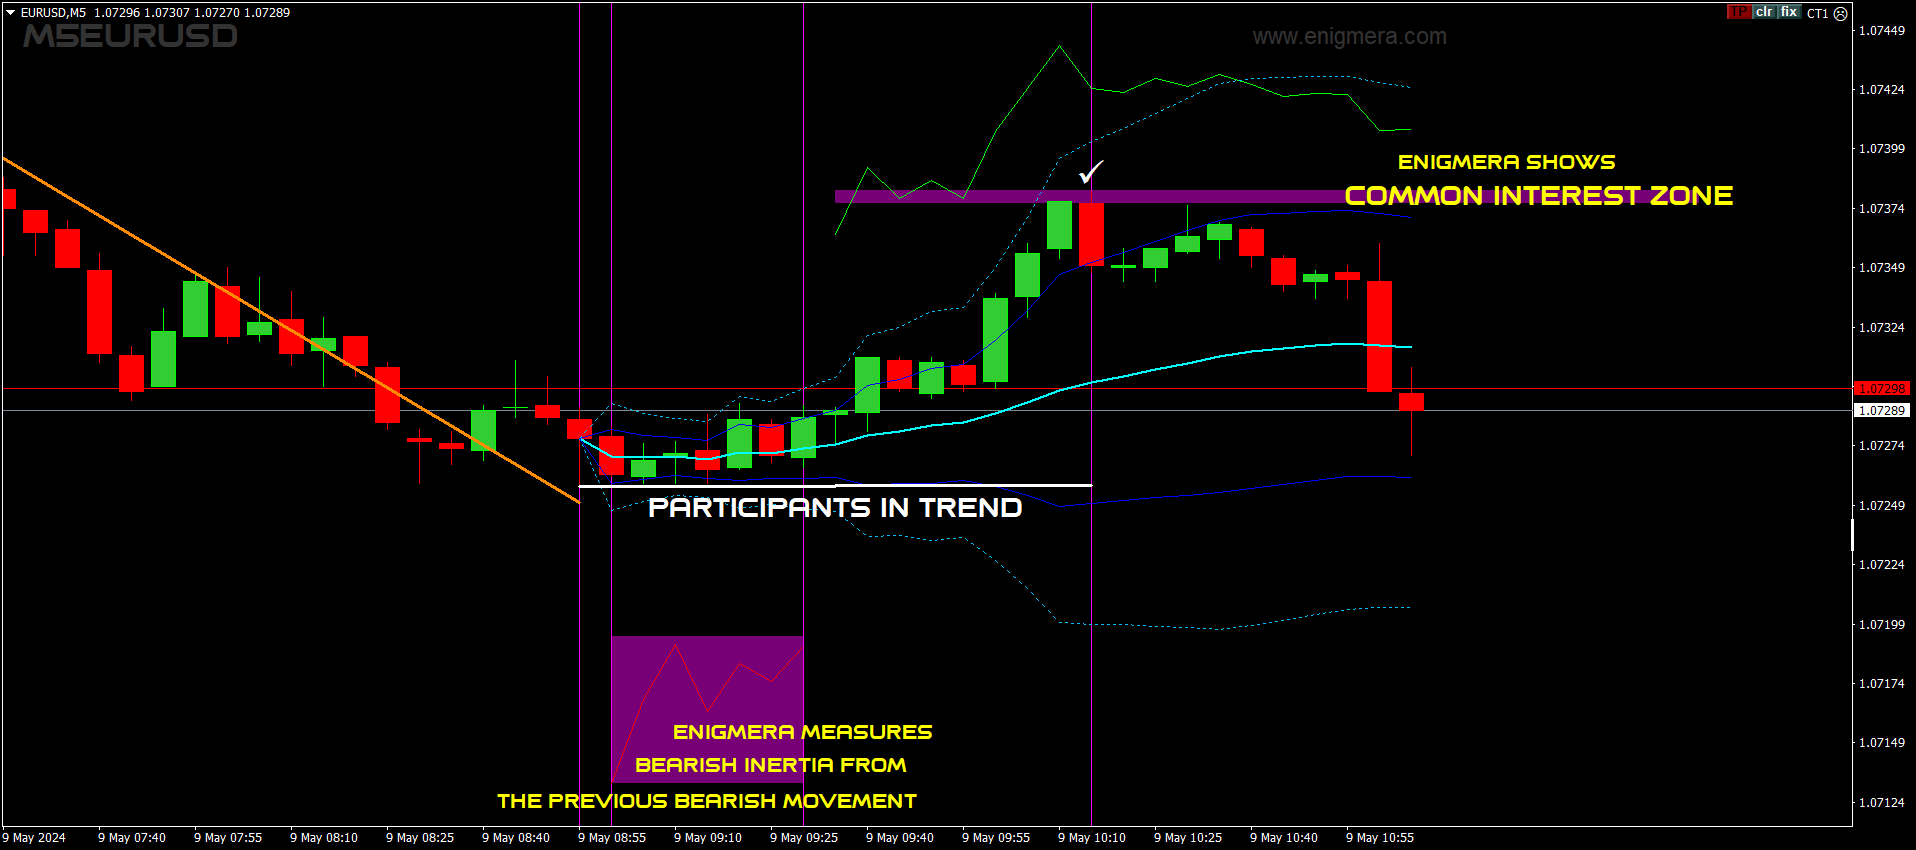
该指标和交易系统是金融市场的一种非凡方法。ENIGMERA 利用分形周期精确计算支撑位和阻力位。它能显示真实的累积阶段,并给出方向和目标。 该系统无论在趋势中还是在修正中都能发挥作用。

它是如何运行的?
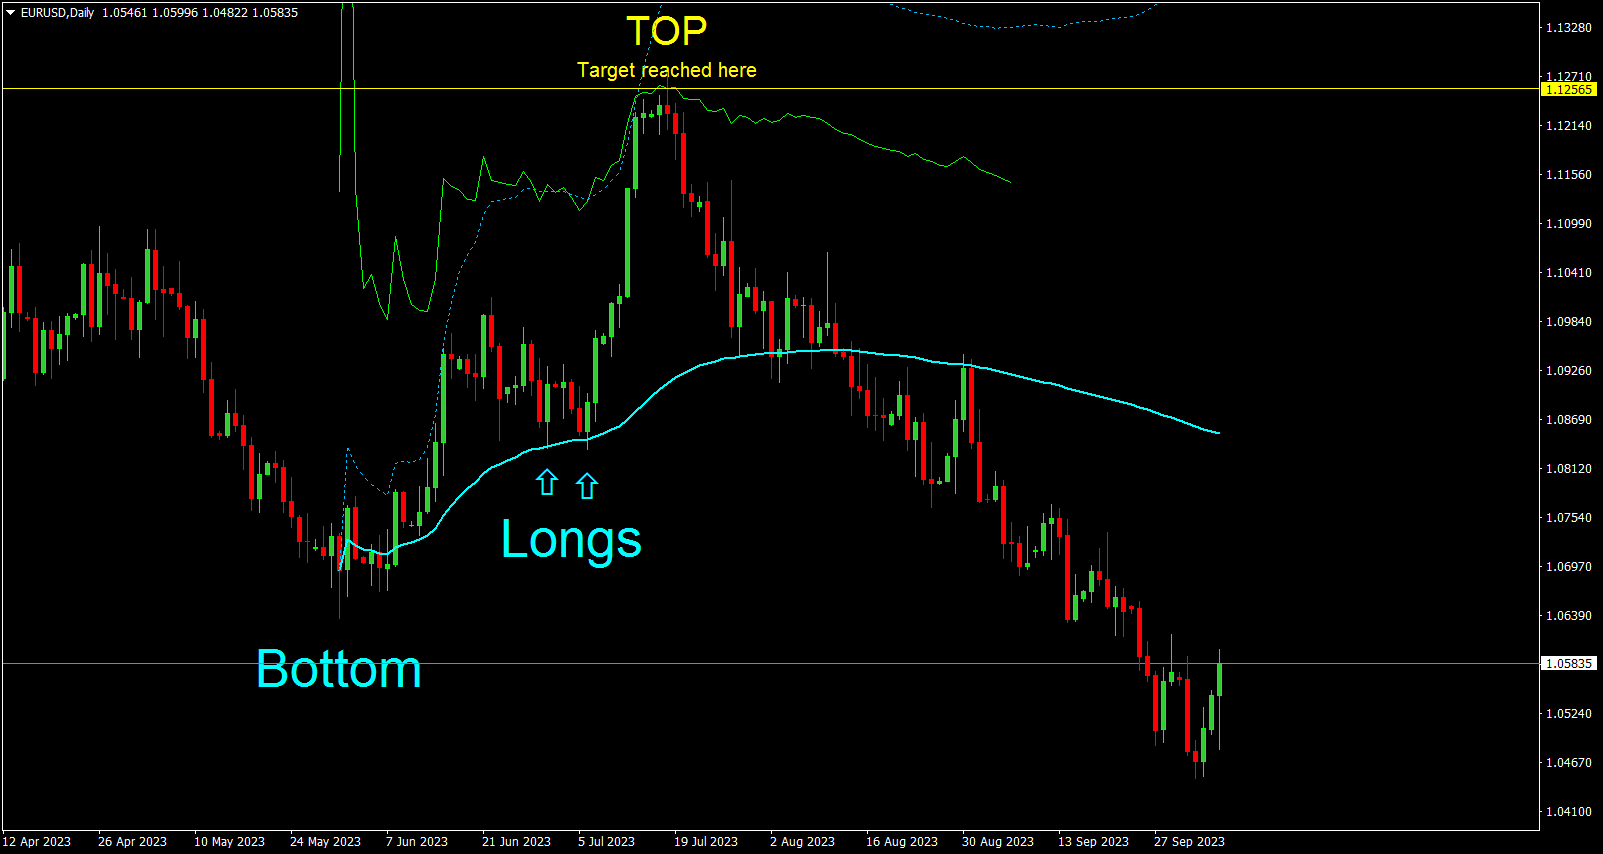
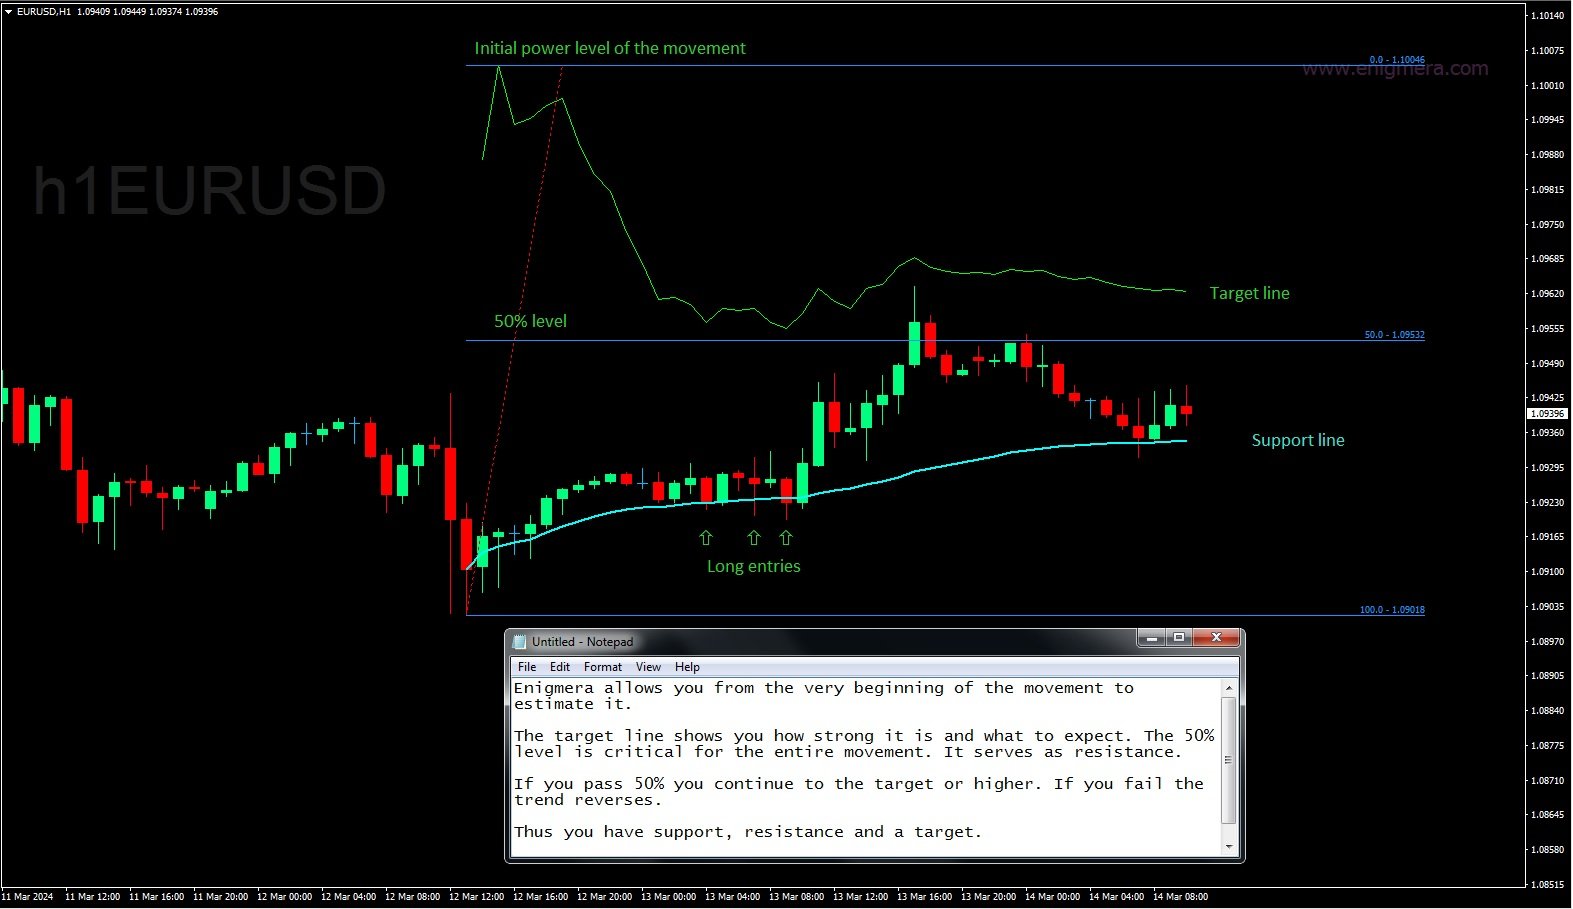
ENIGMERA 由三条线组成:支撑/阻力线、目标线和偏离线。与一般市场指标将过去的数据推断为现在和未来的情况不同,该系统能提供当前的完整情况。如果你处于支撑位,这意味着真正的支撑;如果你处于阻力位,这意味着真正的阻力。如果突破某一水平,则表示趋势发生变化。没有重绘。

由于市场在不断变化,ENIGMERA 不断调整其评估工具,定期修改策略。 
这保证了每种情况都能得到全面评估。这一市场指标的独特性显而易见,其能力不言而喻。 

ENIGMERA 为金融分析师和咨询师提供服务,他们需要可靠的见解与客户分享,也为投资者提供服务,他们需要最精确和最可靠的保证。
该系统能够达到最佳精度,使交易者能够自信、清晰地评估他们的选择。

ENIGMERA 将 20 年的交易专长和知识整合到一个综合软件包中。

直观但取决于用户 

ENIGMERA 的有效性取决于用户的正确配置。不准确的设置会影响分析的精确性。用户必须彻底了解系统的功能,才能最大限度地发挥其性能。

总之,ENIGMERA 不仅提升了财务分析,还能轻松驾驭财务分析的各个层面。精确性、灵活性和实时响应性是最重要的。有了 ENIGMERA,您不仅可以监控市场,还可以全面了解和分析市场。这种理解将导致有效的行动。

您准备好让您的金融决策更上一层楼了吗?


评论 2
ebel
1011
ebel 2023.11.22 14:41 
 

This indicator is undoubtedly expensive but I believe it to be the Ferrari of indicators and the only one you will ever need. The video in the overview is self explanatory, take the time to find the setups as described and the R:R can be extremely good. I have only been using the indicator for a week but have found several very profitable trades and feel confident that I can make back more than sufficient each month to cover my 6 monthly rental. The author is extremely responsive and helpful and is starting a telegram group so that we can share prospective setups. I believe the indicator is difficult to get to work in Strategy Tester but the author is open to free trials which demonstrates his trust in the product. I can't post images here but I will post a trade I made this morning in the comments. I can't promise it is the perfect setup as I am still learning but just this one trade covered my monthly rental cost. IMPORTANT - do not try to change to a lower timeframe while the indicator is loaded. The code is incredibly complex and trying to recalculate everything on a lower tf over a significant period will freeze your MT4 installation. You will need to delete the indicator from your MT4, force a shut down, restart and re-install. Once you understand the complexity it is not a problem, just open another chart on a lower tf or delete the indicator, change the tf and put it back on.

UPDATE 23/11

I have just seen that the author has been debarred from selling! I have just paid for 6 months rental and this is a good indicator that is making me money. What to I do after 6 months if I can't renew? And why has this happened, the author is very courteous and helpful.

推荐产品
This is an arrow indicator without a future function,developed based on the most advanced profit trading algorithms.It has the most innovative and advanced dual trend analysis module, as well as the latest and highly effective market trend prediction algorithm.Trends are your friends, and following larger trends can earn the maximum profit in foreign exchange. This indicator helps traders identify current trends and track them. Someone once made a profit of 10 times in a week by relying on it.No
Infinity Trend Pro
Yaroslav Varankin
1 (1)
This is a trend indicator without redrawing Developed instead of the binary options strategy (by the color of the Martingale candlestick) Also works well in forex trading When to open trades (binary options) A signal will appear in the place with a candle signaling the current candle It is recommended to open a deal for one candle of the current timeframe M1 and M5 When a blue dot appears, open a deal up When a red dot appears, open a trade down. How to open trades on Forex. When a signal is rec
Trend Flasher
Amarnath K M
Trend Flasher Trend is your friend is the age old saying quote in trading arena, there are though many ways to gauge the trend and its direction, more scientific measure and logically meaningful will be an ATR break outs to identify and spot the trend and its acceleration, so we created this easy to use trend identification panel and optimized super trend based multi time frame panel entry system to aid and help the traders to make their trading decision. Unique Features of Trend Flasher 1
PABT Pattern Indicator - it's classical system one of the signal patterns. Indicator logic - the Hi & Lo of the bar is fully within the range of the preceding bar, look to trade them as pullback in trend. In the way if indicator found PABT pattern it's drawing two lines and arrow what showing trend way.  - First line - it's entry point and drawing at: 1. On the high of signal bar or on middle of the signal bar (depending from indicator mode) for buy; 2. On the low of signal bar or on middle of t
Dark Sniper
Dmitriy Kashevich
Dark Sniper arrow indicator. complete lack of redrawing percentage of correct indicator predictions from 80 85% The arrow indicates the direction of the next candle and the possible direction of the trend in the future.  suitable for small m1 timeframes. It is recommended to open deals from 1 to 2 candles. The signal appears on the last candle advantages of the indicator: 1. leading signals. 2.complete lack of redrawing 3. high signal accuracy.
Night ghost
Dmitriy Kashevich
Night Ghost - Arrow indicator for binary options. This is a reliable assistant to you in the future! - No redrawing on the chart -Works great on EUR/USD currency pairs! -Indicator accuracy up to 90% (Especially at night) -No long setup required (Perfectly set up for Binary Options) - Not late signals - The appearance of a signal on the current candle -Perfect for M1 period (No More!) - Eye-friendly candle color (Red and Blue) -Installed Alert Working with it: - Blue arrow
Black series MT4
Dmitriy Kashevich
1 (1)
Black series MT4 - The indicator is designed for trading on binary options with Timeframe M1-M5-M15 Multicurrency (Works on cryptocurrency and currency pairs) The signal appears when the candle opens Up to 90% correct signals There is no signal redrawing at all Can be used with other indicators. Good for scalping! In Settings there is: -Indicator working methods -I Allert Arrow color Red signal down Blue signal up Also watch the video how the indicator works and signals
Elliott Wave Trend MT4
Young Ho Seo
4 (7)
Elliott Wave Trend was designed for the scientific wave counting. This tool focuses to get rid of the vagueness of the classic Elliott Wave Counting using the guideline from the template and pattern approach. In doing so, firstly Elliott Wave Trend offers the template for your wave counting. Secondly, it offers Wave Structural Score to assist to identify accurate wave formation. It offers both impulse wave Structural Score and corrective wave Structure Score. Structural Score is the rating to sh
VR Cub
Vladimir Pastushak
VR Cub 这是获得高质量切入点的指标。该指标的开发是为了促进数学计算并简化对仓位入场点的搜索。多年来,该指标所针对的交易策略已被证明其有效性。交易策略的简单性是其巨大的优势,即使是新手交易者也能成功进行交易。 VR Cub 计算开仓点以及获利和止损目标水平,这显着提高了效率和易用性。查看使用以下策略进行交易的屏幕截图,了解简单的交易规则。 设置、设置文件、演示版本、说明、问题解决,可以从以下位置获取 [博客] 您可以在以下位置阅读或撰写评论 [关联] 版本为 [MetaTrader 5] 计算入场点的规则 开仓 要计算入场点,您需要将 VR Cub 工具从最后一个高点拉伸到最后一个低点。 如果第一个点在时间上早于第二个点,交易者等待柱线收于中线上方。 如果第一个点在时间上晚于第二个点,交易者等待柱线收于中线下方。 根据上述条件,严格在 柱线收盘 后建仓。 换句话说,如果我们在小时图上进行交易,那么从最高点到最低点的时间距离必须超过24小时,最高点和最低点之间的点数必须大于或等于平均价格变动每天。 维持和改变市场地位 可以有多个未平仓头寸;每个头寸都可以单独修改。 VR Cu
Signal From Level
Yaroslav Varankin
Binary Options Support Resistance Indicator This indicator is designed for binary options trading and effectively shows retracements from support and resistance levels. Signals appear on the current candle. A red arrow pointing downwards indicates a potential selling opportunity, while a blue arrow pointing upwards suggests buying opportunities. All that needs adjustment is the color of the signal arrows. It is recommended to use it on the M1-M5 timeframes as signals are frequent on these timef
FreqoMeterForecast
Stanislav Korotky
The main idea of this indicator is rates analysis and prediction by Fourier transform. Indicator decomposes exchange rates into main harmonics and calculates their product in future. You may use the indicator as a standalone product, but for better prediction accuracy there is another related indicator - FreqoMaster - which uses FreqoMeterForecast as a backend engine and combines several instances of FreqoMeterForecast for different frequency bands. Parameters: iPeriod - number of bars in the ma
COG LR Osc AM
Andriy Matviyevs'kyy
The presented indicator allows you to determine potential entry points into the market and set protective orders at reasonable levels. This product can be useful for both beginners and experienced traders. The indicator is based on calculation methods proven by time and practicing traders. The indicator is calculated in two stages: At the first stage, linear regression (LR) of the selected price type is determined for a given number of chart periods. At the second stage, the obtained data is p
Gold Phoenix
Yaroslav Varankin
The perfect tool for Scalng in the Forex markets You can trade both from signal to signal and using take profit  The algorithm does not use Zigzag!  No redrawing!  This is a channel instrument that uses a moving average as a filter. Moving Average  There are 2 parameters for the settings Ma Period = 5 period Moving Average  Channel 1.0 distance of channel lines from the chart Price Signal Filter - calculation of signal opening and filter There is a complete set of Alert There is a multi-timefram
WanaScalper MT4
Isaac Wanasolo
1 (1)
A scalping indicator based on mathematical patterns, which on average gives signals with relatively small SL, and also occasionally helps to catch big moves in the markets (more information in the video) This indicator has three main types of notifications: The first type warns of a possible/upcoming signal on the next bar The second type indicates the presence of a ready signal to enter the market/open a position The third type is for SL and TP levels - you will be notified every time price r
Fourteen plus nine TD Sequential
MOHAMMED IMAD HUSSEIN BASSEE
Fourteen plus nine What is it for? Applying Tom DeMark’s TD Sequential serves the purpose of identifying a price point where an uptrend or a downtrend exhausts itself and reverses. . What are the main components of TD Sequential? TD Sequential has two parts – TD Setup and TD Countdown. The first phase of TD Sequential starts with a TD Setup and is completed with a 9 count. When the 9 count is completed, it is at that point, a price pause, price pullback, or reversal is likely. It is also at tha
Smooth price for Monarch MT4
Konstantin Gruzdev
3.67 (3)
The Smooth Price technical indicator is used for plotting a smoothed line as close to the price of the financial instrument as possible, and serves to eliminate its noise components. The indicator is part of the Monarch trading system, but here it is presented as an independent technical analysis tool. The indicator is based on the cluster digital filter , which, unlike the ClusterSMA , is applied directly to the price time series. Smooth Price does not redraw (except the very last, zero bar) an
Trend lines master
The Trading Team Ltd
5 (1)
Launch promotion For a limited time only:  30$ instead of 157$ Summary Create precise trend lines in a second Description This indicator will draw your trend lines automatically with great precision, saving you some precious time. It uses Bill Williams Fractals to identify the key points and draws both inner and outer trend lines. Features Automatically draws precise trend lines
PZ Trend Trading
PZ TRADING SLU
4.75 (4)
许多盈利交易者不仅知道如何识别市场趋势,而且也能把握趋势建立后的交易机会。 Pz 趋势交易 指标设计用来在趋势行情中尽可能的赚取利润。 已建立的趋势提供了一揽子交易机会,但大多数趋势交易指标完全忽视了它们,让交易者在趋势行情时完全不知道该如何做!一般趋势指标只通知有关的趋势变化,但根本不足以得到卓越的回报. Pz 趋势交易 指标比一般趋势指标显示多达 20 倍的交易 , 因为它注重所谓的市场时机。它不仅显示当前的市场趋势,也有回调,内柱线的突破和调整。它令您在趋势回调之后介入,安全的柱线内突破金字塔加仓,以及发现潜在的反转,和已知的调整。 趋势改变 一个趋势改变在市场方向变化时发生。趋势变化在图表上用带数字的彩色圆圈显示。蓝色 (1) 信号为上涨开始, 而红色 (1) 信号为下跌开始。趋势变化并非评估当前价格动作的结果, 它意味着交易设置是不定时地。如果您正确使用本指标, 在趋势变化时, 您将将已经入场 (参看下面的调整)。 回调 但凡趋势在运动中,行情上下抖动,盈利者收割利润,且其它参与者入场。趋势回调代表好的买入机会,通常是由主力获利离场导致。如果行情在回调后回归上行, 指
Trend Ray
Andriy Sydoruk
The indicator shows the potential trend direction by cyclical-wave dependence. Thus, all the rays of the intersection will be optimal rays, in the direction of which the price is expected to move, taking into account the indicator period. Rays can be used as a direction for potential market movement. But we must not forget that the approach must be comprehensive, the indicator signals require additional information to enter the market.
Gann Angles end Box
Kirill Borovskii
This indicator is, without a doubt, the best variation of the Gann Angles among others. It allows traders using Gann methods to automatically calculate the Gann angles for the traded instrument. The scale is automatically calculated when the indicator is attached to the chart. When switching timeframes, the indicator recalculates the scale for the current timeframe. Additionally, you can enter your own scales for the Gann angles. You can enter your own scales either for both vectors or for each
Advanced Trend Regime
Shellard Securities (Pty) Ltd
The indicator has been designed to function on any time-frame and any pair.   This regime filter will help the trader better evaluate whether the current market is trending, and in which direction. It quickly reacts to changes in market dynamics using a series of advanced calculations. The user is able to select whether the calculation remains standard, or if a further filter constraint is added to the calculation.   A Yellow moving average of the signal has been included for the trader to smoot
Renko, Heiken Ashi, Ticks Bar, Range Bar.    Easy switching, easy setup, all in one window.        Place the Custom Chart indicator and view Renko, Heiken Ashi, Tick bar, Range bar charts in real time at real chart.    Position the offline chart window so that the indicator control panel is visible.    Switch the chart mode by click of a button.    Connect to the output chart any indicator, expert advisor without any restrictions.    No, it doesn't work in the tester.    Yes, you can use an
Trend PA
Mikhail Nazarenko
5 (3)
The Trend PA indicator uses   Price Action   and its own filtering algorithm to determine the trend. This approach helps to accurately determine entry points and the current trend on any timeframe. The indicator uses its own algorithm for analyzing price changes and Price Action. Which gives you the advantage of recognizing, without delay, a new nascent trend with fewer false positives. Trend filtering conditions can be selected in the settings individually for your trading style. The indicator
The indicator detects and displays Shark harmonic pattern (see the screenshot). The pattern is plotted by the extreme values of the ZigZag indicator (included in the resources, no need to install). After detecting the pattern, the indicator notifies of that by a pop-up window, a mobile notification and an email. The indicator highlights the process of the pattern formation and not just the complete pattern. In the former case, it is displayed in the contour triangles. After the pattern is comple
不重繪箭頭的外匯剝頭皮指標。它在 M5、M15、M30、H1 時間框架上效果最佳。默認設置適用於 M5 時間範圍。下圖顯示了使用“period=0.35”參數值處理 H1 圖表的示例。您可以下載演示版並自行測試。現在,我們幾乎在所有剝頭皮策略中都使用該指標的信號。根據我們的計算,其信號的準確性約為 95%,具體取決於時間範圍。該指標適用於所有貨幣對。我們已經在所有主要貨幣對和金屬上進行了測試。在任何地方都獲得了幾乎相同的 +-95% 的準確度。 指標的好處: 不重繪箭頭 適用於所有貨幣對 高信號精度 適合剝頭皮 指標設置: period - 計算信號精度的周期。 Price - 告訴指標使用哪個價格:CLOSE、OPEN、HIGH、LOW。默認情況下,該指標適用於收盤價。
Chart Patterns Detect 15 patterns (Ascending Triangle, Descending Triangle, Rising Wedge, Falling Wedge, Bullish Flag, Bearish Flag, Bullish Rectangle, Bearish Rectangle Symmetrical triangle, Head and Shoulders, Inverted Head and Shoulders, Triple top, Triple Bottom, Double Top, Double Bottom) Use historical data to calculate the probability of each pattern to succeed (possibility to filter notification according to the chance of success) gives graphic indication about the invalidation level and
POWR Rise Coming
Trade Indicators LLC
This indicator is SO SIMPLE… when the green Rise Coming arrow appears, a price drop may be on the way! Plain and easy profits! As you receive more than one 'Rise Coming' text signal in a downtrend, it means momentum is building larger for a bull run. HOW TO USE 1. When the green "Rise Coming" text appears, a price jump may be on the way! This indicator Never Repaints! To get the best setting it's a matter of tweaking the indicator until it gives you the best results. Our recommendation, and what
How to use Pair Trading Station Pair Trading Station is recommended for H1 time frame and you can use it for any currency pairs. To generate buy and sell signal, follow few steps below to apply Pair Trading Station to your MetaTrader terminal. When you load Pair Trading Station on your chart, Pair Trading station will assess available historical data in your MetaTrader platforms for each currency pair. On your chart, the amount of historical data available will be displayed for each currency pai
Gartley Projection D
Oleksandr Medviediev
3.71 (7)
具有经过验证的概念和盈利能力的最佳、最有效、可靠的产品。感谢您的考虑。  该指标根据H.M.Gartley的发展(《股票市场利润》,1935年)识别和确认谐波模式(XABCD)。 它将D点投影为透视投影中的一个点(在设置中指定ProjectionD_Mode = true)。 不会重绘。当工作时间段的柱形图关闭时,如果已识别的模式点在Patterns_Fractal_Bars柱中未移动,则在图表上出现一个箭头(指向预期价格运动的方向)。从此刻起,箭头将永久保留在图表上。 注意:连续出现2-3个或更多箭头 - 这是市场条件的变化,而不是重绘。 总共有85种模式(包括Gartley-222和Gartley-222WS,完整列表可在评论部分的Google Drive链接中找到)。在所有已识别的模式中,只有最新识别的模式填充了单一颜色。 参数 DrawPatterns(true/false)- 以实心颜色绘制模式 ProjectionD_Mode(true/false)- 定义D点作为透视投影模式 Patterns_Fractal_Bars - 在认定为形
该产品的买家也购买
ON Trade Optuma Astro
Abdullah Alrai
5 (4)
当然可以!以下是您提供的文本的中文翻译: 引入 MT4 天文指标:您的终极天体交易伙伴 您准备好将交易体验提升到天文高度了吗?不用再寻找,就在我们的革命性 MT4 天文指标中。这个创新工具超越了传统的交易指标,利用复杂的算法提供无与伦比的天文洞察力和精确计算。 指尖上的宇宙信息: 瞻仰一个详尽的面板,展示了一宝藏般的天文数据。了解行星的地理/太阳心坐标,太阳/地球距离,亮度,伸长度,星座,黄道和赤道坐标,甚至是水平坐标——每个细节都经过精心计算并呈现得美轮美奂。指标生成的垂直线对应于时间值,为您的交易旅程提供了宇宙的视角。 行星线条与关系: 在您的图表上欣赏行星线条的魔力,具有可自定义的比例和角度。通过直观的控制面板轻松切换每个行星线条的可见性。通过连结、六分、四分、三分、对冲和逆行等指标,发现行星关系的艺术。在您选择的时间范围内探索这些宇宙构造,使您能够识别重要的交易机会。 揭示甘恩的智慧: 通过受甘恩启发的平方垂直线揭示潜在的反转时机。这种创新修改将甘恩历经考验的原则带入现实,帮助您提前了解市场的转向和趋势。 月亮引导: 在您的图表上优雅地导航月相,因为新月和满月点缀其间。月亮周期
The indicator of a Professional Trader is an arrow indicator for predicting the direction of price movement. I have been working on this indicator since 2014. You can use this indicator as your main indicator, use its entry signals, and use it as your only indicator to find entry points. About the product: Recommended TF [H4-D1-W1]   . The indicator predicts the direction of the next candle. Fits a variety of tools; Flexibility in settings for different instruments and intervals through the
WARNING!! THIS SWORD IS TOO SHARP!    ONLY 10 COPIES LEFT FOR THE NEXT PRICE TO BE 8,000$ FOR UNLIMITED PLAN. Dear traders I am very glad once again to introduce to you my other tool called "Forex Sword Indicator". In short this tool is meant to give you an edge over the market that you have been waiting for  so long. Now, here it is. It is a very very simple tool but yet a dangerous sword. I call it a  Holy grail indicator!. I will not talk a lot about this tool. Just let the tool speak by itse
Full STO
Roman Smoroda
完整的 STO 指标(包括三个 STO 指标的所有版本:高级版、黄金版、白银版) - STABLE TRADE OPTION 专为自动二元期权交易而设计。 请仔细阅读!!!!! 重要事项 在一个终端中创建两个不同到期时间的模板,一个为 18:01、18:02,到期时间为 1 至 15 分钟的模板,另一个为 22:00,到期时间为 10 至 20 分钟的模板。 胜率:过去 5 年为 71 资金管理:存款的 0.3 此版本的指标仅用于莫斯科时间 18:01、18:02、22:00 的交易,白银和黄金的到期时间为 1 至 15 分钟,高级版本的到期时间为 10 至 20 分钟。信号出现在蜡烛内部并立即打开交易,如果您使用连接器,则在蜡烛内部打开一个标记。 该指标配置齐全,您无需自行更改。安装并交易 请勿在未经任何检查和测试的情况下购买该指标,我花了两年多时间在真实账户上检查所有版本的sto并查看结果。经过多年测试,我们选择了最佳参数。 应用算法 1. 将指标安装到信号顾问中,信号顾问会自动向经纪商平台发送信号。 - mt2trading.
Connect Indicator
Sukunthakan Ngernbamrung
Connect Indicator is a tool used for connecting indicators between the MQL market and MT4. The connected indicators are made by our group and can be used for other applications, such as sending messages to the Line application or Telegram application. If you have any questions, please don't hesitate to ask us to receive support. Function and indicator buffer Buffer one is the high price of the previous candle. Buffer two is the high price of the previous candle. Usage To connect indicators to fu
引入神奇外汇指标:释放精准交易的力量 你是否厌倦了寻找在所有时间框架上都能取得出色结果的完美外汇指标?别再继续寻找了!神奇外汇指标已经来到,改变您的交易体验,将您的利润推向新的高度。 神奇外汇指标基于尖端技术和多年的精心开发,堪称外汇市场上的强大和精确的巅峰之作。这个卓越的工具旨在满足各个层次的交易者需求,在追求持续盈利性方面提供无与伦比的优势。 神奇外汇指标的独特之处在于其无与伦比的适应性。无论您是日内交易者、波段交易者还是更喜欢长期持仓,该指标都经过优化,能在所有时间框架上取得出色的结果。然而,当在1小时时间框架上使用时,它的准确性和捕捉市场复杂走势的能力得到真正展示。 准备好对神奇外汇指标的准确性和可靠性感到惊讶。其先进的算法无缝结合了强大的指标、统计分析和趋势识别,实时为您提供全面的市场视图。指标的智能和动态信号使您能够自信地做出明智的交易决策,最大限度地提高获胜交易的机会。 不再犹豫和迷茫。神奇外汇指标消除了交易的猜测,使您在市场参与者中具有独特的优势。其用户友好的界面和直观的设计使得无论是经验丰富的专业人士还是初学者都能轻松掌握这一卓越工具的力量。 有了神奇外汇指标的支持,
IA Trendx3 PRO
Marco Aurelio Santos Costa
What if God Created a Trade System? No miracles... Just see how mathematics can be effective in the market. We managed to combine technical analysis / price action into indicators, creating the best setup for trading, be it in Forex, Indices, or stocks. It took us 2 years to create something that really works, and now it's time for you to discover it. TrendX3 is a revolution in trend analysis. Based on advanced algorithms and real-time data, it provides valuable insights so that you can make inf
WARNING: PRICE IS SUBJECT TO RISE AT ANY TIME. GET YOUR COPY TODAY TO AVOID MORE COST! Dear Traders I am so glad to introduce to you my other tool called the Forex Sniper Entries Indicator. This tool is designed to help serious traders and investors capture big moves in the currency price movements. The philosophy behind this tool is all about winning big and riding the price movement from its beginning until the maximum point. We want to capture those big moves in both down and up markets as mu
Weis Wave with Alert
Trade The Volume Waves Single Member P.C.
4.8 (20)
Rental/Lifetime Package Options and Privileges' * For optimum results the yearly or lifetime package is suggested due to live training and Discord  channel trading with the  creator! Rent Monthly Six Months   Yearly/Lifetime Weis Wave with Speed with Alert+Speed Index x x x Manual  x x x Quick Set up Video x x x Blog x x x Lifetime Updates x x x Setup and Training Material x x Free Rectangle Break Alert Tool      x Discord Access Channel "The SI traders" x 2-hour live methodology traini
MT My Way
Issara Seeboonrueang
Best strategy,  Easy trade ,  Support of version update in the future MT My Way: Why are there fewer successful traders than failed traders????? The idea of ​​this indicator is that at the point of opening an order, if you ask other traders, they will trade on the opposite side.  So you trade opposite other trader and (Hidden message: It is making profit along with the broker.)   (^_^)   (^-^)   (^ ^)   (^.^) "Trade opposite to others, You will win"  If this idea is true, You may not wan
StalkeR Arrow
Abdulkarim Karazon
5 (4)
StalkeR Arrow 是一个箭头指标,可在柱形开盘/柱内发出买入和卖出信号,该指标基于价格行为模式和分形 该指标为每个买入和卖出信号提供 tp 和 sl ,tp 和 sl 以线的形式出现在每个信号的上方和下方,它们会延伸直至形成新的信号。 该指标具有回溯测试面板/仪表板,可提供历史信号的赢/输统计数据,该指标不会重新绘制或背面绘制。 参数 : StalkeR 周期:箭头周期,数字越大,信号越少 spread : 将使用以点为单位的点差值来计算面板上的盈利和亏损 止损 ATR x : atr 乘法中的止损值 止盈 ATR x : atr 乘法中的 TP 值 ATR period : 用于计算 tp 和 sl 的 atr 周期 TP/SL 线颜色和宽度 箭头颜色和宽度 面板/仪表板位置。 警报/电子邮件/通知
Gann Swing Structure
Kirill Borovskii
5 (1)
This indicator is based on the mathematics of the great trader W.D. Ganna. With its help, you can easily find strong levels by analyzing swings to find the optimal entry point. The indicator works on all instruments and all timeframes. The indicator is fully manual and has control buttons. All you need to do is press the NEW button, a segment will appear, which you can place on any movement, swing or even 1 candle that you want to analyze. By placing the segment, press the OK button. A grid (th
Gann Zone Pro
Kirill Borovskii
This indicator identifies and displays zones, as it were areas of strength, where the price will unfold. The indicator can work on any chart, any instrument, at any timeframe. The indicator has two modes. The indicator is equipped with a control panel with buttons for convenience and split into two modes. Manual mode: To work with manual mode, you need to press the NEW button, a segment will appear. This segment is stretched over the movement and the LVL button is pressed. The level is displayed
Ferox Breakout
Tat Dat Nguyen
The breakout algorithm is a technique based on price, price features, to shape a breakout strategy. The strategy in this indicator will not be redrawn (none-repaint indicator), it is suitable for short or long term traders In the screenshot is the EURUSD pair, these currency pairs, commodities or stocks, it have similar strength *Non-Repainting (not redrawn) *For Metatrader4 Only *Great For Scalping *Great For Swing Trading *Arrow Entry, Green is Long, Red is Short *Works On Any Timeframe *Work
Weddell Pro
Dmitriy Kashevich
Weddell Pro is a good trading tool that is suitable for both a beginner and an experienced trader. It can be used both separately and combined with other strategies and indicators Configured for currency pairs was tested several times on cryptocurrency but did not show a high result Currency pairs USD/EUR AUD/CAD GBP/USD Showed itself very well here The percentage of correct transactions is above 68%, which does not make it perfect and bad Doesn't draw or disappear The red arrow sho
"Dragon's Tail"是一种综合交易系统,而不仅仅是一个指标。这个系统以分钟为单位分析每一个蜡烛,这在市场波动性高的情况下特别有效。 "Dragon's Tail"系统确定市场的关键时刻,称为"公牛和熊的战斗"。基于这些"战斗",系统给出交易方向的建议。在图表上出现箭头的情况下,这表明有可能在指示的方向上开设两个交易。黄线和绿线分别作为第一和第二个交易的获利水平。在达到黄线水平并关闭第一笔交易后,建议在第二笔交易开启的水平上设定止损。 时间框架和工具的选择取决于交易员的偏好,但为了达到最佳结果,建议使用H4和D1的时间框架,并考虑所选工具的差价大小。 "Dragon's Tail"的设置参数可以分为两组: 直接影响交易结果的参数: 历史深度 - 只影响图表上入口点的显示。推荐值:D1 - 10,H4 - 15,H1 - 20。 获利1和获利2 - 影响最终结果。取决于时间框架的推荐值:D1 - 250/450,H4 - 150/250,H1 - 75/150。 负责系统视觉设计的参数。可以根据交易员的意愿进行设置。 重要的是要记住,"Dragon's Tail"是一个需要交易员
SMCpro VIP MT4  Original Price  $620   ---  Currently Price 20% OFF ( for unlimited use )   BONUS  AUX VIP Club 2024 : Include  EA Airbag  and  Load Data History  to enhance the performance of this tool to its maximum potential  Click Here to Download Files   ( for users only )   Hello World! Introducing.. SMCpro VIP tool and Indicator for MetaTrader 4, designed to revolutionize your trading experience with the ICT Smart Money Concept. This system is meticulously crafted to empower trad
Intro to APAMI, PROfessional edition Trace exactly how far prices trend between two price levels with fractional pip precision, while qualifying price movement between the same price levels. Completely automate when trends change direction and volatility, without any lag .  This is possible because the Accurate Price Action Measurement Indicator (APAMI) actually does what no other indicator can:  measure price distance between two points and simultaneously qualify the price action that occurs
Market Breaker Updated version 3
Allistair Kabelo Mandow
1 (1)
Features for software Main functions: Accurate entry signals WITH NON REPAINTING! Once a signal appears, it remains valid! This is a significant distinction from other indicators that might provide a signal and then alter it, potentially leading to deposit losses. Now, you can enter the market with higher probability and precision. There's also a function to colour candles after an arrow appears until the target (take profit) is reached or a reversal signal appears . Display of STOP LOSS / TA
Idea: RSI ( Relative Strength Index) and CCI ( Commodity Channel Index ) are powerfull to solved the market.  This indicator has Smoothed Algorithmic signal of RSI and CCI. So that, it separates the market into buy and sell zones, these areas are marked with arrows, red for downtrend, green for uptrend. This algorithm has the effect of predicting the next trend based on the historical trend, so users need to be cautious when the trend has gone many candles. Please visit screenshots
Introducing the "Magic Trades" for MetaTrader 4 – your ultimate tool for precision trading in dynamic markets. This innovative indicator revolutionizes the way you perceive market trends by harnessing the power of advanced analysis to detect subtle changes in character, paving the way for optimal trading opportunities. The Magic Trades Indicator is designed to empower traders with insightful entry points and well-defined risk management levels. Through its sophisticated algorithm, this indica
VTrende Pro mt4
Andrii Diachenko
3 (2)
VTrende Pro MT4 - MTF indicator for trend trading with a display panel for MT5 *** Videos can be translated into any language using subtitles (video language - Russian) Although the signals of the VTrende Pro indicator can be used as signals of a full-fledged trading system, it is recommended to use them in conjunction with the Bill Williams TS. VTrende Pro  MT4 is an extended version of the VTrende indicator. Difference between Pro version and VTrende: - Time zones - Signal V - signal 1-
Automatic, live & interactive picture of all trendlines. Assign push, email and sound alerts to the lines of your choice and be informed about price rollback, breakout, rollback after breakout, number of rollbacks, line expiration by double breakout. Correct, drag or delete the lines and interactively tune the line system. https://youtu.be/EJUo9pYiHFA . Chart examples https: //www.mql5.com/en/users/efficientforex Price Interaction Events All events are effective immediately and only after on
The indicator displays the probable ( Support and resistance ) levels. The indicator draws horizontal and trend levels of support and resistance. The indicator settings: Trends - the mode for displaying trend lines or horizontal lines of support and resistance Yes - display trend lines only No - display horizontal lines only UseResource - use the resources built into the indicator. Yes - use the ZigZag indicator from the resources of the product. No - use a custom ZigZag indicator. HistoryBar -
THE GRAFF III
Antonin Skaryd
The [GRAFF] III manual trading system is based on multiple MetaTrader (MT4) indicators. Together, the entire PACK of GRAFF III indicators makes an advanced trading tool. The system consists of over 20 different custom-built indicators which have been carefully selected and tested in the long term to produce strong and efficient trading signals. The particular indicators are based on different mathematical formulas, so the entire system is calibrated to remove false signals from its own indicator
This indicator allows you to see the strength of the trend on all timeframes. It can be used for all currency pairs. The indicator can be displayed in the form of a column (from left to right): status buy / sell / strong buy / strong sell, strength of the trend in percentage, pips last candle, body candle now, remaining time, and the timeframe of M1 to MN. Information contained below (from left to right): total trend percent, sell percent, buy percent.
You can fins our other products from link : https://www.mql5.com/en/users/drbastem/seller   Also, you can ask all your questins from email : haskayafx@gmail.com or mobile : +90 530 867 5076 or @MehmetBastem    on telegram application This indicator is used to determine the trend. Standard Osma indicator is used. It has the indicator warning system: beep, e-mail and has three types of alerts, including messages to mobile phone. It shows the best performance on the chart of 5 minutes. When the
You can fins our other products from link : https://www.mql5.com/en/users/drbastem/seller   Also, you can ask all your questins from email : haskayafx@gmail.com or mobile : +90 530 867 5076 or @MehmetBastem    on telegram application This indicator is used to determine the trend. Standard Three Moving Average and ADX indicators are used. It has the indicator warning system (audio, e-mail) and three types of alerts, including messages to mobile phone. It shows the best performance on M5. When
This indicator is used to determine the trend. Standard Three Moving Average and ADX indicators are used. It has the indicator warning system (audio, e-mail) and three types of alerts, including messages to mobile phone. It shows the best performance on M5. When the trend value reaches the value set, the warning system is activated. This indicator works only with Forex symbols. Inputs SoundAlarm = true - Sound Alert Sendmail=true - Send an e-mail in case of a buy or sell signal Sendnotificatio
作者的更多信息
Two Snakes
Ivan Stefanov
5 (1)
Trend Angle 45
Ivan Stefanov
在交易领域,45 度角的趋势被认为是可持续的。 然而,由于没有明确的方法说明,准确测量这个关键角度仍然是一个挑战。交易者只能猜测它是如何计算的,应该有多少根蜡烛,以及适当的图表缩放比例是多少。 我们已经解决了这个问题,并从逻辑上定义了所有条件,现在向您介绍趋势角 45。这是一款基于对支撑、目标和整体走势等各种市场因素的复杂分析,将 45 度趋势线可视化的工具。 尽管 45 度趋势线通常被视为交易神话和民间传说,但 Trend Angle 45 现在已成为我们交易武器库中的一个宝贵工具,而且非常有效。它能够反映趋势的细微差别,并预测趋势开始和结束时的变化。 使其成为理想的评估工具。 时间真的很神奇! 您将面对不同市场趋势的深刻而准确的分析。 在市场周期中,价格会在 45 度线上方或下方移动,表明周期的不同阶段。 在趋势开始时,价格会在该线下方移动。在趋势过程中,价格可能沿着该线移动,在趋势结束时,甚至可能出现高于该线的极端值。除了最初的趋势阶段,其他阶段的顺序可能会有所不同。 这是一种评估外汇、股票和指数趋势的有用工具,尤其是对长期趋势而言,评估运动强度可能具有挑战
该指标每天都会绘制水平线。 如果进入昨天的绿色区域--买入,如果进入昨天的红色区域--卖出。 止损 20 点。 目标 20 点或更多。 下单后等待即可。 交易货币对 欧元兑美元 英镑兑美元 无需特殊技能。算法会自行计算一切。 成功率极高。简单而有效! 该指标每天都会绘制水平线。 如果进入昨天的绿色区域--买入,如果进入昨天的红色区域--卖出。 止损 20 点。 目标 20 点或更多。 下单后等待即可。 交易货币对 欧元兑美元 英镑兑美元 无需特殊技能。算法会自行计算一切。 成功率极高。简单而有效! 该指标每天都会绘制水平线。 如果进入昨天的绿色区域--买入,如果进入昨天的红色区域--卖出。 止损 20 点。 目标 20 点或更多。 下单后等待即可。 交易货币对 欧元兑美元 英镑兑美元 无需特殊技能。算法会自行计算一切。 成功率极高。简单而有效!
该指标基于实际经验。 输入顶部/底部的日期/时间。 它会计算从顶部/底部到当前时刻访问次数最多的级别。 每根新蜡烛都会自动更新。 您可以针对不同的趋势和时间框架同时使用多个指标。 长度总是从您的时间段开始绘制到现在。 实用的专业工具。 该指标基于实际经验。 输入顶部/底部的日期/时间。 它会计算从顶部/底部到当前时刻访问次数最多的级别。 每根新蜡烛都会自动更新。 您可以针对不同的趋势和时间框架同时使用多个指标。 长度总是从您的时间段开始绘制到现在。 实用的专业工具。 该指标基于实际经验。 输入顶部/底部的日期/时间。 它会计算从顶部/底部到当前时刻访问次数最多的级别。 每根新蜡烛都会自动更新。 您可以针对不同的趋势和时间框架同时使用多个指标。 长度总是从您的时间段开始绘制到现在。 实用的专业工具。
交易速度(TRANSACTION SPEED)是最高质量的指标,可显示市场上何时何地积累了大量订单,以及由此带来的好处。它能在早期阶段检测到趋势变化。它既是一个指标,同时也是一个交易系统。概念独特,利润惊人。 在外汇交易中,"tick volume"(交易量)被误称为 "成交量"。实际上,它是单位时间内的价格变化,事实上就是交易速度。 该指标彻底改变了外汇交易中成交量的概念,以正确的逻辑方式定义了成交量,并将这一逻辑应用成为独特而精确的顶级盈利工具。 当速度增加时,就意味着更大的利益以及相应的进入和退出。 如何使用 由于该指标测量并比较市场交易的速度,因此首先要做的是  选择进行比较的时间段。 通常,15 天前是一个很好的比较起点。 在指标中输入日期并运行。 在 30 分钟或 1 小时的时间框架内,最能看出速度周期。 不过,您也可以使用其他更详细或更不详细的时间框架。 周期本身可以在下降趋势或上升趋势中移动。 当交易速度从下降趋势转为上升趋势时  我们就处于价格反转点,可以在此建仓,避免任何风险。这就是大资金进入市场的地方。 这是一款非常严肃的工具,专为最
Times
Ivan Stefanov
在外汇交易中,衡量时间的指标是一个很大的异类。人们普遍认为时间是不可分析的。 该指标的逻辑如下: 我们从物理学中知道,距离等于随时间变化的速度。S=V*t 如果我们考虑时间,它将等于速度除以距离。 t=S/V 外汇交易中的速度就是交易量,因为它不是交易量,而是一定时间内的交易次数,即交易速度。 (我已经做了这样一个指标,并给出了正确的解释,你可以看看)。 我们可以将距离定义为从 A 点到当前点的价格差。因此,我们在指标中设置了一个初始周期。 这就是我们的异域时间指标。 我将其解释权留给您。 如果您有任何意见,我将非常高兴。 在外汇交易中,衡量时间的指标是一个很大的异类。人们普遍认为时间是不可分析的。 该指标的逻辑如下: 我们从物理学中知道,距离等于随时间变化的速度。S=V*t 如果我们考虑时间,它将等于速度除以距离。 t=S/V 外汇交易中的速度就是交易量,因为它不是交易量,而是一定时间内的交易次数,即交易速度。 (我已经做了这样一个指标,并给出了正确的解释,你可以看看)。 我们可以将距离定义为从 A 点到当前点的价格差。因此,我们在指标中
Panama Channel
Ivan Stefanov
The indicator has 3 lines: green, blue and red.  Between the blue and green line - bullish channel. Between the blue and the red line - a bearish channel. In addition, there is a signal line that moves inside the channel. This line changes colour from green to red and vice versa, thus indicating what the sentiment of the market is. The strategy is easy to follow.  When you are in the bullish channel and get a green signal line it is a signal of buying.  When you are in a bearish channel
Levelss
Ivan Stefanov
LEVELSS 指标显示 - 每日看涨和看跌区域。每天从 00:00 至 23:59 都可以看到。 - 周线看涨和看跌区域。每周从周一 0:00 至周五 23:59。 - 从特定时间框架特别计算的通道,显示在所有其他时间框架上。默认情况下,这是 4 小时时间框架,您可以将其更改为您希望交易的任何其他时间框架。它是不间断计算的。 屏幕左上方显示区域和通道是看涨、看跌还是中性。当三个区域都看涨时,当前蜡烛上会出现一个绿点。当三个区域都看跌时,则出现粉红色。 该指标没有任何限制。 LEVELSS 指标显示 - 每日看涨和看跌区域。每天从 00:00 至 23:59 都可以看到。 - 周线看涨和看跌区域。每周从周一 0:00 至周五 23:59。 - 从特定时间框架特别计算的通道,显示在所有其他时间框架上。默认情况下,这是 4 小时时间框架,您可以将其更改为您希望交易的任何其他时间框架。它是不间断计算的。 屏幕左上方显示区域和通道是看涨、看跌还是中性。当三个区域都看涨时,当前蜡烛上会出现一个绿点。当三个区域都看跌时,则出现粉红色。 该指标没有任何限制。
筛选:
eman11
904
eman11 2023.11.22 20:29 
 

用户没有留下任何评级信息

ebel
1011
ebel 2023.11.22 14:41 
 

This indicator is undoubtedly expensive but I believe it to be the Ferrari of indicators and the only one you will ever need. The video in the overview is self explanatory, take the time to find the setups as described and the R:R can be extremely good. I have only been using the indicator for a week but have found several very profitable trades and feel confident that I can make back more than sufficient each month to cover my 6 monthly rental. The author is extremely responsive and helpful and is starting a telegram group so that we can share prospective setups. I believe the indicator is difficult to get to work in Strategy Tester but the author is open to free trials which demonstrates his trust in the product. I can't post images here but I will post a trade I made this morning in the comments. I can't promise it is the perfect setup as I am still learning but just this one trade covered my monthly rental cost. IMPORTANT - do not try to change to a lower timeframe while the indicator is loaded. The code is incredibly complex and trying to recalculate everything on a lower tf over a significant period will freeze your MT4 installation. You will need to delete the indicator from your MT4, force a shut down, restart and re-install. Once you understand the complexity it is not a problem, just open another chart on a lower tf or delete the indicator, change the tf and put it back on.

UPDATE 23/11

I have just seen that the author has been debarred from selling! I have just paid for 6 months rental and this is a good indicator that is making me money. What to I do after 6 months if I can't renew? And why has this happened, the author is very courteous and helpful.

回复评论
版本 1.3 2024.01.05
在新版本中
增加了趋势评估工具:

- 角度 45 度线
- 45 度偏差线