Smart Support and Resistance Trading System
- 指标
- Issam Kassas
- 版本: 1.10
- 更新: 9 十一月 2023
- 激活: 20
首先值得强调的是,这个交易系统是一个不重绘、不重画和不滞后的指标,这使它非常适合专业交易。
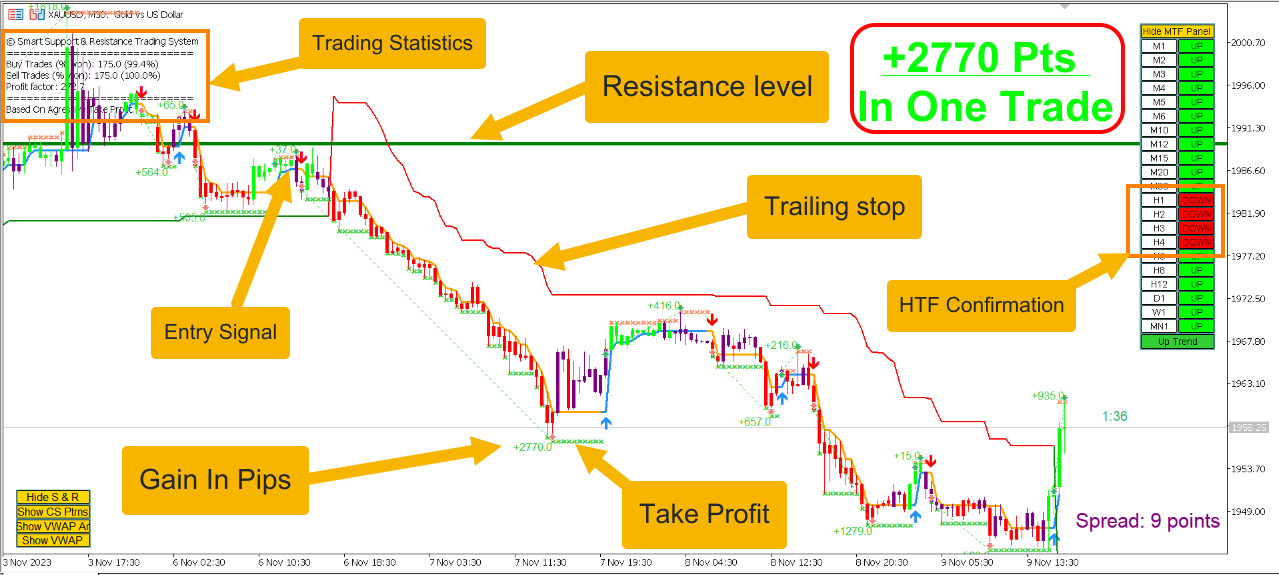
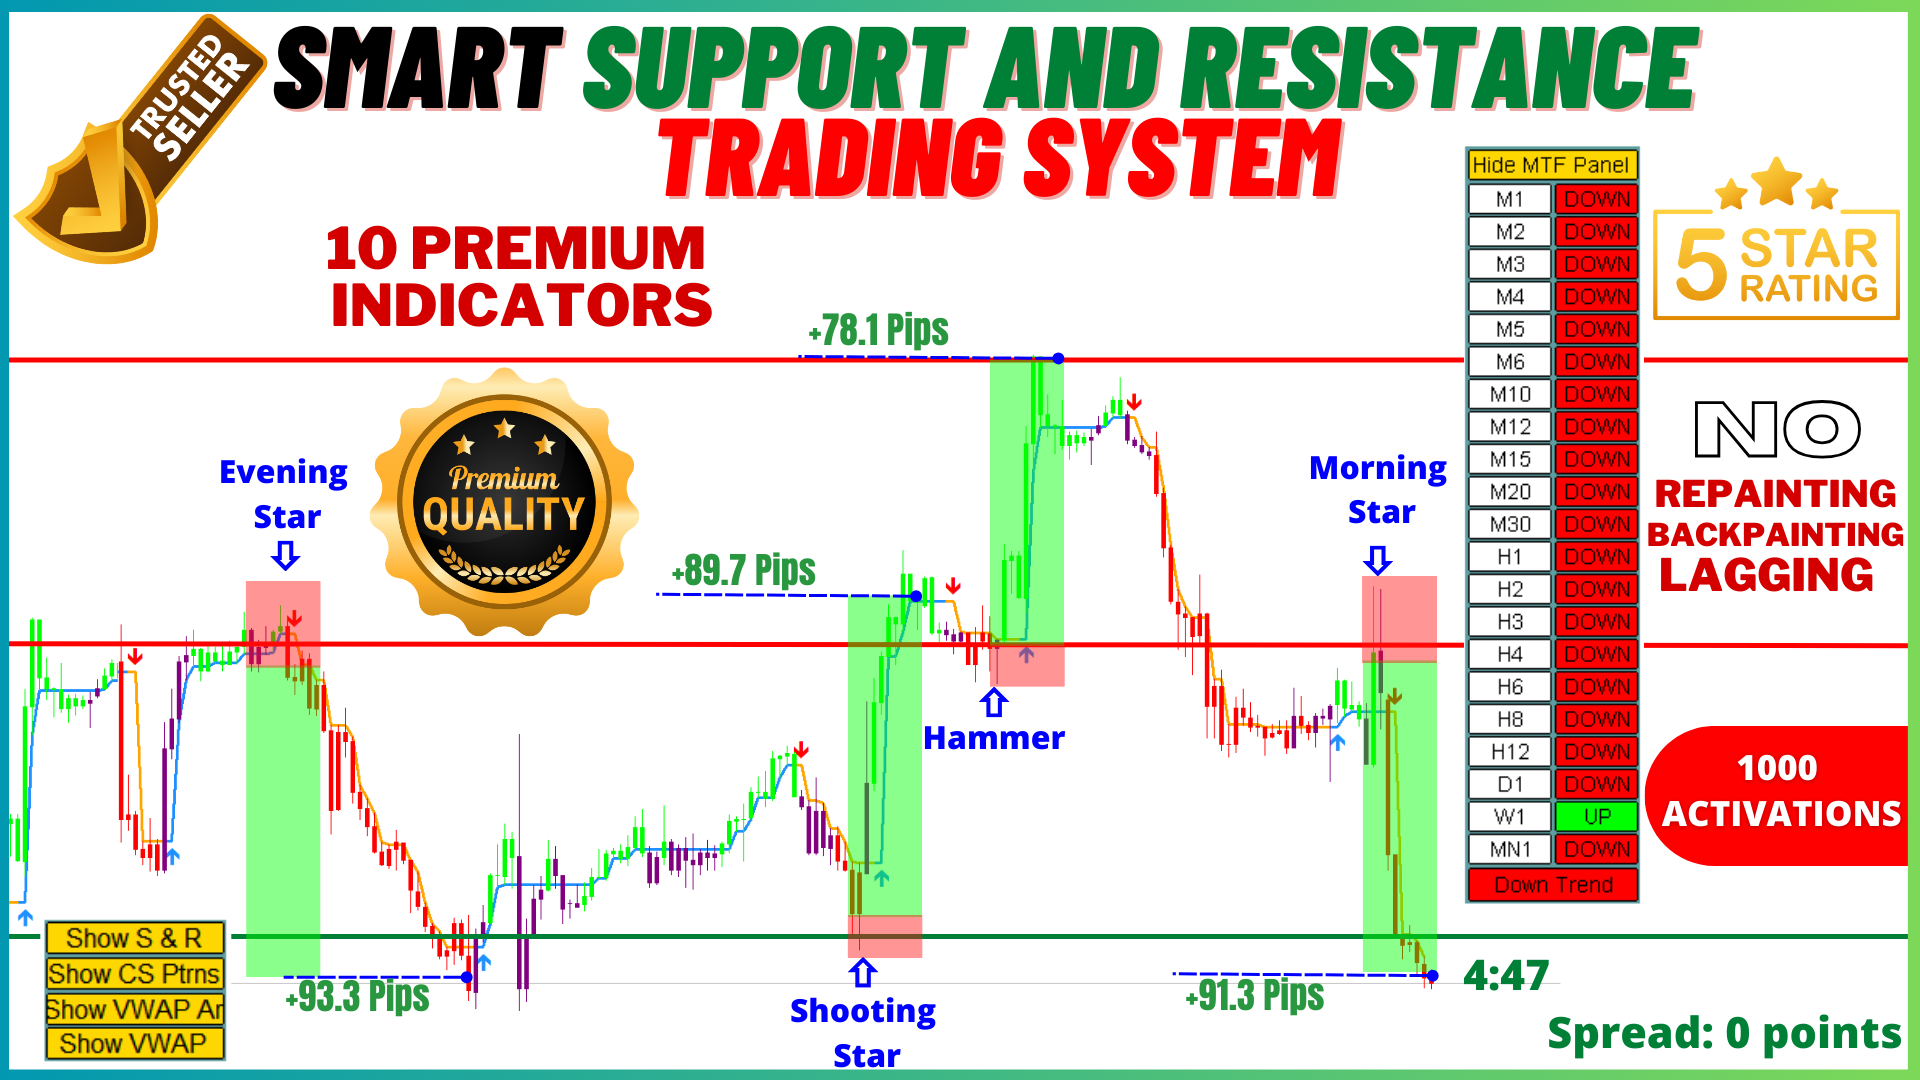
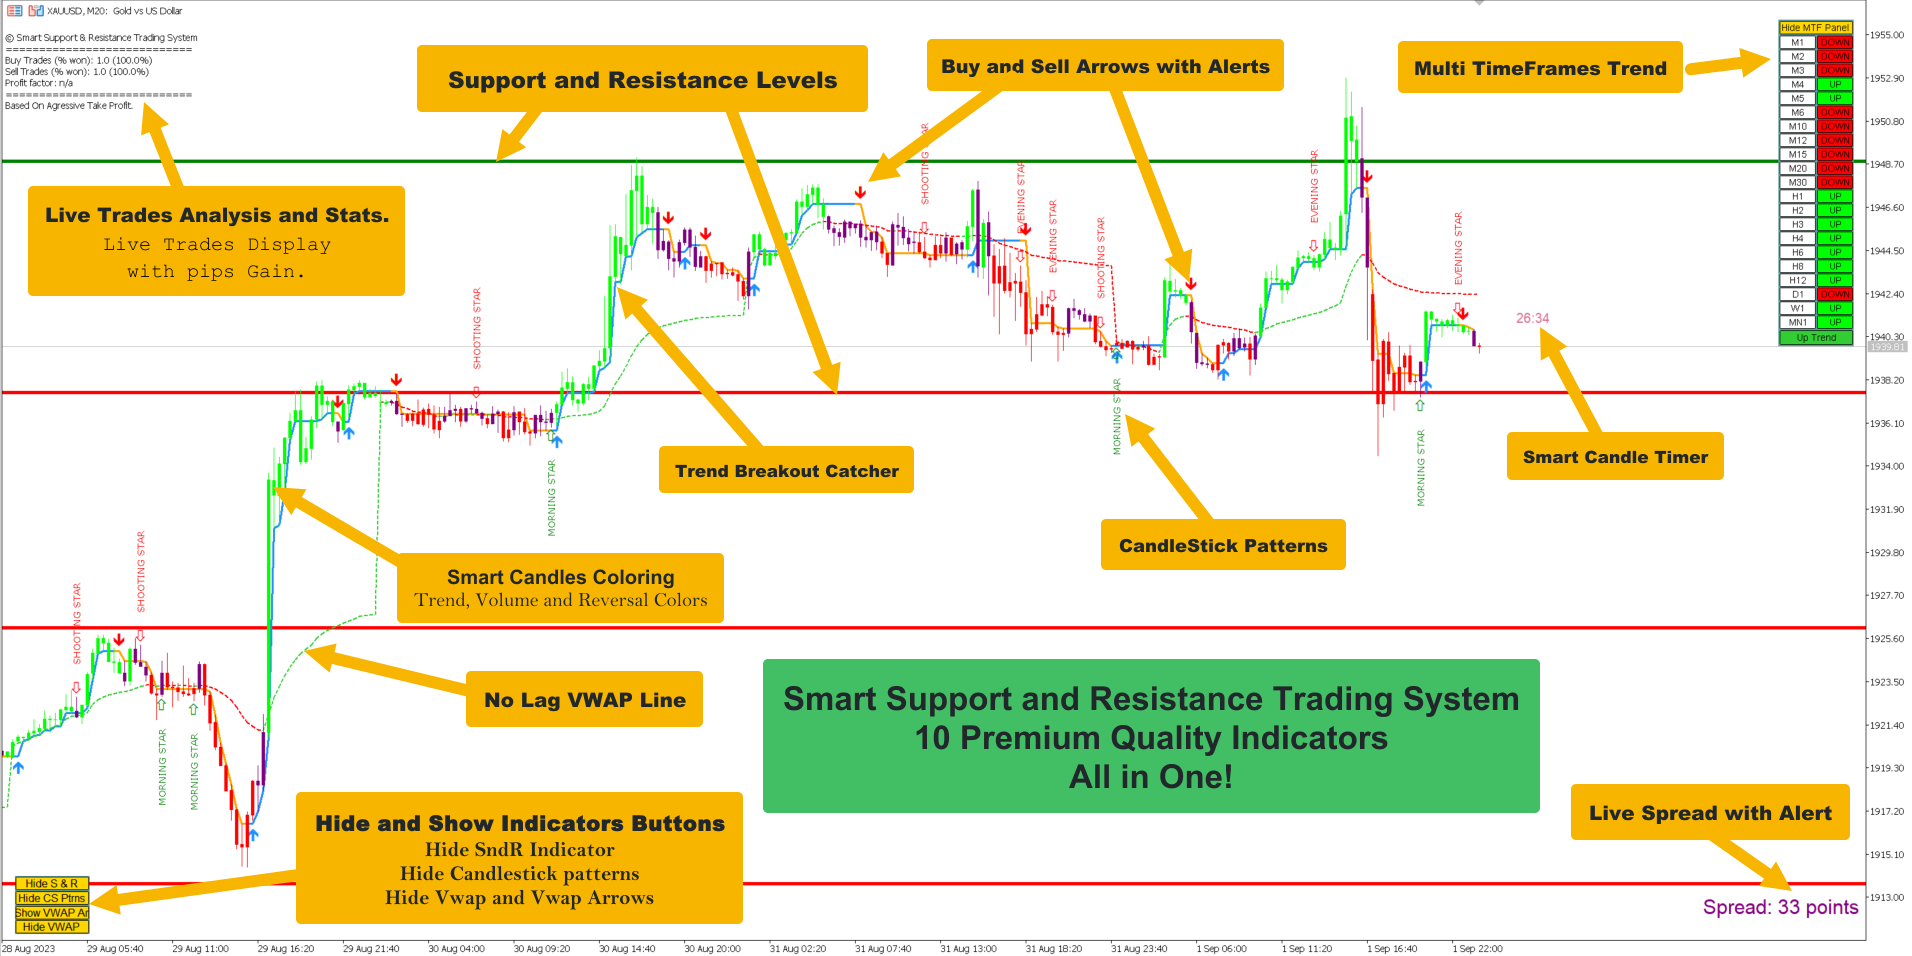
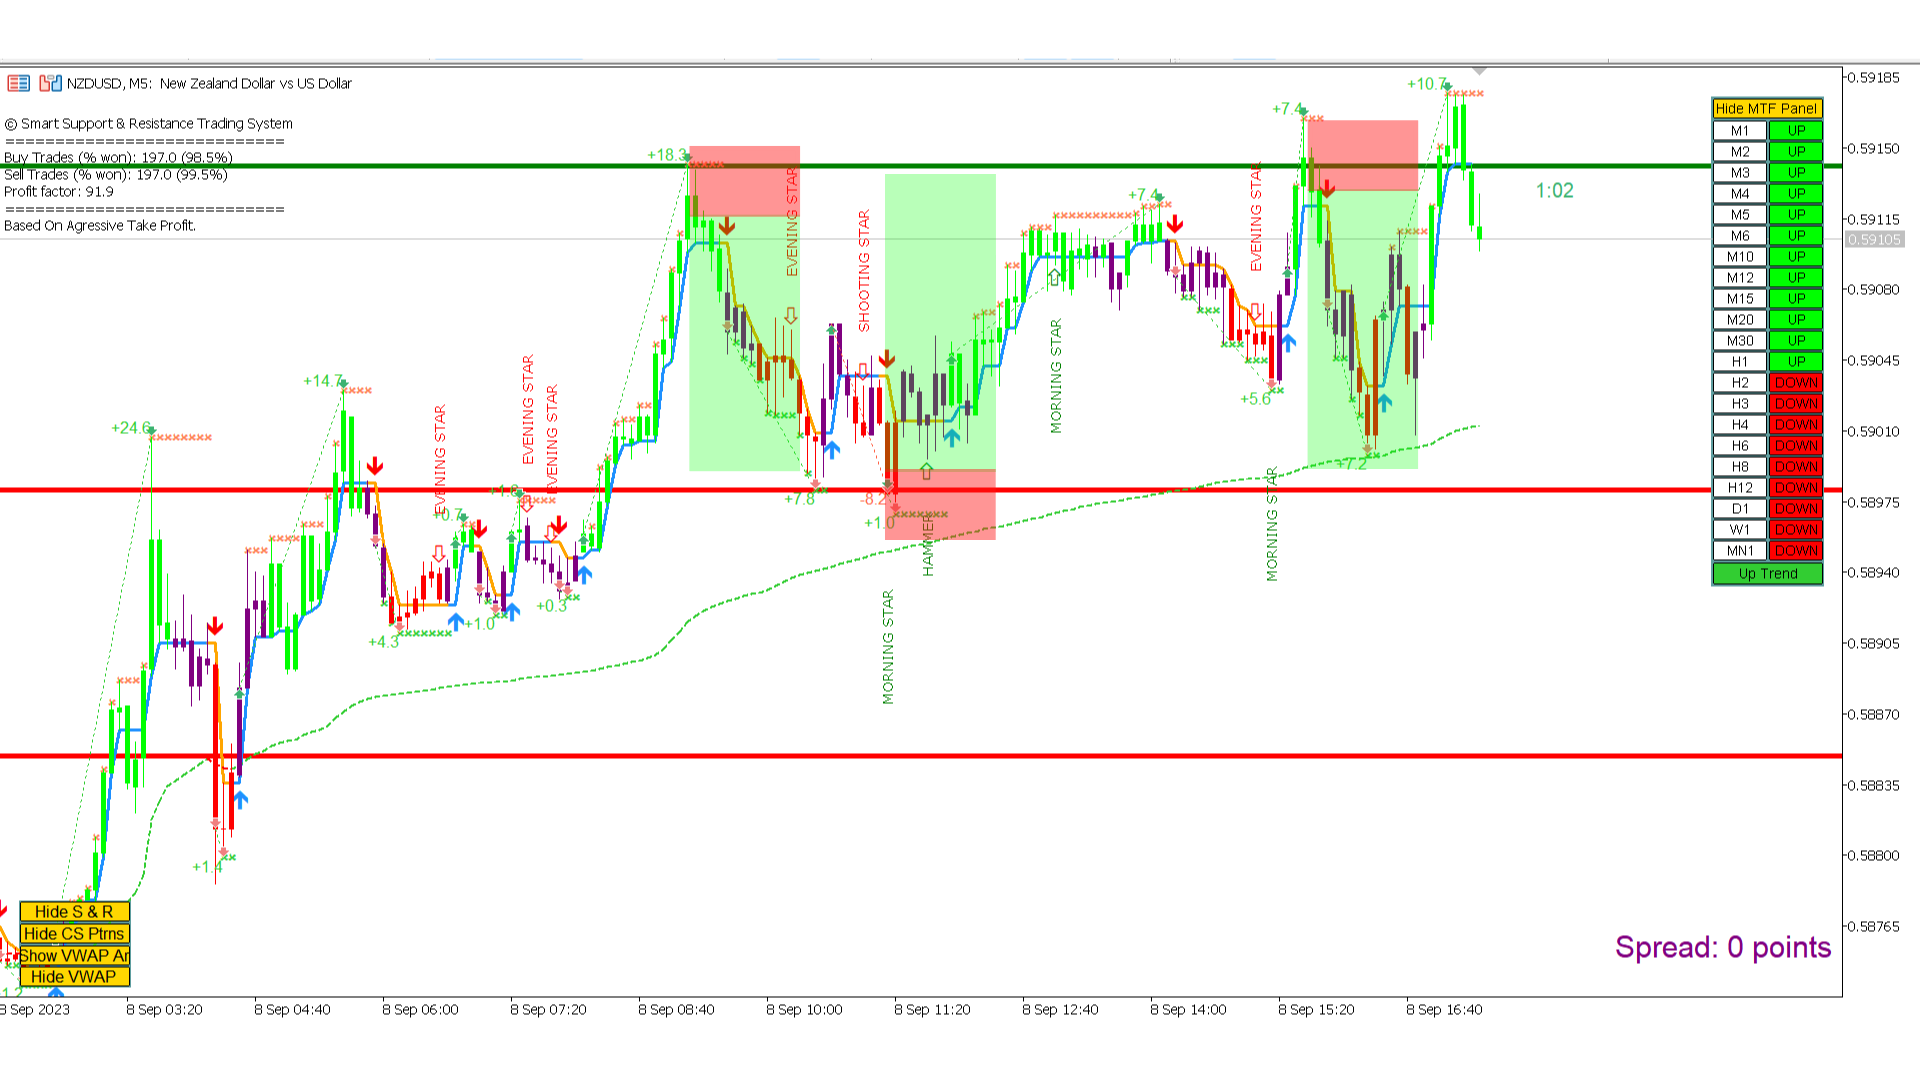
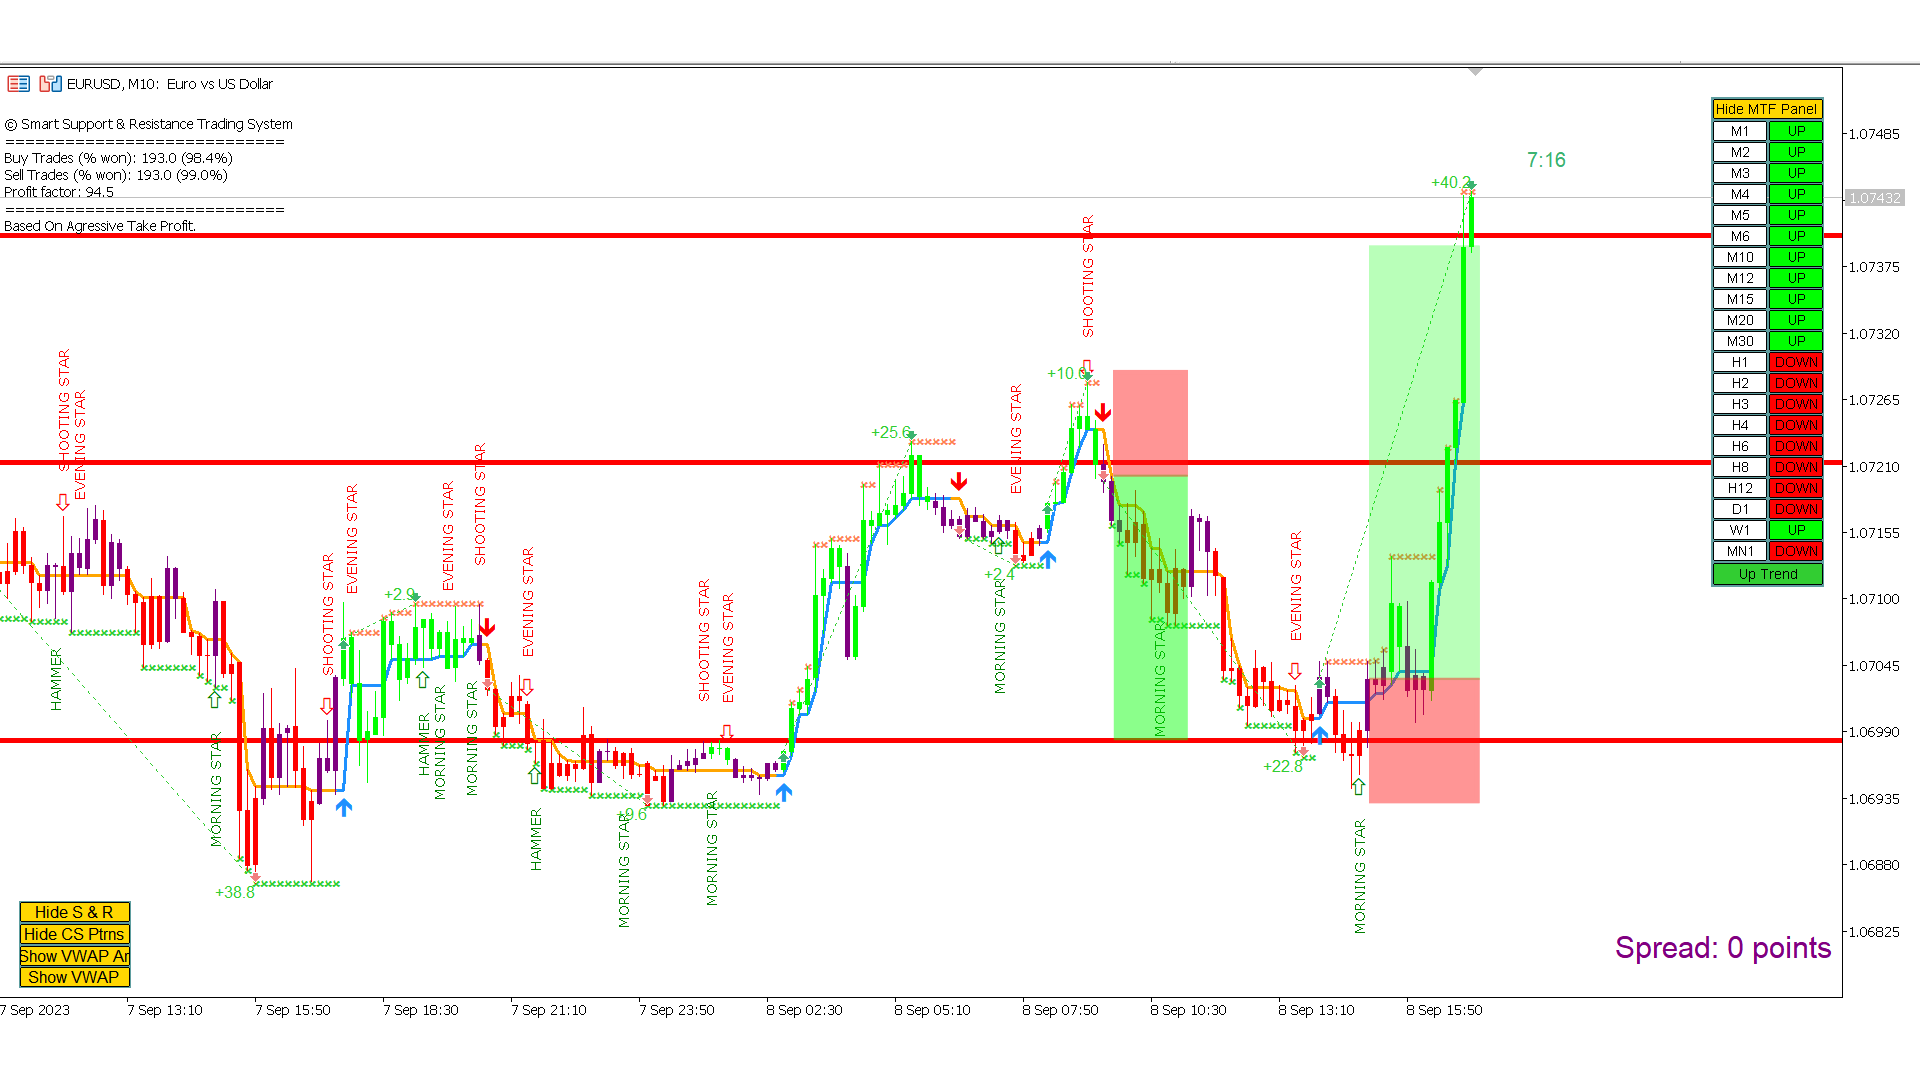
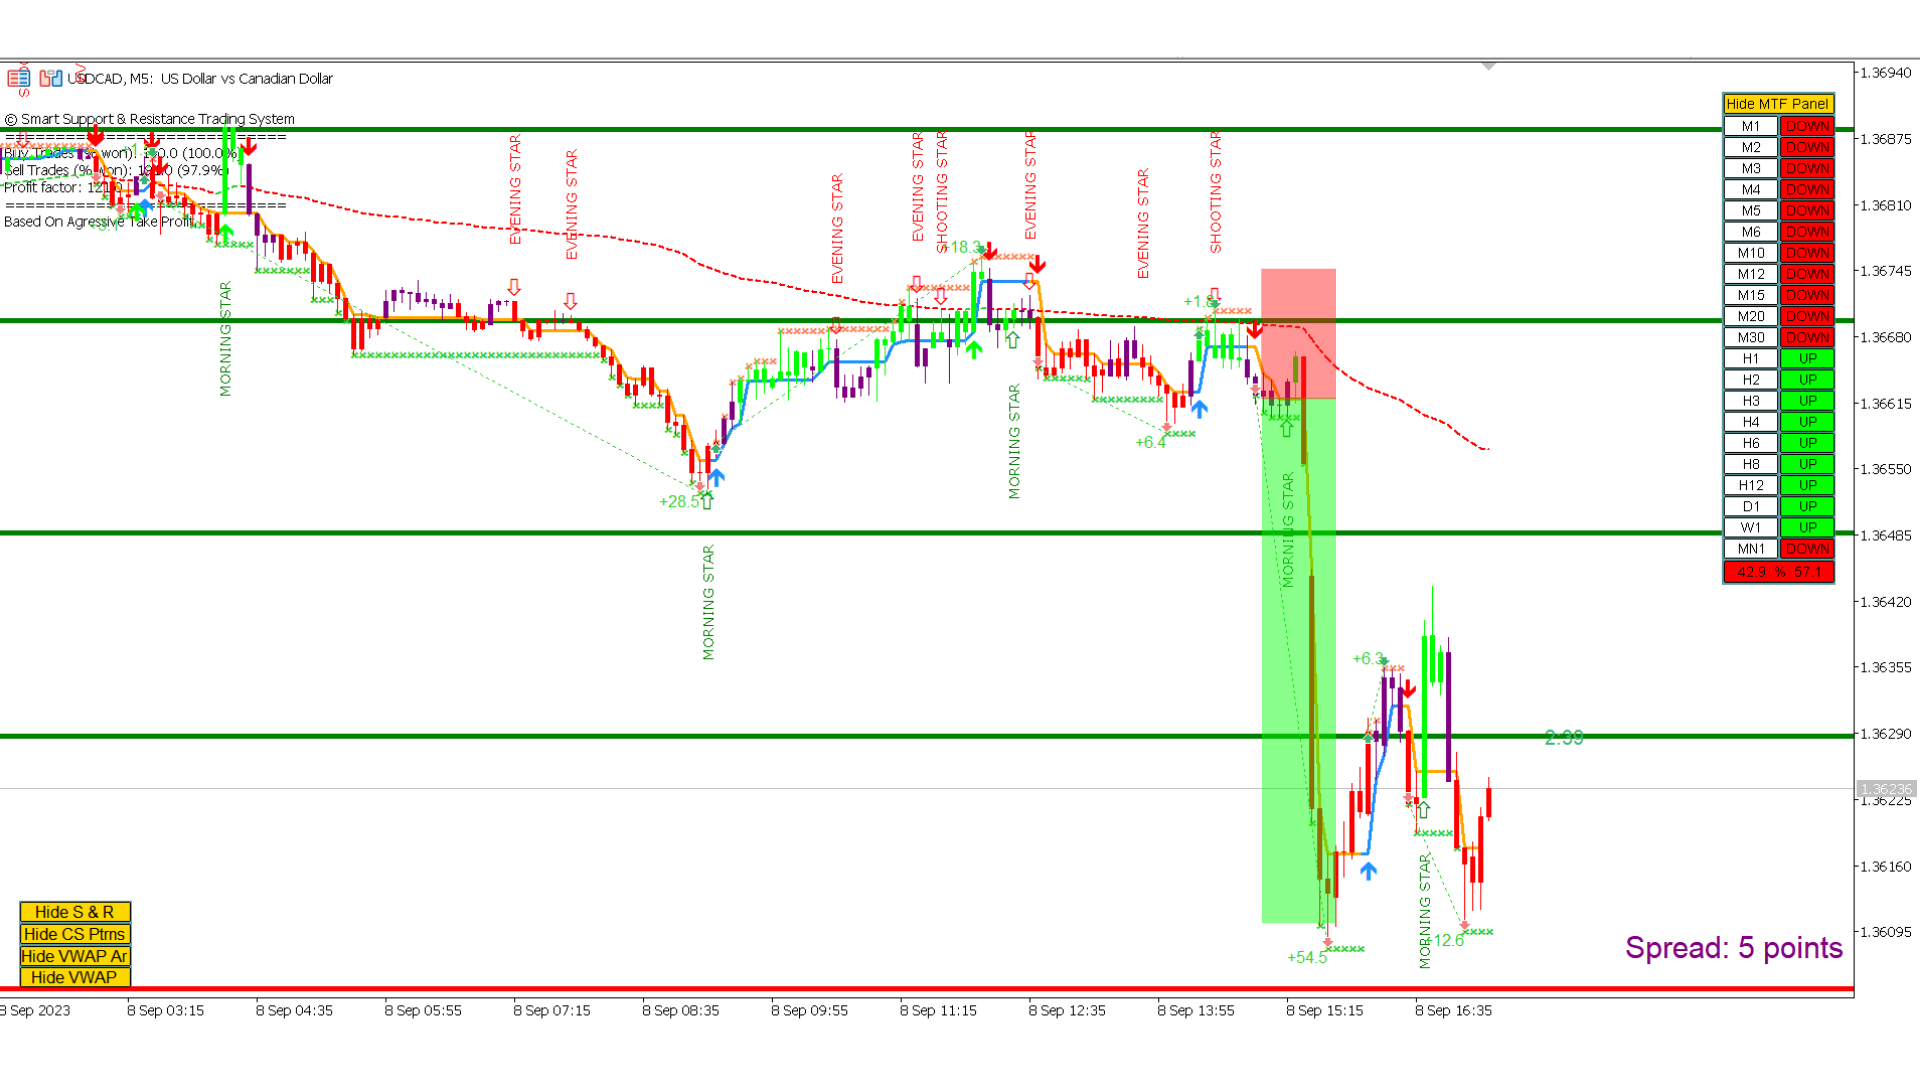
“智能支撑和阻力交易系统”是专为新手和经验丰富的交易者量身定制的先进指标。它赋予交易者在外汇市场上精确和自信的能力。这个综合系统结合了7+种策略、10个指标和各种交易方法,包括日内交易策略、波段交易策略、支撑和阻力策略、蜡烛图模式策略、VWAP策略、多时间段趋势策略等。它提供箭头信号、入场和出场点、交易警报、更高时间框架的趋势分析、实时交易监控以及见解深刻的趋势和成交量蜡烛染色。通过自动支撑和阻力检测,这是一个多面手的指标,帮助交易者在不同的市场条件下做出明智的决策。
“智能支撑和阻力交易系统”是一个强大的技术分析方法,融合了一套高端和强大的指标和工具。在其核心,这个系统识别关键的支撑和阻力水平,这些水平作为潜在市场反转或延续的关键区域。该系统无缝集成了多时间框架趋势面板,增强了交易者在不同时间框架下评估当前趋势方向的能力。此外,蜡烛图模式检测器扫描价格图表以获取重要的蜡烛图模式,为潜在的市场走势提供宝贵的见解。此外,VWAP(成交量加权平均价格)的加入帮助交易者评估市场情绪和日内趋势,这对日内交易非常理想。
“智能支撑和阻力交易系统”还提供了趋势突破捕捉器,识别和确认趋势突破,帮助交易者及时进出场。该系统还采用了趋势和成交量蜡烛染色,通过根据趋势强度和成交量特征动态着色蜡烛,增强了可视化效果。为了为交易者提供实时信息,该系统包括带有警报的实时点差指标,提醒交易者市场条件的变化。“智能蜡烛计时器”确保交易者了解蜡烛结束时间,帮助决策。
最后,“实时交易分析”功能直接在图表上打印出关键交易统计信息,为交易者提供关于他们交易表现的可行见解。通过整合这些先进的指标和工具,“智能支撑和阻力交易系统”为寻求有效自信地驾驭市场的交易者提供了全面的解决方案。
特点:
- 不重绘、不重画和不滞后的指标
- 7+种策略
- 10个指标合二为一
- 日内和波段交易策略
- 跟随趋势、逆转和剃头交易策略
- 自定义策略
- 专业公司策略
- 入场和出场点以及箭头
- 手机和电子邮件警报
- 多时间框架分析
- 自动支撑和阻力
- 所有种类的蜡烛图模式
- 反转区域
- 移动止损
- 成交量、趋势和逆转蜡烛染色
- 蜡烛计时器和点差限制指标
- 实时交易分析


Hi, I just bougt it. But how come my show panel botton is not working same as Show SnDR? Could you help me to solve it?