适用于MetaTrader 4的技术指标 - 24

The indicator returning pivot point based trendlines with highlighted breakouts . Trendline caculated by pivot point and other clue are ATR, Stdev. The indicator also includes integrated alerts for trendlines breakouts and foward message to Telegram channel or group if you want. Settings · Lookback bar: Default 200 is number of bar caculate when init indicator. · Length: Pivot points period · Slope Calculation Method: Determines how this lope is calcula

Wicks UpDown Target
Choppy movement up and down on the opening range every day. Trading breakouts on London session and New York session is recommended. Wicks UpDown Target is specialized in all forex pairs.
Guideline Entry Strategy Idea:
Step 1 - Breakout Forming (Warning! Trade on London Session and New York Session) Step 2 - Breakout Starting (Take Action on your trading plan) Step 3 - Partial Close your order & set breakeven (no-risk) Step 4 - Target complete Step 5 - Don't trade in
MT5 Version
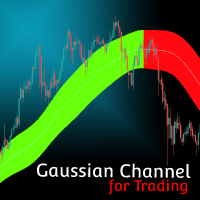
Gaussian Channel MT4 Gaussian Channel MT4 is the first indicator in the market that uses Ehlers Gaussian Filter methods to define trends. Nowadays, this Gaussian Channel is highly known as a method to support HOLD techniques in crypto. If the price is above the channel the trend is strong, if it comes back to the channel this can react as a resistance and indicate the beginning of a bear market (or Winter) if the price breaks below it. Eventhough the use of this channel focuses on
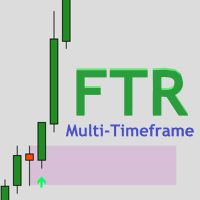
The FTR Multi-Timeframe indicator is a versatile tool that can add great value to your trading arsenal. This indicator is intended to be used to add confluence to your already existing trading strategy, such as, breakout & retest, supply and demand, patterns or continuation trading. FTR Multi-Timeframe is a continuation indicator. Rules are attached as a screenshot.
Settings for Demo/Strategy Tester: Set Server_Time_Filter to false in indicator settings ( IMPORTANT! ). Tick 'Show object desc

Heikin-Ashi charts , developed by Munehisa Homma in the 1700s. Munehisa Honma was a rice merchant from Sakata, Japan who traded in the Dojima Rice market in Osaka during the Tokugawa Shogunate. He is considered to be the father of the candlestick chart. Th e man who invented the use of candlestick charts for finding and profiting from chart patterns.He was a billionaire trader on those days if we compared his net-worth with todays dollar . Heikin Ashi Scanner is an Multi-Currency and Multi

This indicator tool provides mini charts, with adjustable symbol/tf that can be dragged and resized into place. Lightweight operation with multiple mini charts are supported.
Chart features: adjustable symbol and tf draggable resizeable multiple mini charts color styling and font sizing, foreground/background colors candle coloring candle styles; candles, bars, line, high-low channel
optional background color gradient predfined period separators on all tf's (eg 1hr/1day sep on 1Min, 4hr/1day

Must be owned and used by Fibonacci traders who like to open position by pending order (limit order). The strategy is that you just have to wait for the automatic custom fibonacci appear then manual place your pending order, stop loss and take profit at the level of Fibonacci. The position will be opened when the price make a successful retest. Fibo Heart Indi come with pop-up alert, email and mobile push notification. Suitable for all instruments and all time frames. Don't miss the trading set

万能线段划分指标简介: 万能线段划分是依照两根相互缠绕的均线,依金死叉为标准,将金死叉两边的高低点进行连接开成线段划分。本指标可以设定不同参数多级别叠加使用。 万能分段的原理: 在任意一组均线组成的均线系统中,均线之间的相互缠绕,形成的金死叉是有位次关系的。这点,作者在这里算是首次对外公开这个秘密。上图的均线系统中,走势处于一个较大级别的振荡行情中,均线之间相互缠绕比较频繁,金死叉的数量较多,所以,情况比较复杂。 我们知道,均线可按其周期大小进行位次排序。上图均线依照周期从小到大排序为:MA10,MA30,MA60,MA144,MA233,依照这组均线的位次关系,将每相邻两根均线金死叉做上标注。如:MA10&MA30金死叉标注为“1”,MA30&MA60金死叉标注为“2”,MA60&MA144金死叉标注为“3”,MA144&MA233金死叉标注为“4”。我们将两相邻均线金死叉完全标注完毕后,发现图上还有部份金死叉并未被标注到,这些未被标注到的金死叉全部是非相邻均线之间发生的金死叉。我们依照以上方法,可以识别出均线组之间金死叉的级别位次关系。市场行情的发展是依照此级别位次关系,从小到大
FREE
Индикатор BestTF поможет быстро выбрать самый лучший для торговли таймфрейм валютной пары или криптовалюты. Индикатор BestTF рассчитает и покажет в таблице крутизну графика (волатильность) для всех существующих таймфреймов текущего торгового инструмента. Почему важно правильно выбрать таймфрейм
Выбор таймфрейма является ключевым аспектом при торговле на валютном рынке по нескольким причинам:
Торговые стратегии: Различные торговые стратегии эффективны на разных таймфреймах. Например, краткоср
FREE

The StrikePin indicator is a technical, analytical tool designed to identify trend reversals and find optimal market entries. The StrikePin indicator is based on the pin bar pattern, which is the Price Action reversal pattern.
An entry signal, in a trending market, can offer a very high-probability entry and a good risk to reward scenario.
Be careful: the indicator is repainting since it is looking for highest high and lowest lows. You should avoid to use it in experts but you can use it
FREE
MT5 Version Available Here: Coming soon...
Telegram Channel & Group : https://t.me/bluedigitsfx
V.I.P Group Access: Send Payment Proof of any of our Paid Products to our Inbox
Recommended Broker: https://eb4.app/BDFXOsprey * The Most User Friendly Symbol Changer on Metatrader ! Features
Change Timeframes in 1 click of a button on 1 chart. Change Between All Currency Pairs in 1 Click of a button on 1 chart. Ability to Turn Boxes to Current Candle Colors. Easily Identify the Trend f
FREE

Introduction and Description
The indicator displays an arrow whenever a " Bearish Engulfing " is detected. The latter usually indicates the beginning of a downward trend. A bearish engulfing pattern is a technical chart pattern that signals lower prices to come. The pattern consists of an up candlestick followed by a large down candlestick that eclipses or "engulfs" the smaller up candle. The pattern can be important because it shows sellers have overtaken the buyers and are pushing the price m
FREE

The Trend Finding Channels indicator was developed to help you determine the trend direction by drawing channels on the graphical screen. It draws all channels that can be trending autonomously. It helps you determine the direction of your trend. This indicator makes it easy for you to implement your strategies. The indicator has Down trend lines and Up trend lines. You can determine the price direction according to the multiplicity of the trend lines. For example , if the Down trend lines s
FREE

The LexusBO indicator is recommended for trading binary options . Signals are generated when the RSI, ADX, CCI indicators cross the customizable levels. The indicator displays signals using "up/down" arrows on the chart. Their values are available in the buffer arrays (buffer with index 0 - "up" arrow, with index 1 - "down" arrow). This makes the indicator easy to use for automated trading through specialized Expert Advisors. The recommended timeframe is M5. The indicator has a built-in counter
FREE

BinaryWizardMT4 is a powerful indicator for trading short-term binary options. In fact, this is a ready-made trading system. The indicator calculates the reference point and a short-term support and resistance levels. After the current price crosses the resistance level, a sell signal is formed (SIGNAL: SELL). Similarly, after the price crosses the support line, a buy signal is activated (SIGNAL: BUY).
Parameters x1, y1 - binding coordinates of the indicator window to the upper left chart corn
FREE
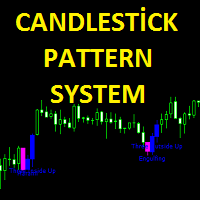
Candlestick pattern system finds 40 candle formations. Features Has the feature to send the notification. It has candlestick patterns feature. Bullish patterns feature. Bearish patterns feature. Trend filter and reliability features.
Parameters Show alert - Send alert Send email - Send alerts to mail address. Look back - Retrospective calculation === PATTERN SETUP === Show bullish patterns - Open close feature Show bearish patterns - Open close feature Trend filter - Open close feature

The Elder Impulse System was designed by Alexander Elder and featured in his book. According to Elder, “the system identifies inflection points where a trend speeds up or slows down”. The Impulse System is based on two indicators, a exponential moving average and the MACD-Histogram. The moving average identifies the trend, while the MACD-Histogram measures momentum. As a result, the Impulse System combines trend following and momentum to identify tradable impulses. This unique indicator combina

Average Daily Weekly Monthly Range Alerts.
The most complete multi-period dynamic range indicator with full alert options. Visually displays the Average Range lines on chart + real time distances to the Range Highs and Lows. Notifications are sent when the average ranges are hit. An essential tool for any serious trader! Average period ranges, especially the ADR (Average Daily Range) for day traders, are one of the most useful and consistently reliable indicators available to traders. Always a

MT5 Version Kill Zones
Kill Zones allows you to insert up to 3 time zones in the chart. The visual representation of the Kill Zones in the chart together with an alert and notification system helps you to ignore fake trading setups occurring outside the Kill Zones or specific trading sessions. Using Kill Zones in your trading will help you filter higher probability trading setups. You should select time ranges where the market usually reacts with high volatility. Based on EST time zone, followi

Key Level Key Level is a MetaTrader 4 Indicator that uses a proprietary algorithm based on Price Retracement/Breakout Method to show the Entry-Line on your trading.
Instead, it analyzes data of market and identify entry points and opportunities. (Price Retracement / Price Breakout)
It's also a trading tool that be used to practice and enhance your manual trading skills.
Key Level is an amazing tool for Scalping Trader. It also a trading tool that be used to practice and enhance your manual t
FREE
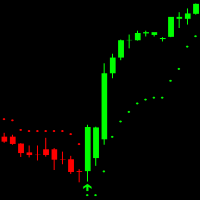
Easy Trend Indicator can be used for all forex pairs, indices and cryptocurrencies. It´s a non rapainting Trend trading indicator and works on all timeframes. GREEN candles show an uptrend and RED candles show a Downtrend. Arrows show when to enter the Market. Indicator has 7 Inputs: Max History Bars = On how many Bars in the Chart the indicator is drawn ATR Period = How many Bars are used for Average True Range calculation ATR Multiplier = Is used for Indicator sensitivity (Higher multiplier =

This indicator draws regular bullish and bearish divergences in real-time onto the charts. The algorithm to detect those divergences is based on my 10+ years experience of detecting divergences visually. The divergences are drawn as green and red rectangles on the charts. You can even do forward testing in the visual mode of the strategy tester.
Parameters Fast EMA Period: The period of the fast EMA of the MACD. Default value is 12.
Slow EMA Period: The period of the slow EMA of the MACD. Def

This is a unique multi-currency trading strategy developed for trading on H1 timeframe, which allows you to determine the global market entry points and obtain the maximum profit for each transaction. The market entry point is calculated using a variety of author equations and algorithms. We recommend using the indicator simultaneously on several trading instruments . A huge advantage of Big Deals System is an information panel in which the user can see the current information on potential entry

WaveTrend Momentum Oscillator is an upgrade to the popular and easy-to-use WaveTrend Oscillator. The WaveTrend Momentum Oscillator adds a momentum component to the original WaveTrend calculation, in order to provide faster and more accurate entry points during trendy market conditions. Do you prefer the original WaveTrend Oscillator? The WaveTrend Momentum Oscillator allows you to switch between momentum and original WT versions. Both provide valuable information depending on the market conditio
Hello dear friend! Here's my story. I'm fast. After many attempts to trade manually, I decided to use expert. I started writing my robot. But testing took a lot of time! In parallel, I tried other people's robots. And again I spent a lot of time testing. Night scalpers, news scalpers, intraday scalpers, and many other classes... you needed to know exactly when the robot was trading, when it was making a profit, and when it Was losing. Some robots have time-based trading features that are not de

The indicator is specially designed for the trading utility Trade Shell (included Trade Shell SMC ) to get it working on visual strategy tester.
Backtest your trading ideas and indicators. Run Trade Shell on visual tester and then put this indicator on the chart. After that you will be able to control all functions of the Trade Shell as well as with live using! It does not work live! Use it with visual tester only. It does not require to set any setting on input parameters.
Have a good luc
FREE

The indicator compares quotes of the current symbol and a synthetic quote calculated from two specified referential symbols. The indicator is useful for checking Forex symbol behavior via corresponding stock indices and detecting their convergence/divergence which can forecast future price movements. The main idea is that all stock indices are quoted in particular currencies and therefore demonstrate correlation with Forex pairs where these currencies are used. When market makers decide to "buy"

MultiCurrencyWPR (MCWPR) indicator applies conventional WPR formula to plain Forex currencies (that is their pure strengths extracted from Forex pairs), market indices, CFDs and other groups of tickers. It uses built-in instance of CCFpExtraValue to calculate relative strengths of selected tickers. Unlike standard WPR calculated for specific symbol, this indicator provides a global view of selected part of market and explains which instruments demonstrate maximal gain at the moment. It allows yo

This is a multitimeframe RSI indicator defining trends, oversold/overbought zones, as well as all intersections of signal lines from different timeframes on a single chart using arrows and audio alerts. When working with standard RSI, we often need to examine data from all necessary timeframes simultaneously. RSI 7TF solves this issue. If you are only interested in audio signals when signal lines are crossed, then have a look at RSI Alerts . Attention! The indicator uses seven timeframes - M5, M
FREE
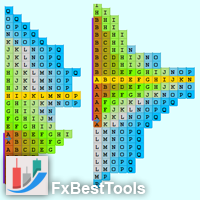
Definition : A Market Profile is an intra-day charting technique (price vertical, time/activity horizontal). Market Profile is best understood as a way to see order in the markets. Market Profile was a way for traders to get a better understanding of what was going on, without having to be on the trading floor. The current indicator is developed based on Easy-to-Use architecture including a wide range of visual settings.
Major Features of Indicator : Various Views of Market Profile The indica

Currency Power Meter shows the power of major currencies against each other. The indicator shows the relative strength of currency/pair at the current moment in a period of time (H4, daily, weekly, monthly). It is useful for day traders, swing traders and position traders with suitable period options. Currency power is the true reason of market trend: The strongest currency against the weakest currency will combine into a most trending pair. As we know, trend makes money and all traders love tre
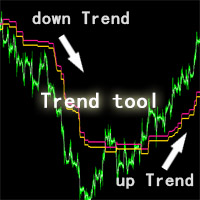
这款智币趋势工具适合所有品种,适合5分钟以上周期,是一款很好的判断趋势的工具! 价格在两条线的下方是下跌趋势,价格在两条线的上方是上涨趋势 参数设置说明: till_breakeven_rate:确定通道线跟随价格的紧密程度,直到交易平衡。推荐80 space1:确定从支持或阻力开始到上涨或下跌大于start_at_pips_profit2的通道线的宽度。建议3-5每个标准差等于6个点。它应该比space2和space3更宽,所以交易有第一次打开时成长的空间。 expand_rate1:确定在交易平衡后通道线将跟随价格的紧密程度。建议20-60 start_at_pips_profit2:确定在执行第二组设置之前交易必须达到的上涨或下跌的点数。建议40-60 space2:确定上涨或下跌大于start_at_pips_profit2后的通道线的宽度。建议1.5-3每个标准差等于6个点。它应该小于space1但大于space3。 expand_rate2:确定上涨或下跌大于start_at_pips_profit2后通道线将跟随价格的接近程度。建议50-100 start_at_pi
FREE

Dear everyone, Today, I would like to introduce you to an amazing tool on the MetaTrader 4 platform - "Pivotal Moments." This indicator will be a reliable companion on your trading journey in the financial market. "Pivotal Moments" is not just an ordinary indicator, but an intelligent tool that helps you better understand significant fluctuations on the chart. With a variety of customization options, it provides valuable information and deep insights into the market. The key features of "Pivotal
FREE
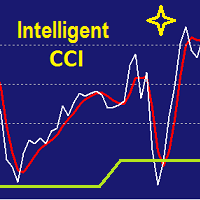
It is CCI indicator with very smooth and noiseless movement that calculates four levels of buy, sell, overbought and oversold dynamically. Professional traders know well that level of 100, 200 or -100 and -200 are not always right and need fine adjustments. This indicator calculates those levels dynamically by using mathematics and statistic methods in addition to shows divergence between indicator and price. Like original CCI, for best result you have better to set proper value for CCI period b

量子擺動 1.什麼是量子擺動? 該指標基於量子數學,以高概率和方向精度顯示未來價格水平。級別顯示為進行交易決策的區域;它們明確定義了具有最小和最大利潤的訂單的窄範圍。該指標顯示不同時期的未來交易區H1,H4,D,W。它還顯示量子振盪而不參考時間。適用於所有交易工具。外匯市場,股票市場,期貨市場和商品市場將改變為MT4交易平台上使用的所有工具。 2.量子擺動的優點和不同之處: 在線汽車打造優質交易平台。 交易決策區域的構建和顯示的準確性。 以未來時態展示貿易區,帶領您領先一步。 易於使用和應用。 聊天電報中頻道的在線支持 https://t.me/nest8 每日評論和直播YouTube頻道 https://www.youtube.com/watch?v=kzapOX0cGfc&feature=youtu.be 2.交易策略。 指標描述,交易策略,調整和交易計劃將在YouTube頻道上詳細顯示,並在聊天電報中進行討論。
FREE

「趨勢反轉ml4」是一個獨特的指標,旨在即時確定價格反轉的時刻。 這是Metatrader4現成的交易系統。 該指標不會重繪其值! 該指標基於先進的演算法和技術分析,為您提供有關可能的市場進入和退出點的清晰訊號,幫助您做出明智的決策。
此指標的優點: 訊號精度高。 指標本身向交易者顯示其配置是否正確。 在零蠟燭附近,指標繪製總計值。 如果該值為負,那麼您需要調整指標設置,如果該值為正,則表示設定選擇正確,您可以開始交易。 此指標不會重繪其值。 此指標可用於所有時間範圍和所有貨幣對。 這是一個現成的交易系統。
特點:
反轉箭頭: 紅色箭頭清楚地表明可能的開倉賣出交易點,警告即將到來的價格下跌。 藍色箭頭突出顯示了開啟買入交易的區域,表明可能出現上漲趨勢。
多時期分析: 此指標支援多個時間間隔的分析,使您能夠考慮不同時間等級的趨勢和反轉。
各種市場條件下的應用: Precision Reversal Pro 策略是基於對波動性和流動性的仔細研究,使其成為平靜和活躍市場條件下的有效工具。
設定的靈活性: 此指標可讓您根據您的喜好和交易風格自訂參數
使用方便: 輕
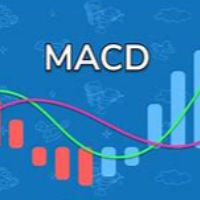
这是一个基于指数移动平均线(EMA)角度的自定义指标,通常用于测量EMA线的趋势角度。以下是关于该指标的主要参数和功能: 主要参数: md1 :EMA的快速周期,默认值为12。 md2 :EMA的慢速周期,默认值为26。 md3 :MACD信号线的周期,默认值为9。 功能: 该指标计算了MACD指标,并根据MACD主线的方向和角度将数据划分为不同的顶点。 UpBuffer :用于存储MACD主线上涨的值,对应于绿色柱子。 DownBuffer :用于存储MACD主线下降的值,对应于红色柱子。 ZeroBuffer 黄色:用于存储MACD主线接近零的值,对应于柱子。 SigMABuffer :用于存储MACD信号线的值。 功能描述: 该指标在计算时,会比较MACD主线和信号线的数值来确定柱子的颜色和位置。 如果MACD主线大于零且大于信号线,则柱子将为绿色的,放置在 UpBuffer 平面图上。 如果MACD主线小于零且小于信号线,则柱子将是红色的,放置在 DownBuffer 平面图上。 如果MACD主线接近零,则柱子将为黄色的,位于 ZeroBuffer 平面图。 指标将在独立窗口
FREE

Rung 趋势指标。该指标识别并用不同颜色标记价格变动的主要趋势,同时消除噪音和与主要趋势相反的短期价格变动,而不对其作出反应。 指标是确定市场当前趋势的工具。在默认设置下,上升(“看涨”趋势),指标用绿线标记,下降趋势(“看跌”)趋势 - 当价格在通道中移动时,用红线标记为横向或持平的价格走势,指标没有反应。走廊或横向价格变动的值可以通过指标设置进行调整。
指标设置说明 限制点 - 走廊的大小,以点为单位。 coefficient_smoother - 平滑系数。 警报 - 显示包含用户数据的对话框。 Text_BUY - 购买信号的自定义文本。 Text_SELL - 卖出信号的自定义文本。 Send_Mail - 向在“邮件”选项卡上的设置窗口中指定的地址发送电子邮件。 主题 - 电子邮件的主题。 Send_Notification - 向移动终端发送通知,其 MetaQuotes ID 在“通知”选项卡的设置窗口中指定。 该指标表示最后一根柱线的趋势变化,该柱线正在形成并且可以改变其方向,因此等待固定柱线的信号很重要。
FREE

Rainbow MT4 is a technical indicator based on Moving average with period 34 and very easy to use. When price crosses above MA and MA changes color to green, it’s a signal to buy. When price crosses below MA and MA changes color to red, it’s a signal to sell. The Expert advisor ( Rainbow EA MT4) based on Rainbow MT4 indicator, as you can see in the short video below is now available here .
FREE

the AK CAP toolbox free to use;
it includes the same indicators we use for our daily trading and we think the simpler the better. Lightweight indicator for use on all timeframes. that includes VWAP with vwap value indicator on top right. 3 EMA: FAST, MEDIUM, SLOW the candle timer to show how much time left in a candle.
colors and positions are fully customizable.
enjoy
FREE

Our team has finally achieved the expected result.
We have created artificial intelligence for binary options trading. Don't believe? Many users have already rated it positively. The results will surprise you too. This indicator broadcasts signals for a binary option through a telegram channel. All signals are reliable and of high quality.
Read more !!! ATTENTION !!!
You didn't dream !!! HOW TO EARN RIGHT NOW? The most successful signal channel for binary options Students,
FREE

Real Trade 在 1 小时以下的时间范围内进行交易。 在上升趋势和下降趋势方向上交易。 与更高的时间趋势方向交易并交易第一根蜡烛。 使用相反的比例退出或使用比率退出 1:1 或更高以及追踪止损。 在活跃时间和更高的趋势方向交易真实趋势以获得最佳结果。 在测试仪中加载指示器以研究结果和潜力。 使用顺势交易的剥头皮箭头或使用斐波那契目标或两者兼而有之。 推荐用于 5 或 15 分钟图表。
将 FIb 用于目标和止损: https://www.mql5.com/en/code/12813
Real Trade 在 1 小时以下的时间范围内进行交易。 在上升趋势和下降趋势方向上交易。 与更高的时间趋势方向交易并交易第一根蜡烛。 使用相反的比例退出或使用比率退出 1:1 或更高以及追踪止损。 在活跃时间和更高的趋势方向交易真实趋势以获得最佳结果。 在测试仪中加载指示器以研究结果和潜力。 使用顺势交易的剥头皮箭头或使用斐波那契目标或两者兼而有之。 推荐用于 5 或 15 分钟图表。
将 FIb 用于目标和止损: https://www.mql5.com/en/code/128

Introducing the “Symbol Cost Info MT4” indicator – your ultimate tool for staying ahead in the forex market! This innovative indicator is designed to empower traders with real-time cost information, directly on their charts. Here’s why every trader needs the “Symbol Cost Info MT4” in their arsenal: Real-Time Spread Monitoring : Keep a close eye on the spread for any currency pair, ensuring you enter the market at the most cost-effective times. Pip Value at Your Fingertips : Instantly know t
FREE

Индикатор отображает различными цветами на фоне графика три торговые сессии. Открытие - закрытие Лондон, Нью Йорк, Токио по умолчанию. Применение Для успешной торговли важно знать начало и конец торговых сессий с наибольшей ликвидностью, так как именно в это время цена делает самые большие движения.
Особенности Настройки по умолчанию - торговые сессии по Лондону, Нью Йорку, Токио. Возможность выставить свои рамки тоговых сессий Алерт при открытии сессии Показ открытия дня по GMT Настройки для
FREE

The M.O.D.E stands for " Multiple Oscillator Divergence Exit ". It is an indicator which signals a divergence between the price, and multiple oscillators. It is initially an exit indicator because it signals the weakening of a trend, but it could be used as an entry signal if used analytically Key Features: Check many divergences at once Non repainting Sends Alerts and Push Notifications You could load the M.O.D.E onto a single chart, and be able to see the divergences happening on multiple os
FREE

Double Exponential Moving Average ( DEMA ) is a moving average (MA) that gives the most weight to recent price data.Like exponential moving average (EMA), it is more reactive to all price fluctuations than a simple moving average (SMA) and so DEMA can help traders to spot reversals sooner, because it is faster responding to any changes in market activity. DEMA was developed by Patrick Mulloy in an attempt to reduce the amount of lag time found in traditional MAs. ( TASC_Feb. 1994 ). DEMA can al
FREE

You've probably heard about the Dow trend Theory, where higher highs and lows indicate an uptrend, and lower highs and lows indicate a downtrend. This indicator determines this trend based on the Dow Theory. You just need to enter a number representing the number of candles between extremes. The optimal solution is the number 3, unless you want to have the trend from M5 but you're on M1, then you need to multiply this number by 5. Check various combinations to trade with the trend. In the scree
FREE

"Drivers Road Bands" indicator that is designed to be used in the 1H, 4H and 1D timeframes in the most ideal way. If we compare timeframes to roads and streets; main streets and highways with high traffic volume are similar to high-time timeframes in technical analysis. If you can interpret the curvilinear and linear lines drawn by this indicator on the graphic screen with your geometric perspective and develop your own buy and sell strategies; you may have the key to being a successful trader.
FREE

StarBody è un indicatore istogramma che rappresenta la dimensione delle candele in relazione al loro volume ed evidenzia quelle più grandi delle precedenti. La formula per il calcolo dell'altezza dell'istogramma è semplice quanto efficace: Ampiezza * Volume La grafica indicherà tutte le candele più estese delle precedenti in base alle impostazioni scelte.
L'indicatore può essere utile, a volte indispensabile, nelle strategie che prevedono lo sfruttamento della continuazione del trend. Le strat
FREE

Unlock the power of precision in your trading strategy with Std Dev Channel, the innovative indicator designed to revolutionize your approach to market analysis. Crafted as an advanced version of the standard deviation indicator, Std Dev Channel empowers traders with enhanced insights into market trends and volatility patterns. With Std Dev Channel, harness the synergy of statistical analysis and technical charting to make informed trading decisions. This cutting-edge tool meticulously calculate
FREE

VR Ticks 是基于剥头皮策略的特殊指标。借助该指标,交易者可以直接在金融工具的主图表上看到即时图表。分时图表允许您尽可能准确地在市场上建仓或平仓。 VR Ticks 以线条的形式绘制刻度数据,这些线条根据方向改变颜色 - 这使您可以直观地了解和评估刻度的情况。分时图表的优点是它们不考虑时间范围,并且是根据价格变化构建的。 VR Ticks 构建尽可能最小的图表。 设置、设置文件、演示版本、说明、问题解决,可以在 [博客] 中找到
您可以在 [链接] 阅读或撰写评论
[MetaTrader 5] 版本 一个价格变动是一次价格变动。对于一次价格变动,价格可能会改变一个或几个点。重要的是要理解一次 蜱虫是一种运动 。 该指标在右下角显示卖价和买价,以及当前的点差值。指标的程序代码逐笔在 MetaTrader 窗口中构建图表。根据指标设置,图表中的增长时刻可以用一种颜色绘制,价格下跌的时刻可以用另一种颜色绘制。这种方法可以帮助交易者清楚地看到当前趋势的变化。该指标监控每个价格变动,并在图表上显示所有绝对所有价格变动。如果卖价或买价没有变化,指标将构建水平图表。 优点 使用倒卖策略进行
FREE

经过7年的发展,我决定免费发布我自己的一些指标和专家顾问(EA)。
如果您觉得它们有用,请给予 五星好评支持!您的反馈激励我继续提供免费工具。 也探索我的其他免费工具 这里 。
_________________________________ "带带子的RSI"指标 —— 更好的交易决策 "带带子的RSI"指标将经典的RSI与简单的带子相结合,更清楚地指示何时买入或卖出。它旨在帮助您发现进入和离开市场的最佳时机。 主要优势: 精准超买和超卖分析 : 通过添加带子来增强RSI,突出显示市场的真正极端,避免常见的误导信号。 清晰信号 : 轻松识别价格过高或过低的时刻,从而做出交易决策。 更好的时机 : 带子为常规RSI提供额外信息,帮助您找到采取行动的正确时刻。 如何使用: 用户友好设置 ️: 轻松将其添加到您的Metatrader 4中。几下点击即可根据您的需求进行调整。 易于阅读 : 关注指标,并用它来指导您何时买入或卖出。 "带带子的RSI"指标非常适合希望更智能而不是更辛苦交易的人,使用易于理解的信号。 联系方式 有问题或需
FREE

Pattern Explorer is a reliable tool for applying all the power of the most popular Japanese Candlestick Patterns . It uses Machine Learning algorithms to confirm all the patterns. What is the most impressive thing about it? Select Take Profit and Stop Loss and click on “Backtest your strategy” button to backtest your strategy in real time and to see according to your selection: Total signals Testable signals (signals that are reliable to be tested) Profitable signals (%) Loss signals (%) Total p
FREE

经过7年的时间,我决定免费发布一些我自己的指标和EA。
如果您觉得它们有用,请 通过五星评级表达支持!您的反馈将继续带来免费工具! 也查看我的其他免费工具 这里
_________________________________ 波林格带宽度指标——高级市场波动性分析工具 在MQL4中精心开发的波林格带宽度指标,是一款先进的工具,旨在提升外汇交易分析的水平。它利用波林格带测量波动性的能力,为交易者提供关于市场动态和潜在交易场景的关键洞见。 喜欢这个免费指标吗?请用五星评价来表示支持!您的反馈是我们提供免费工具的动力! 主要特点: 精准波动性测量 : 计算波林格带宽度(上带 - 下带)/ 中带,准确评估市场波动性。 市场状况洞见 : 识别战略性交易所需的高波动性(潜在突破)和低波动性(市场整合)时期。 全面趋势背景 : 加强对市场趋势的理解,较宽的带表明更大的波动性和潜在趋势强度。 与交易策略集成 ️: 作为各种交易策略的有价值组成部分,尤其是与其他指标结合时,用于细致分析。 使用和信号解读: 设置 ️: 轻松将波
FREE

Check my p a id tools they work perfect please r ate Adjustable PIN BAR indicator is usefull tool alowing to search for pin bars you wish to find on the price chart, it has 2 parameters to filter out what type of pin bars you wish to search for: 1) MinTailProc 75% (default) which means to show pin bars that has minimum size of the Nose (Tail) as 75% of full candle size. If Upper Nose (Tail) size of the candle is minimum 75% of the candle size fully than candle is painted in RED. If Lower Nose
FREE

隆重推出 Auto Trendline,这是一种创新的 MT4 指标,可自动
在您的图表上绘制趋势线。告别繁琐且耗时的手动绘制趋势线任务,
让 Auto Trendline 为您完成这项工作!
*购买后联系我向您发送 说明和分步指南。
凭借其先进的算法,Auto Trendline 会自动检测并为您绘制趋势线,
从而节省您的时间和精力。只需将指标附加到您的图表,并观察它根据价格行为的高点和低点识别和绘制趋势线。 Auto Trendline 是高度可定制的,允许您调整指标的灵敏度以适合您的交易风格和偏好。
您还可以选择不同的线条样式和颜色,甚至可以设置警报以在趋势线被打破时通知您。 无论您是初学者还是经验丰富的交易者,自动趋势线都是识别和分析任何市场趋势的重要工具。
凭借其友好的用户界面和高级功能,该指标一定会提升您的交易体验并帮助您做出更明智的交易决策。 主要特征:
自动绘制趋势线 高度可定制的灵敏度设置 多种线条样式和颜色 破损趋势线的警报通知 用户友好的界面 立即试用自动趋势线,发现自动趋势线分析的好处! 相关产品 : Auto Trend

现在用中文: 您是寻找金融市场长期机会的投资者吗? 我向您介绍自定义长期趋势指标。该指标专为希望在比日线、周线和月线更长时间跨度上交易仓位的交易者设计。 凭借清晰而准确的信号,您将获得所需的支持,以做出明智的决策。 主要特点: 长期策略:该指标非常适合致力于长期交易的投资者。 推荐时间框架: 我建议在比日线更长的时间框架上使用该指标,以获得最佳结果。 准确的信号: 等待指标生成的信号和蜡烛图的收盘,以做出明智的决策。 挂单交易: 为了优化使用,请考虑使用挂单交易,如买入止损单或卖出止损单。 适当的手数: 账户余额较小的情况下,可以通过使用0.01手的手数来进行有效的风险管理。 推荐货币对: 该指标的理想货币对包括XAUUSD(黄金)、XAGUSD(白银)、EURUSD(欧元/美元)和GBPUSD(英镑/美元)。 重要提示: 请记住,该指标是长期交易者的有价值工具。遵循推荐的指南,并将其适应到您的交易风格中。 如有任何问题或需要支持,请联系作者。 请注意,该指标是技术分析工具,不能保证盈利。 在使用任何指标或交易策略时,进行全面的市场分析并适当管理风险至关重要。 选择通过电子邮件直接从卖

The ' Average Bar Chart ' indicator was created to showcase the traditional Heiken Ashi calculation as an exotic charting style. This indicator is known for reducing chart noise for a smoother price action. A dditional indicators are recommended
Key Features Candlesticks for OHLC are removed from the chart. Average bars may be shown as complete bars without tails. All functionality and features of this exotic chart are inputs.
Input Parameters Chart Timeframe = PERIOD_CURRENT; - period to s
FREE

Average daily range, Projection levels, Multi time-frame ADR bands shows levels based on the selected time-frame. Levels can be used as projections for potential targets, breakouts or reversals depending on the context in which the tool is used. Features:- Multi time-frame(default = daily) Two coloring modes(trend based or zone based) Color transparency
FREE
Easily track and trade with the trend using this indicator. Uses a circle and line to indicate the trend direction. Excellent for channels. Features alert function.
Parameter TrendPeriod can be changed to your preference. How to use: Simply attach to any chart. Blue circle plus blue line cross below price = Buy. Red circle plus red line cross above price = Sell. Best results when taking higher time frames into consideration before entering a trade. (Hint: Wait for the radar/circle to appear on
FREE

分形指标的多货币和多时间框架修改。 显示最后两个分形 - 它们的序列(以及哪一个被破坏),或它们之间的距离。 您可以在参数中指定任何所需的货币和时间范围。 此外,该面板还可以发送有关分形突破的通知。 通过单击带有句点的单元格,将打开该符号和句点。 这是 MTF 扫描仪。
默认情况下,从图表中隐藏仪表板的键是“D”。
参数 Calculation of fractals based on — 分形搜索模式; — standart indicator — 按标准指标; — user bars — 按自定义栏的数量(可调整分形); Bars before (user calc) — 分形之前的柱数; Bars after (user calc) — 分形后的条数; Indicator mode — 显示模式 — Arrows — 分形的最后两个箭头; — Distance — 最后两个分形之间的距离; Show fractals on the chart — 在图表上显示当前分形; Clear the chart at startup — 启动时清除图表。 Set of Pa

The indicator informs when the current bar closes and a new bar opens. TIME is an important element of trading systems. BarTimerPro indicator helps you CONTROL THE TIME . Easy to use: place on the chart and set “alarms” if it necessary. In the tester, the indicator does not work. See the Lite version BarTimerPro-Lite
Key Features
4 operating modes: Shows the time elapsed since the opening of the current bar (11) Shows the time remaining until the current bar closes (11) Indicator Updates Ever
FREE
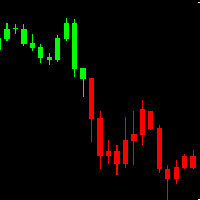
AH Candles MT4 AH Candles MT4 is a new product that allows identifying the current market phase (uptrend and downtrend ).
This indicator paints bars in different colors depending on the current state of the market trend ( Green and Red )
AH Candles MT4 is use for trading currencies
Advantages Suitable for intraday and swing trading. The indicator base on EMA method to calculate Period Parameters It can be used as a standalone tool or together with other indicators.
How to use
FREE

Simulator for Risk / Reward ratio calculator We-RiskReward is a MT4 indicator made by the We-Trading team to simulate an order with Risk / Reward calculator.
Horizontal Lines This indicator show you 3 horizontal lines that are: Open line Take Profit line Stop Loss line You can move the lines and you will see R/R and Lots calculation in real time. You can use it to simulate Long and Short positions.
Indicator parameters As input parameters you need to check only the Risk for trade. For e.g. y
FREE

This indicator shows the strength of each currency compared to the US dollar by calculating the rate of change in price over a specified time period. When you open the indicator, you'll see a list of different currencies on the price chart. Each currency will have a numerical value indicating its strength level compared to the US dollar, where: If the value is higher than the US dollar, it will be displayed in green, meaning that currency is stronger than the dollar. If the value is lower than
FREE

Moving Average Dashboard Bars ago is a unique multi currency, multi time frame dashboard. The dashboard is very simple. You select two moving averages, the instruments and timeframes The Moving Average Dashboard Bars ago then shows how how many bars ago the moving averages made a bullish or bearish crossover. It also shows you in real time when there is a bullish or a bearish crossover. The indicator plots in a subwindow. The Moving Average Dashboard Bars ago can be beneficial if you are trading
FREE

Индикатор рисует уровни Фибоначчи с выделенными Ценовыми метками.При установке индикатора на график необходимо создать трендовую линию с именем указанным в поле" Unique name of trend line to place fib on ". По умолчанию имя=" Unique name of trend line to place fib on" = "+" .В индикаторе можно заменить уровни фибоначчи по своему усмотрению.Также меняются цвет,стиль,толщина линий и т. д.
FREE

QuantumAlert RSI Navigator is a free indicator available for MT4/MT5 platforms, its work is to provide "alerts" when the market is inside "overbought and oversold" regions in the form of "buy or sell" signals. This indicator comes with many customization options mentioned in the parameter section below, user can customise these parameters as needful. Join our MQL5 group , where we share important news and updates. You are also welcome to join our private channel as well, contact me for the pri
FREE
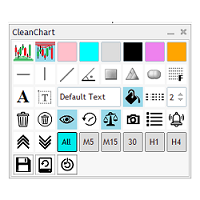
Do you get tired of having a messed up chart with chart objects from various pairs showing up on your current chart? Do you find it boring to have to click multiple clicks to update object colors and styles? Do you want to be able to load a specific set of configurations for your mostly used chart objects? Look no further, CleanChart has it all. 6 customizable Colors User configurable Support and Resistance Colors 10 mostly used chart objects Timeframe visible of any of the objects created Set m
FREE

Simple indicator that shows external ( outside ) bars. In certain cases, external bars can be seen as strong trend bars instead of range bars. This can be observed when a with-trend external bar occurs at a reversal from a strong trend. It will help you notice more easily different patterns like - Inside-outside-inside, Inside- Inside -inside, outside - Inside -outside, etc. Works perfectly with my other free indicators Internal bar and Shadows
Inputs: How many history bars to calculate on l
FREE
MetaTrader市场是独有的自动交易和技术指标商店。
阅读MQL5.community用户备忘更多地了解我们提供给交易者的独特的服务:复制交易信号,自由职业者开发的自定义应用程序,通过支付系统完成的自动付款和MQL5云网络。
您错过了交易机会:
- 免费交易应用程序
- 8,000+信号可供复制
- 探索金融市场的经济新闻
注册
登录