Смотри обучающее видео по маркету на YouTube
Как купить торгового робота или индикатор
Запусти робота на
виртуальном хостинге
виртуальном хостинге
Протестируй индикатор/робота перед покупкой
Хочешь зарабатывать в Маркете?
Как подать продукт, чтобы его покупали
Технические индикаторы для MetaTrader 5 - 6

Исчерпание диапазона происходит, когда цена достигает или превышает ожидаемый диапазон для текущего периода. На этих уровнях цена начинает терять свой импульс по сравнению с более ранним периодом, поэтому стоит убедиться, что вы не открываете новые позиции. Этот индикатор покажет вам, где это может произойти на вашем графике, показывая уровни для дневного, недельного и месячного периодов. Когда вы видите, что цена превышает эти уровни истощения, это говорит вам о том, что импульс, стоящий за дви

This Indicator is based on 4 Exponential Moving Averages ie. 3 EMA-32 (applied to prices close, high & low), and EMA-200 (indicating trend direction). The EMA32-200 produces quality buy and sell entries indicated by arrows and signal alert that appears whenever the price moves above the EMA-200 and returns below the EMA-32s and returns to break above the previous swing high triggering a high probability buy entry. The Sell conditions are the opposite of the buy conditions.
FREE

Индикатор Price Action Finder Multi это индикатор точек входа, который ищет и отображает паттерны системы Price Action сразу на десятках торговых инструментов и на всех стандартных таймфреймах: (m1, m5, m15, m30, H1, H4, D1, Wk, Mn). Найденные паттерны индикатор помещает в таблицу в нижней части экрана. Кликая на названия паттерна в таблице вы можете перемещаться на график, где этот паттерн находится. Инструкция/Мануал ( Обязательно читайте перед приобретением ) | Версия для МТ4 Преимущества
1.

This indicator finds Three Drives patterns. The Three Drives pattern is a 6-point reversal pattern characterised by a series of higher highs or lower lows that complete at a 127% or 161.8% Fibonacci extension. It signals that the market is exhausted and a reversal can happen. [ Installation Guide | Update Guide | Troubleshooting | FAQ | All Products ] Customizable pattern sizes
Customizable colors and sizes
Customizable breakout periods Customizable 1-2-3 and 0-A-B ratios
It implements visua
FREE

Основными функциями индикатора являются определение и маркировка на графиках следующих торговых сигналов по стратегии "Торговый Хаос второе издание": Бычий и медвежий разворотный бар с ангуляцией (скуат "приседающий" включительно). Бары в красной и зеленой зоне в соответствии с цветом гистограммы индикатора Awesome Oscillator. Скуат "приседающие бары" на графике независимо от цвета гистограммы индикатора Awesome Oscillator. Уровни "важных" фракталов относительно "Линии Зубов" индикатора Аллигато

his is a custom indicator based on double-average crossing and arrow marking.
Make multiple lists when blue arrows appear up.
Make a blank list when the red arrow appears down.
When the pink line crosses the green line upwards, the pink line is above, the green line is below, the golden fork appears, and the blue arrow appears.
When the pink line crosses down through the green line, the pink line is below, the green line is above, a dead fork appears, and a red arrow appears.
This is
FREE

This is Heiken Ashi smoothed version, where you can choose on what type smoothness you want to make your strategy base. You can choose between EMA or MA, on the period you want. And you can choose colors.
Definition:
The Heikin-Ashi technique averages price data to create a Japanese candlestick chart that filters out market noise. Heikin-Ashi charts, developed by Munehisa Homma in the 1700s, share some characteristics with standard candlestick charts but differ based on the values used to
FREE

Dark Inversion is an Indicator for intraday trading. This Indicator is based on Counter Trend strategy but use also Volatility. We can enter in good price with this Indicator, in order to follow the inversions on the current instrument. Hey, I made an Expert Advisor based on this indicator, if you are interested: Dark Titan MT5
Key benefits
Easily visible Inversion Lines Intuitive directional arrows Automated adjustment for each timeframe and instrument Easy to use even for beginners Never
FREE

Donchian Channel is an indicator created by Richard Donchian. It is formed by taking the highest high and the lowest low of the last specified period in candles. The area between high and low is the channel for the chosen period.
Its configuration is simple. It is possible to have the average between the upper and lower lines, plus you have alerts when price hits one side. If you have any questions or find any bugs, please contact me. Enjoy!
FREE

Выбирайте лучший инструмент для торговли: Тренды и влияние новостей на курс валютной пары ! В качестве источника новостей можно использовать: Календарь терминала или сайт Investing.com Во втором случае дополнительно потребуется утилита Get News5 .
Индикатор хорошо сочетается с утилитой Trade maker , обеспечивая мультивалютную торговлю. Рассчитывает: индексы влияния актуальных новостей на валютные пары с учетом ожиданий рынка. фактические направления трендов для 5 настраиваемых таймфреймов и ур

Unlock the Power of Market Analysis with Precision Are you ready to take your trading to the next level? The "Institutional Volume Profile" indicator is here to empower your trading decisions like never before. Key Features: Custom Volume Profiles : Plot volume profiles effortlessly by simply adding horizontal lines or Fibonacci tools on your MetaTrader 5 chart. There's no limit to how many profiles you can create. Insightful Visualization : The indicator beautifully displays crucial information

Индикатор использует несколько таймфреймов для анализа лучших входов в покупки во время бума 1000. Он предназначен для торговли только во время пиков бума. индикатор имеет две стрелки; красные и синие. появление красной стрелки указывает на то, что вы должны быть готовы к появлению синей стрелки, которая является сигналом для входа на покупку. Индикатор не предлагает точек выхода. всегда собирайте 3 пипса, т.е. если вы вошли в сделку по цене 10230,200, вы можете выйти на отметке 10260,200 со ст
FREE

BUY INDICATOR AND GET EA FOR FREE AS A BONUS + SOME OTHER GIFTS! ITALO TRIANGLE INDICATOR is the best triangle indicator ever created, and why is that? Using Geometry and Fibonacci the Indicator works on all time-frames and assets, indicator built after 7 years of experience on forex and many other markets. You know many triangle indicators around the internet are not complete, does not help, and it's difficult to trade, but the Italo Triangle Indicator is different , the Italo Triangle Indi

Этот мульти-таймфрейм и мультисимвольный индикатор может определять следующие 5 крестов: когда быстрая скользящая средняя пересекает линию медленной скользящей средней. когда цена достигла единственной скользящей средней (закрылась выше / ниже или просто отскочила). когда образовалась тройная скользящая средняя (все 3 MA: с последовательным выравниванием) когда основная линия MACD пересекает сигнальную линию. когда сигнальная линия пересекает нулевую (0) линию MACD. В сочетании с вашими собствен

RAD CRITICAL LEVES RAD indicator tracks “Relevant Volume” in real time, identifying accumulation and distribution processes, projecting them in the chart as SUPPORT or RESISTANCE zones. Natural support and resistance levels are generated by Volume Accumulation and Distribution processes. As these processes evolve, levels at which the relevant volume in the market place is positioned, become difficult areas to cross upwards or downwards. By using this information, traders can identify very s

This indicator is very useful for day traders or short term traders. (MT5 version) No need to calculate the number of pips manually, just look at the chart and you will see the Virtual Take Profit / Virtual Stop Loss target line and evaluate whether the entry point is feasible to reach the intended target or not.
Enter the intended Take Profit / Stop Loss pips for your trade. The indicator will display Virtual Take Profit / Virtual Stop Loss lines for you to easily see if the target i
FREE
Откройте новое измерение торговли с нашим передовым индикатором MQL5 Range BreakOut MT5.
Этот мощный инструмент предназначен для выявления и извлечения выгоды из движений цен, когда они выходят за пределы установленных диапазонов.
предоставляя вам точность и уверенность, необходимые для процветания в динамичном мире финансовых рынков.
Версия MT4 : WH Range BreakOut MT4
Функции:
Точное определение диапазона. Сигналы прорыва в реальном времени. Настраиваемые параметры. Инструменты упр

Easily get all relevant economic events of the current day right into your chart, as markers. Filter what kind of markers do you want: by country (selected individually) and by Importance (High relevance, Medium, Low or any combination of these). Configure the visual cues to your liking. If there is more than one event set to the very same time, their Names will be stacked and you will see the messages merged with the plus (+) sign on the marker. Obviously that long or too much events on the sam
FREE

The Volume+ and VSA Signals indicator for MT5 is based on the Volume Spread Analysis (VSA) methodology to provide the signals. The signals are displayed at closing of bars on the main window or subwindow in the form of symbols. The symbols are not repainting. The indicator produces a signal on an individual bar and this signal is not buy or sell signal. When a minor trend goes in the opposite direction of a major trend, there are sequences of major trend-following signals that give a higher pro

Закрытие предыдущего дня и смещение баров для MetaTrader! Индикатор Закрытие предыдущего дня и смещение баров - это инструмент, разработанный для улучшения технического анализа и принятия решений в торговле. С помощью этого индикатора вы получите подробную информацию о уровнях открытия, максимума, минимума и закрытия любого бара, что позволит провести точный и всесторонний анализ движения рынка. Представьте себе возможность поместить один таймфрейм в другой, позволяя детально анализировать кажды
FREE

Introduction
WaveTrend Plus is an amazing oscillator that can detect optimal entry points in the market with high precision using complex computations of price and momentum. This version packs many improvements compared to the original WaveTrend such as cleaner visuals, oversold/overbought signals and divergence detection
Signal
Buy when oversold signal appear (green dot below) or when a bullish divergence is detected (green dashed line)
Sell when overbought signal appear (red dot ab
FREE

Meta Trend Indicator is an efficient way to forecast and detect the trend in any market. It reveals the trend, support and resistance levels, volatility and the maximum potential target, all in one indicator. To adapt to the price and to decrease consecutive trend failures, the internal trend detector algorithm studies the market and dynamically chooses the right values for the internal parameters. This indicator is a perfect trend filter for any strategy or expert advisor. Features Super Adapti

Средневзвешенная по объему цена аналогична скользящей средней, за исключением того, что объем включен для взвешивания средней цены за период.
Средневзвешенная по объему цена [VWAP] - это динамическое средневзвешенное значение, предназначенное для более точного отражения истинной средней цены ценной бумаги за определенный период. Математически VWAP - это сумма денег (т. Е. Объем х цена), деленная на общий объем в любой временной интервал, обычно с рынка, открытого для рынка.
VWAP отражает
FREE

Blahtech Fisher Transform indicator is an oscillator that displays overbought and oversold locations on the chart. The Fisher Transform algorithm transforms prices with any distribution shape into a normal distribution. The end result is a curve with sharp turning points that may help to identify bullish or bearish trends. Fisher Transform values exceeding 1.66 on the daily chart are considered to be good areas for reversal trades. Links [ Install | Update | Training | All Products ]
Trend Chart Histogram — индикатор, основанный на алгоритме с использованием двух скользящих средних и нескольких осцилляторов. Благодаря цветовому коду он позволяет быстро определить тенденцию и воспользоваться крупнейшими рыночными импульсами. Светлые цвета указывают на тренд, темные цвета определяют импульсы, а серый указывает на то, что вам не следует входить в рынок.
Версия для МТ4 здесь.
Обратите внимание: индикатор бесплатный до 15 мая. Тогда его цена составит $49. Входные параметры:
FREE

The " YK Find Support And Resistance " indicator is a technical analysis tool used to identify key support and resistance levels on a price chart. Its features and functions are as follows:
1. Displays support and resistance levels using arrow lines and colored bands, with resistance in red and support in green.
2. Can be adjusted to calculate and display results from a specified timeframe using the forced_tf variable. If set to 0, it will use the current timeframe of the chart.
3. Uses
FREE

With this easy to set up indicator you can display and set alerts for the following candlestick formations: Bull Breakout, Bear Breakout, Hammer, Pin, Bullish Engulfing, Bearish Engulfing. Input parameters: ShortArrowColor: The color of the Arrows, displaying a Bearish candle formation LongArrowColor: The color of the Arrows displaying a Bullish candle formation BullishEngulfing: Disabled/Enabled/EnabledwithAlert BearishEngulfing: Disabled/Enabled/EnabledwithAlert Pin: Disabled/Enabled/Enabledw
FREE

Индикатор KPL Swing - это простая система технической торговли следующая за трендом, которая автоматизирует вход и выход. Система работает с твердым стоп-лоссом и следующим стоп-лоссом для выхода с прибыльными сделками. Не даются цели, так как никто не знает, насколько высоко (или низко) может двигаться цена. Следующий стоп-лосс блокирует прибыль и убирает эмоции из торговли. Конвертировано с индикатора Amibroker с модификацией.
Идеально в сочетании с KPL Chart Uptrend & Downtrend
FREE

Defining Range ( DR ) and Implied Defining Range ( IDR ) indicator Pro with added features from free version
Show DR and IDR ranges Sessions on the chart for RDR Regular defining range (New York Session)
ADR After defining range (Asian session) ODR Outside defining range (London Session)
Buttons on chart to enable / disable :
Show Imbalance ( IMB ) Show Volume Imbalance ( VIB ) Show Gap's between open and close
Show Standard Deviation ( SD )
Show last 3 Sessions

Just another Auto Fibonacci Retracement indicator . However, this is the most Flexible & Reliable one you can find for FREE. If you use this indicator and you like it, please leave a review/comment. If you are looking for a more advanced Fibo indicator, check this Free Trend-Based Fibo indicator . ### FEATURES ### Auto-calculate up to 7 Fibonacci levels on your customized frame. Adjust levels as your need. Use High/Low price or Open/Close price to calculate. Freeze the levels and don
FREE

Уровни Central Pivot Range формируются вокруг центральной точки разворота.
Эти уровни по отношению к центральной оси могут использоваться для определения поведения многих рынков и возможных результатов.
Расстояние от центральной точки поворота и цена, которую формируют новые уровни по отношению к уровням предыдущего дня, можно использовать для определения направления и силы тренда следующих дней.
Диапазоны центральных пивот могут выступать в роли поддержки и сопротивления, предлагать орие
FREE

BeST_ Elliot Wave Oscillator Strategies is an MT5 indicator which by default is the difference of two SMAs displayed as a histogram fluctuating around zero while a Signal Line generates Entry Signals either in a Reverse or in a Normal Mode and it is a very powerful tool that very often exploits huge market movements.
Signal Line comes in 2 types:
Advanced Get Type – like the corresponding one used in the homonym analysis package Mov. Average Type – as a Moving Average of the Elliot Oscillat

MT4 Version Available Here: https://www.mql5.com/en/market/product/43555
Telegram Channel & Group : https://t.me/bluedigitsfx
V.I.P Group Access: Send Payment Proof to our Inbox
Recommended Broker: https://eb4.app/BDFXOsprey *All In One System Indicator, Breakthrough solution for any Newbie or Expert Trader! The BlueDigitsFx Easy 123 System makes it easy to identify important areas of market structure. It alerts you to changes in market structure which typically occur when a revers

Готовы ли вы вывести свою торговлю на новый уровень? Представляем WH Divergence Pro MT5 ,
продвинутый индикатор дивергенции, который позволяет вам выбирать из множества популярных технических индикаторов.
Теперь вы можете адаптировать сигналы дивергенции в соответствии с вашей уникальной торговой стратегией. Свяжитесь со мной после покупки, чтобы помочь вам в процессе Ключевая особенность :
Выбор индикатора : выберите предпочитаемый индикатор из следующих вариантов: RSI (индекс от

Original supertrend indicator in Tradingview platform. Indicator type: Price Action indicator Introduction: The Supertrend Indicator - Enhancing Your Trend Analysis. If you haven't yet found a Supertrend indicator with good graphics on the MQL5 platform, this is the indicator for you. Overview: The Supertrend Indicator is a powerful tool designed to provide traders with valuable insights into the current and historical trends of financial markets. It serves as a valuable addition to any t
FREE

Currency Strength Meter - это самый простой способ определить сильные и слабые валюты. Этот индикатор показывает относительную силу 8 основных валют + Золото: AUD, CAD, CHF, EUR, GBP, JPY, NZD, USD, XAU . Символ золота может быть изменен на символ другого инструмента, например такого как XAG, XAU и т.д.
По умолчанию значение силы нормализовано в диапазоне от 0 до 100 для алгоритма RSI: Значение выше 60 означает сильную валюту; Значение ниже 40 означает слабую валюту;
Для работы данного инди

Introduction
The PF Maximizer is a game-changing non-repainting technical tool engineered to help traders distinguish genuine trend signals from erratic market fluctuations. By employing sophisticated algorithms and cutting-edge data analysis, this indicator efficiently filters out unwanted noise, empowering traders to identify the precise starting and ending points of substantial market moves.
Signal
Potential buy signal is generated when moving average is going up and the blue line c
FREE

нестандартный подход к стандартному индикатору скользящей средней. суть индикатора состоит в определение силы и быстроты направление цены определением угла наклона скользящей средней. берется точка на пятнадцатой свечи MA и точка на последней закрытой свече MA, между ними проводится прямая линия, она подвижна и на полусфере показывает угол наклона от 90 градусов до -90. выше 30 градусов зона покупок, ниже -30 градусов зона продаж. выше 60 градусов зона сильных покупок ниже -60 сильных продаж. ин
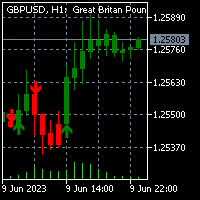
To get access to MT4 version please click here . This is the exact conversion from TradingView: "UT Bot Alerts" by "QuantNomad". This is a light-load processing and non-repaint indicator. Buffers are available for processing in EAs. You can message in private chat for further changes you need. Here is the source code of a simple Expert Advisor operating based on signals from UT Bot Alerts . #include <Trade\Trade.mqh> CTrade trade; int handle_utbot= 0 ; input group "EA Setting" input int magic_

To get access to MT4 version please click here . This is the exact conversion from TradingView: "ZLSMA - Zero Lag LSMA" by "veryfid". This is a light-load processing indicator. This is a non-repaint indicator. Buffers are available for processing in EAs. All input fields are available. You can message in private chat for further changes you need. Thanks for downloading

Introduction The "Ultimate Retest" Indicator stands as the pinnacle of technical analysis made specially for support/resistance or supply/demand traders. By utilizing advanced mathematical computations, this indicator can swiftly and accurately identify the most powerful support and resistance levels where the big players are putting their huge orders and give traders a chance to enter the on the level retest with impeccable timing, thereby enhancing their decision-making and trading outcomes.
FREE

Automatically calculates and displays the pivot point line and support and resistance levels. Pivot can be calculated according to the Classic, Floor, Fibonacci, Woodie, Camarilla or DeMark formula. It is also possible to select the period for calculating the indicator. A trader can choose from daily, weekly, monthly, or user-defined periods. Range-bound traders use pivot points to identify reversal points. They see pivot points as areas where they can place their buy or sell orders.
FREE

This indicator accurately identifies and informs market reversals and continuation patterns by analyzing and signaling the Three White Soldiers / Three Black Crows pattern. It also offers a "real-time backtesting" panel in the indicator itself in a way that every change made on the indicator parameters will immediately show the user how many signals are occurred, how many take profits and stop losses were hit and, by having these informations, the Win Rate and the Profit Factor of the setup b

This indicator shows the TLH and TLL and some trendlines that allow us to estimate the trend of market. It also shows the values of the angles of the lines in percentage in points (pip) , the standard deviation, and the trend of each line, and when it breaks the lines of support and resistance (TLH and TLL). And finally, it also shows the points identified as supports and resistances through the fractal algorithm in the graph. The high and low trend lines are supported by the highs and lows, th
FREE

SUPERTREND ; Это индикатор следования за трендом, основанный на SuperTrend ATR, созданном Оливье Себаном. Его можно использовать для обнаружения изменений в направлении тренда и обнаружения стопов. Когда цена падает ниже кривой индикатора, она становится красной и указывает на нисходящий тренд. И наоборот, когда цена движется выше кривой, индикатор становится зеленым, указывая на восходящий тренд. Как и другие индикаторы, он хорошо работает с SuperTrend в сочетании с другими индикаторами, такими
FREE

AW Super Trend - Это один из наиболее популярных классических трендовых индикаторов. Имеет простую настройку, позволяет работать не только по тренду, но и отображает уровень стоплосса, который рассчитывается данным индикатором. Преимущества:
Инструменты: Валютные пары , акции, сырьевые товары, индексы, криптовалюты. Таймфрейм: М15 и выше. Время торговли: Круглосуточно. Показывает направление текущей тенденции. Ведет расчет стоплосса. Может быть использован при работе с трейдингом. Три т
FREE
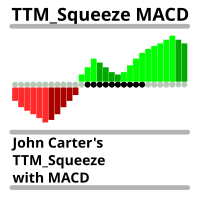
Этот индикатор создан на основе оригинального индикатора TTM_Squeeze Джона Картера и представляет собой "сжатие" рынка, за которым могут последовать (а могут и не последовать) значительные движения. Оригинальный индикатор печатает черные точки, когда полосы Боллинджера находятся внутри каналов Кельтнера, и именно это реализовано в этой пользовательской версии. Вместо оригинальной реализации в качестве индикатора импульса используется индикатор MACD со стандартными настройками 12-26-9. Главным об
FREE

Описание индикатора: MACD EMA Crossover MACD EMA Crossover - это мощный индикатор MetaTrader 5 (MT5), разработанный для генерации торговых сигналов на основе пересечений между индикаторами Moving Average Convergence Divergence (MACD) и Exponential Moving Average (EMA). Этот индикатор помогает трейдерам выявлять подходящие сигналы на покупку и продажу, с особым вниманием к разворотам тренда. Особенности: MACD пересекает нулевую линию (сигнал на покупку): Когда линия MACD пересекает сигнальную ли
FREE

O indicador criado por Didi Aguiar, o mestre das Agulhadas!
O padrão do indicador é o cruzamento de três médias móveis simples. Média rápida, período 3. Média normalizada, período 8. Média lenta, período 20.
Quando as três médias se cruzam próximas o suficiente, acontece a agulhada! Pela posição das médias é possível identificar: Agulhada de compra, agulhada de venda, ponto falso e beijo da mulher aranha.
Quer saber mais? Procure pelo site dos robôs oficiais da Dojistar: tradesystembots.co
FREE

Custom Spread Indicator *Please write a review, thanks!
Also MT4 version is available
Spread Indicator show the current spread in pips with color codes. Handle 3 levels, Low, Medium, High. You can set levels and colors for each level (eg. Low: Green, Medium: Orange, High: Red), and can choose display position on the chart.
There is two spread calculation mode: -> Server spread value -> Ask - Bid value
Can set opacity, for better customization. When spread jump bigger, then display do
FREE

** All Symbols x All Timeframes scan just by pressing scanner button ** *** Contact me immediately after the purchase to send you instructions and add you in "Market Structure group" for sharing or seeing experiences with other users. Introduction: Market structure is important for both new and professional traders since it can influence the liquidity and price action of a market. It’s also one of the most commonly used techniques to understand trends, identify potential reversal points,

Создайте свою стратегию самостоятельно Этот инструмент позволяет вам разрабатывать свои стратегии, используя все доступные индикаторы нативно в MetaTrader и все индикаторы, загруженные из интернета, которые используют буферы для отображения данных на экране. Этот инструмент - еще одна причина рассмотреть MetaTrader для автоматизации ваших торговых стратегий. С его помощью вы можете создавать свои собственные сигналы стратегии простым и интуитивным способом, используя любой индикатор MetaTrader.
FREE

Индикатор находит на графике свечные паттерны на основе книги Грегори Л. Морриса «Японские свечи. Метод анализа акций и фьючерсов». При обнаружении модели индикатор выдает сообщение при закрытии бара. Если вы торгуете с помощью терминала MetaTrader 4, то вы можете скачать полный аналог индикатора " Candle Pattern Finder for MT4 "
Список распознаваемых моделей: Бычья / Медвежья (в скобках возможные настройки параметров) : Молот / Падающая Звезда (с подтверждением / без подтверждения*) Переверну

The Penta-O is a 6-point retracement harmonacci pattern which usually precedes big market movements. Penta-O patterns can expand and repaint quite a bit. To make things easier this indicator implements a twist: it waits for a donchian breakout in the right direction before signaling the trade. The end result is an otherwise repainting indicator with a very reliable trading signal. The donchian breakout period is entered as an input. [ Installation Guide | Update Guide | Troubleshooting | FAQ | A
FREE

Сколько раз вы искали PIVOT, который работает на определенной свече каждый день?
Многие трейдеры любят оценивать направление дневного тренда по определенному времени каждый день, например, через 30 минут после открытия рынка, или в 12 часов дня, и так далее.
Этот индикатор позволяет указать определенное время (час и минуту) и построить разворот от этого времени до следующего дня в то же самое время. Он показывает пять линий, основанных на этой конкретной свече/часе: медиану, максимум, миним
FREE

The Fair Value Gap Detector is a MetaTrader 5 indicator designed to identify and draw rectangles on the chart wherever fair value gaps (FVGs) are detected. Fair value gaps occur when there is a significant disparity between the current price and the fair value of an asset. These gaps can provide valuable insights into potential trading opportunities, as they often indicate overbought or oversold conditions in the market. Key Features: FVG Detection: The indicator utilizes a proprietary algorith
FREE

Индикатор строит трендовый канал по методике Гильберта Раффа. Ось канала представляет собой регрессионную зависимость первого порядка. Верхняя и нижняя линии показывают максимальное расстояние, на которое удалилась цена закрытия интервала от осевой линии. Поэтому верхнюю и нижнюю линии можно считать линиями сопротивления и поддержки соответственно. Аналогичная версия индикатора для терминала МТ4
Как правило, большая часть движений цены происходит в пределах канала, выходя за линию поддержки ил
FREE
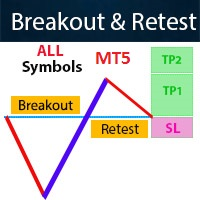
- It is 35$ now - 50% Discount (Real price is 70$) Contact me for instruction, any questions! Introduction The breakout and retest strategy is traded support and resistance levels. it involves price breaking through a previous level. The strategy is designed to help traders do two main things, the first is to avoid false breakouts. Many false breakouts start with a candlestick that breaks out of a level but ends with an immediate candlestick that brings the price back into the level. The secon
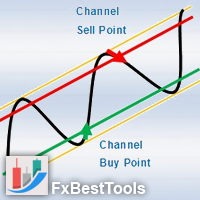
Channels Indicator is an All-In-One Indicator with a powerful calculation engine. The Indicator contains 4 different and usual methods for finding channels on the market. Indicator is powered by a visual interface and with various selections of alerts and notifications.
Testing Indicator : Strategy Tester does not respond to your clicks on panels (This is metatrader tester limitation). Thus input your desired settings on the indicator pre-settings and test.
Using Indicator :
Display

"Индикатор "BIG FIGURE INDICATOR" автоматически идентифицирует и рисует горизонтальные линии на графиках цен на определенных уровнях, таких как целые числа или половинные числа (например, 1,0000 или 1,5000 в валютной торговле). Эти уровни считаются психологически значимыми, поскольку они представляют собой округленные цифры, на которые могут сосредоточиться крупные трейдеры и инвесторы, что может привести к потенциальным уровням поддержки или сопротивления. Этот индикатор может помочь трейдерам
FREE

Познакомьтесь с мощью индикатора Demark Trends для всестороннего анализа трендов и получения торговых идей. Индикаторы Demark славятся своей эффективностью в оценке рыночных трендов и точек истощения. Наш индикатор Demark Trends переносит этот опыт на новый уровень, автоматически рисуя точные линии тренда на вашем графике. С настраиваемыми параметрами, включая количество свечей в расчетах, настройки сигнала и цвета линий, у вас полный контроль над вашим анализом. Независимо от того, являетесь ли
FREE

本指标 基于 Zigzag 基础上... 增加了: 1.增加了箭头指示,使图表更鲜明 2.增加了价格显示,使大家更清楚的看清价格. 3.增加了报警等设置,可以支持邮件发送 原指标特性: 1.基本的波段指标构型. 2.最近的2个ZIGZAG点不具有稳定性,随着行情而改变,(就是网友所说的未来函数) 3.原指标适合分析历史拐点,波段特性,对于价格波动有一定的指导性.
Zigzag的使用方法一 丈量一段行情的起点和终点 (1)用ZigZag标注的折点作为起点和终点之后,行情的走势方向就被确立了(空头趋势); (2)根据道氏理论的逻辑,行情会按照波峰浪谷的锯齿形运行,行情确立之后会走回撤行情,回撤的过程中ZigZag会再次形成折点,就是回撤点; (3)在回撤点选择机会进场,等待行情再次启动,止损可以放到回撤的高点。 一套交易系统基本的框架就建立起来了。 Zigzag的使用方法二 作为画趋势线的连接点 趋势线是很常见的技术指标,在技术分析中被广泛地使用。 但一直以来趋势线在实战中都存在一个BUG,那就是难以保证划线的一致性。 在图表上有很多的高低点,到底该连接哪一个呢?不同的书上画趋势线的方
FREE

Magic Candles это новый продукт, который позволяет идентифицировать текущую рыночную фазу (восходящий тренд, нисходящий тренд или флет). Данный индикатор раскрашивает бары в разные цвета в зависимости от текущего состояния рынка и сигнализирует пользователю о смене тенденции с помощью алерта. Magic Candles прекрасно подойдет для торговли валютами (в том числе и криптовалютами) и бинарными опционами.
Преимущества Подходит для скальпинга и торговли внутри дня. Отсутствует перерисовка (пересч

Moving Average Trend Alert is a triple MA indicator that helps traders to identify potential market trends based on 3 MAs alignment and crossover.
Moving Average Trend Alert features: Customizable short-term, medium-term, and long-term MAs. Option to filter signals based on a minimum distance between moving averages to avoid premature MAs alignment. Optional Filter of signals with RSI indicator overbought/oversold levels. Optional Filter of signals with ADX indicator. Popup, email, and phone n
FREE
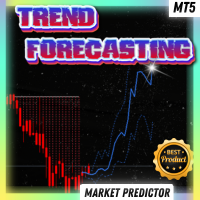
This indicator is unstoppable when combined with our other indicator called Katana . After purchase, send us a message and you could get Katana for FREE as a BONUS!
PROMO FOR THE MT5 version: $55 for a very limited time! Next price is $105. The Trend Forecasting indicator is a very unique & easy tool that is able to make prediction about future price movement based on the signals generated by MACD. It helps you have an estimation on the areas that the price may develop in

This indicator draw a line on high and low levels of X number of days. It is possible to have an alert (in the software and mobile app) for when the price breaks the high or low of the current day. Configurações: Days - past days to calculate (1 = actual day only).
Alert when reach levels - activate the alert for specific levels or both.
Push notification - enable the alert to the mobile MT5 app.
Appearance
High - high level color.
Low - low level color.
Size actual day - thi
FREE

** All Symbols x All Timeframes scan just by pressing scanner button ** *** Contact me after the purchase to send you instructions and add you in "Head & Shoulders Scanner group" for sharing or seeing experiences with other users. Introduction: Head and Shoulders Pattern is a very repetitive common type of price reversal patterns. The pattern appears on all time frames and can be used by all types of traders and investors. The Head and Shoulders Scanner indicator Scans All char

Description :
The "Market Structure HH HL LH LL" indicator is a powerful and at the same time simple tool for analyzing price dynamics in financial markets. This indicator helps traders and investors identify changes in trends and identify important points in price time series. Displays "BOS" and "CHoCH" lines.
Key components of the indicator:
HH (Higher High): The top at which the price closes above the previous high top. HH indicates a strengthening uptrend. HL (Higher Low): The minim

The trend indicator " Super Trend Flexible Alert " has a minimum of settings. This indicator is designed to be as easy to use as possible. The indicator shows the trend with a main colored line ("SuperTrend" line, which you can see in the "Data Windows" window). Also, in places where the trend changes, the indicator shows colored arrows ( "STBuy" and " STSell" icons, which you can see in the "Data Windows" window ). In places where the trend changes, the indicator doesn't give a s

Necessary for traders: tools and indicators Waves automatically calculate indicators, channel trend trading Perfect trend-wave automatic calculation channel calculation , MT4 Perfect trend-wave automatic calculation channel calculation , MT5 Local Trading copying Easy And Fast Copy , MT4 Easy And Fast Copy , MT5 Local Trading copying For DEMO Easy And Fast Copy , MT4 DEMO Easy And Fast Copy , MT5 DEMO MACD называется скользящей средней конвергенции и расхождения, которая создается на основе дво
FREE
MetaTrader Маркет - единственный магазин, где можно скачать демоверсию торгового робота и подвергнуть его проверке и даже оптимизации на исторических данных.
Прочитайте описание и отзывы других покупателей на заинтересовавший вас продукт, скачайте его прямо в терминал и узнайте, как протестировать торгового робота перед покупкой. Только у нас вы можете получить представление о программе, не заплатив за неё.
Вы упускаете торговые возможности:
- Бесплатные приложения для трейдинга
- 8 000+ сигналов для копирования
- Экономические новости для анализа финансовых рынков
Регистрация
Вход
Если у вас нет учетной записи, зарегистрируйтесь
Для авторизации и пользования сайтом MQL5.com необходимо разрешить использование файлов Сookie.
Пожалуйста, включите в вашем браузере данную настройку, иначе вы не сможете авторизоваться.