Смотри обучающее видео по маркету на YouTube
Как купить торгового робота или индикатор
Запусти робота на
виртуальном хостинге
виртуальном хостинге
Протестируй индикатор/робота перед покупкой
Хочешь зарабатывать в Маркете?
Как подать продукт, чтобы его покупали
Технические индикаторы для MetaTrader 5 - 4

BUY INDICATOR AND GET EA FOR FREE AS A BONUS + SOME OTHER GIFTS! ITALO LEVELS INDICATOR is the best levels indicator ever created, and why is that? Using high volume zones on the market and Fibonacci the Indicator works on all time-frames and assets, indicator built after 7 years of experience on forex and many other markets. You know many levels indicators around the internet are not complete, does not help, and it's difficult to trade, but the Italo Levels Indicator is different , the Ital

Мультитаймфреймовый индикатор ZigZag. Отображает линии поддержки/сопротивления и их пробитие, а также рисует текущие цели рынка. Также могут быть отображены линии индикатора Фракталы, и свечи с других таймфреймов (до Квартала включительно).
Индикатор перерисовывает последнюю (текущую) точку, а в некоторых случаях может изменить последние 2-3 точки.
Все линии рисуются объектами (не индикаторными буферами, но есть возможность получать данные для ЕА ). При использовании в советнике, вы можете

Скринер поддержки и сопротивления находится в одном индикаторе уровня для MetaTrader, который предоставляет несколько инструментов внутри одного индикатора. Доступные инструменты: 1. Скринер структуры рынка. 2. Зона бычьего отката. 3. Зона медвежьего отката. 4. Ежедневные опорные точки 5. еженедельные опорные точки 6. ежемесячные опорные точки 7. Сильные поддержка и сопротивление, основанные на гармоническом паттерне и объеме. 8. Зоны уровня берега. ПРЕДЛОЖЕНИЕ ОГРАНИЧЕННОЕ ВРЕМЯ: Индикатор подд

Introduction
Reversal Candles is a cutting-edge non-repainting forex indicator designed to predict price reversals with remarkable accuracy through a sophisticated combination of signals.
Signal Buy when the last closed candle has a darker color (customizable) and an up arrow is painted below it Sell when the last closed candle has a darker color (customizable) and a down arrow is painted above it
FREE

Dark Absolute Trend is an Indicator for intraday trading. This Indicator is based on Trend Following strategy but use also candlestick patterns and Volatility. We can enter in good price with this Indicator, in order to follow the main trend on the current instrument. It is advised to use low spread ECN brokers. This Indicator does Not repaint and N ot lag . Recommended timeframes are M5, M15 and H1. Recommended working pairs: All. I nstallation and Update Guide - Troubleshooting

Добро пожаловать в наш паттерн ценовой волны MT5 --(паттерн ABCD)-- Паттерн ABCD является мощным и широко используемым торговым паттерном в мире технического анализа.
Это гармонический ценовой паттерн, который трейдеры используют для определения потенциальных возможностей покупки и продажи на рынке.
С помощью паттерна ABCD трейдеры могут предвидеть потенциальное движение цены и принимать обоснованные решения о том, когда открывать и закрывать сделки. Версия советника: Price Wave EA MT
FREE

** All Symbols x All Timeframes scan just by pressing scanner button ** *** Contact me after the purchase to send you instructions and add you in "M W Scanner group" for sharing or seeing experiences with other users. Introduction: Double Top(M) and Double Bottom(W) is a very repetitive common type of price reversal patterns. Double Top resembles M pattern and indicates bearish reversal whereas Double Bottom resembles W pattern and indicates a bullish reversal that they have high win r

Успех или неудача при торговле на рынке Форекс по большей части зависит от управления капиталом. Как известно, открытие каждой сделки сопряжено с риском потери денег. Именно поэтому так важно контролировать риск.
Использование соотношения риска к прибыли в торговле При помощи Risk Reward Ratio для MetaTrader вы сможете оценивать риск каждой сделки, открытой на валютном рынке. Благодаря этому инструменту вы сможете проверить соотношение риска к прибыли у каждой запланированной сделки и точно оц

A top-quality implementation of the famous Super Trend indicator, which needs no introduction. It is completely loyal to the original algorithm, and implements many other useful features such as a multi-timeframe dashboard. [ Installation Guide | Update Guide | Troubleshooting | FAQ | All Products ] Easy to trade It implements alerts of all kinds It implements a multi-timeframe dashboard It is non-repainting and non-backpainting Input Parameters
ATR Period - This is the average true range per
FREE

Classic MACD
It has MACD line, Signal line, and Histogram . The Histogram has 4 colors , showing its movement direction as simple as possible. The smoothing factor in the input helps to eliminate noisy signals. Besides different price types (hlc, hlcc, ohlc, ...), there is an option to use volume data as the source for MACD calculations (which is better to be used by real volume not unreliable tick volume). While the original MACD indicator uses Exponential Moving Average, this indicator provid
FREE

This indicator plots the volume profile by Price on the chart
There are 5 ways to view it:
By Total Volume Traded; Volume Ticks(Forex) Separated by Buyers and Sellers; Buyers Only; Sellers Only and; Business balance (Buyers - Sellers).
It is possible to select how many days the profiles will be calculated.
On the current day it recalculates the histogram data for each new candlestick.
Another feature is to select the highest trading range by entering the desired percentage.
Th
FREE

A personal implementation of the famous Bollinger bands indicator as a trend following mechanism, which uses a moving average and the standard deviation to define what a trend is and when it changes. Bollinger bands are usually used as an oversold/overbought indicator only, but in my opinion, the trading approach is more complete using the trend variant as an exit strategy. [ Installation Guide | Update Guide | Troubleshooting | FAQ | All Products ] Easy to trade Customizable colors and sizes I
FREE

The market price usually falls between the borders of the channel .
If the price is out of range , it is a trading signal or trading opportunity .
Basically , Fit Channel can be used to help determine overbought and oversold conditions in the market. When the market price is close to the upper limit, the market is considered overbought (sell zone). Conversely, when the market price is close to the bottom range, the market is considered oversold (buy zone).
However, the research can b

Elliot Waves Analyzer Pro calculates Elliot Waves to Help Identify Trend direction and Entry Levels. Mainly for Swing Trading Strategies. Usually one would open a Position in trend direction for Wave 3 or a Correction for Wave C . This Indicator draws Target Levels for the current and next wave. Most important Rules for Elliot Wave Analysis are verified by the Indicator. The Pro version analyzes Multiple Timeframes and shows the Subwaves and Target-Levels. For an Overview " Elliot Waves Anal

MACD divergence indicator finds divergences between price chart and MACD indicator and informs you with alerts (popup, mobile notification or email) . Its main use is to find trend reversals in the chart. Always use the divergence indicators with other technical assets like support resistance zones, candlestick patterns and price action to have a higher possibility to find trend reversals. Three confirmation type for MACD divergences: MACD line cross zero level Price returns to previous H/L Crea
FREE

Simplify your trading experience with Trend Signals Professional indicator. Easy trend recognition. Precise market enter and exit signals. Bollinger Bands trend confirmation support. ATR-based trend confirmation support. (By default this option is OFF to keep interface clean. You can turn it ON in indicator settings.) Easy to spot flat market conditions with ATR-based trend confirmation lines. Highly customizable settings. Fast and responsive. Note: Do not confuse ATR-based trend confirmation
FREE

Royal Wave is a Trend-Power oscillator which has been programmed to locate and signal low-risk entry and exit zones. Its core algorithm statistically analyzes the market and generates trading signals for overbought, oversold and low volatile areas. By using a well-designed alerting system, this indicator makes it easier to make proper decisions regarding where to enter and where to exit trades. Features Trend-Power Algorithm Low risk Entry Zones and Exit Zones Predictions for Overbought and Over

Индикатор идеального входа
Это индикатор, который показывает нам тренд и наилучшие возможные входы, всегда в пользу тренда.
Характеристики: - Различайте как направление тренда, так и его силу, показывая линию разного цвета в зависимости от того, является ли тренд сильным бычьим, слабым бычьим, сильным медвежьим или слабым медвежьим. - Показывает область с лучшим входом в пользу тренда. Никогда больше не торгуйте против тренда. - Когда цена находится в допустимой зоне, он отправляет всплываю

The Heikin Ashi Delta PRO leverages the refined elegance of Heikin Ashi candlesticks, renowned for their ability to filter market noise and highlight clearer trends and reversals. Building on a solid foundation, this advanced indicator integrates the Hull Moving Average method, enhancing its precision and responsiveness. Alongside an intuitive alert system, it transforms raw market data into actionable trading insights, empowering traders to make more informed decisions swiftly. Learn more about

Принцип построения - поверх любого количество баров установленного пользователем строится канал с линиями максимума и минимума таким образом, чтобы бары касались максимума и минимума канала не более и не менее чем в трех точках. Из этого принципа следует название индикатора. Обе вертикальные линии могут перемещаться по графику пользователем, таким образом задавая период, на котором строится канал. После заданного периода рисуются лучи канала, которые задают канал, в котором может двигаться цена

Created by trader and journalist Larry Williams, Setup 9.1 is a simple strategy that is easy to understand and execute, which is why it is so well known and popular in the world of traders and technical analysis. It is a REVERSION setup, where operations are sought when the moving average changes direction.
Setup Logic
With the open candlestick chart, at any time chart, it is only necessary to add the 9-period Exponential Moving Average (MME9). That done, we look for assets in which the MME

--- StudentK Sync Chart --- 1. Move charts at the same time 2. Cross check among different Symbols and Timeframes 3. Plan your own trading strategies
--- Context --- StudentK is not indicated as a master or K Sir for knowledgeable person who claims for winning all the time. (But lots of traders should know the fact that it is rarely truth, especially in fluctuated period of time)
StudentK is a group of years-experienced traders who want to share amazing tools in Free and Paid versions. Aimi

Automatic fibonacci with alerts is an indicator that automatically plots a fibonacci retracement based on the number of bars you select on the BarsToScan setting in the indicator. The fibonacci is automatically updated in real time as new highest and lowest values appear amongst the selected bars. You can select which level values to be displayed in the indicator settings. You can also select the color of the levels thus enabling the trader to be able to attach the indicator several times with d
MT5. Определяет торговые каналы и флет актуальные на текущий момент. Принцип построения канала основан на волновой теории поведения цены. Индивидуальная разработка. Канал можно рассматривать как тренд. С закрашенным фоном это основные импульсные каналы. Коррекционные каналы без фона. Границы пробитых каналов выделены трендовыми линиями. Они будут являться линиями поддержки и сопротивления. Это не стандартные каналы. Они вычисляются по новому принципу. В алгоритм заложена закономерность пове

Note: EA included, download here <----- Trap Play refers to a market situation where price initially makes a new high or low, luring traders into believing a strong trend is forming. However, the price quickly reverses and invalidates the breakout, trapping those traders who entered positions based on the initial move. This sudden reversal often results in a rapid exit of positions, leading to significant price movement in the opposite direction. Trap plays can occur in various financial mar

KT XMaster Formula is a buy & sell signal indicator that works magically on most of the timeframes and currency pairs when used correctly.
The indicator uses calculations based on moving averages, RSI, and MACD. It is usually appropriate for scalping and trend trading - whether you are a novice or an experienced trader, the signals generated by this indicator are simple to understand and implement.
Overview The indicator comprises green and red dots arranged in wavy lines. These dots corre
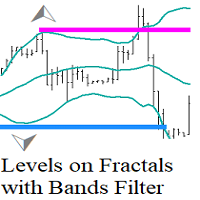
Levels on Fractals with Bands Filter - это уровни на основе фракталов отфильтрованные с помощью индикатора Bollinger Bands. Индикатор уровней, основанный на фракталах Билла Вильямса, отфильтрованных с помощью Линий Боллинджера, представляет собой инструмент технического анализа, который использует комбинацию фракталов и индикатора Боллинджера для определения уровней поддержки и сопротивления. Как использовать?
Когда фрактал образуется за внешней лентой Боллинджера (пробой волатильности) эт
FREE

Candle Counter - это индикатор, который печатает количество свечей от первой свечи дня. Первая свеча дня будет иметь номер 1, и каждая новая свеча будет увеличиваться на 1 в этом подсчете.
Входные параметры Выберите четное, нечетное или все Расстояние от свечи до печати числа Размер шрифта текста Цвет шрифта текста
Если у вас остались вопросы, свяжитесь со мной в прямом сообщении: https://www.mql5.com/ru/users/robsjunqueira/
FREE

Тем, кто изучил книги Билла Вильямса "Новые измерения в биржевой торговле" и "Торговый Хаос (второе издание)" и пробовал торговать по этим методикам, становится ясно, что стандартного набора индикаторов недостаточно для полноценной работы. Индикатор Trading Chaos Map рисует "карту рынка", позволяя вам видеть графики так же, как автор трилогии. В параметрах предусмотрены опции включения и отключения каждого сигнала. Вы можете использовать ту или иную методику, либо использовать их вместе. Может

MACD (short for Moving Average Convergence/Divergence) is one of the most famous and oldest indicators ever created and is widely used among beginners . However, there is a newer version of the MACD that is named Impulse MACD which have less false signals than the standard MACD. Classic MACD helps us to identify potential trends by displaying crossovers between two lines. If MACD line crosses above the Signal line it shows us that the market is potentially up trending and that

Популярный индикатор "Супертренд" - это инструмент технического анализа, который помогает определить направление тренда и возможные точки входа или выхода на финансовых рынках. Индикатор основан на среднем истинном диапазоне (ATR), который измеряет волатильность рынка на основе ценовых диапазонов. Он бесплатен на других платформах, и нет никакой причины, почему бы это не было и здесь! Его обычно используют тремя способами: Для определения текущего тренда: когда цена выше этой линии, это считаетс
FREE
Добро пожаловать в индикатор распознавания образов Advanced Gartley Этот индикатор обнаруживает паттерн Гартли на основе HH и LL ценовой структуры и уровней Фибоначчи, и при достижении определенных уровней Фибо индикатор отображает паттерн на графике. Версия MT4: WH Advanced Gartley Pattern MT4 **Этот индикатор является частью комбо Ultimate Harmonic Patterns MT5 , который включает в себя все функции распознавания образов.**
Функции : Расширенный алгоритм обнаружения паттерна Гартли с в
FREE

Индикатор Price Action Finder это индикатор точек входа, который предназначен для поиска и отображения паттернов системы Price Action на графике цены. Индикатор оснащён системой трендовых фильтров, а также системой алертов и пуш уведомлений. Инструкция/Мануал ( Обязательно читайте перед приобретением ) | Версия для МТ4 Преимущества
1. Паттерны: Пин бар, Внешний бар, Внутренний бар, PPR, Бар силы, Повешенный, Перевёрнутый молот
2. Система фильтрации паттернов. Убирает с графика контртрендовые п

Модифицированный осциллятор MACD. Классический индикатор, соединяющий в себе трендовый индикатор с осциллятором для обнаружения точек входа. Имеет мультитаймфреймовую панель, а также 3 типа уведомлений
Преимущества:
Работает на всех инструментах и таймсериях Трендовый индикатор с осциллятором для входов Мультипериодная панель на всех таймфреймах Подключаемые стрелки при появлении сигналов Три типа уведомлений: push, email, alert
MT4 версия -> ЗДЕСЬ / Наши новости -> ЗДЕСЬ
Как работат
FREE
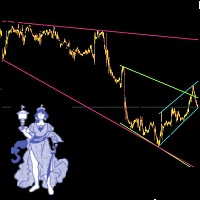
Leave a comment if you would like me to write an EA to trade these trendlines... if enough interest, will write an EA. Automatic Trendlines, updated automatically. To Set up 3 different (or mroe) Trendlines on chart, simply load the indicator as many times and name it differntly.. the example in the picture below is indicator 1 (loaded 1st time): Name: Long, StartBar: 50, BarCount: 500, Color: Pink indicator 2 (loaded 2nd time): Name: Short, StartBar: 20, BarCount: 200, Color: Green indicator 3
FREE

If you want to find good trading opportunities, then you must trade near the Trend Line. This allows you to have a tighter stop loss on your trades — which improves your risk to reward . But that’s not all… Because if you combine Trend Line with Support and Resistance, that’s where you find the best trading opportunities. Now you might wonder: “So when do I enter a trade?” Well, you can use reversal candlestick patterns (like the Hammer, Bullish Engulfing, etc.) as your e

Индикатор строит трехпериодный семафор и фигуру разворота 123 от экстремума. Сигнал приходит на открытии второй свечи. По этому паттерну можно торговать разными способами (тест точки 3, пробой и другие). Выход из канала или пробой трендовой - это главный триггер для поиска точки входа. Значки окрашены в соответствии с уровнями Фибоначчи. Желтые значки указывают на тест уровня, при котором сигнал усиливается. Используя мультивалютную панель инструментов, вы можете отслеживать, на каких валютных

MT4 Version Wave Trend MT5 Wave Trend is an oscillator, which helps identifing in a extremely accurate manner market reversals. The Oscillator being obove the overbought level and a cross down of the fast into the slow MA usually indicates a good SELL signal. If the oscillators is below the oversold level and the fast MA crosses over the slower MA usually highlights a good BUY signal. The Wave Trend indicator can be also used when divergences appear against the price, indicating the current move

- 50% off - Telegram group : https://t.me/+5RIceImV_OJmNDA0 MT4 version : https://www.mql5.com/en/market/product/84526?source=Unknown%3Ahttps%3A%2F%2Fwww.mql5.com%2Fen%2Fmarket%2Fmy
Master Pullback is a complete system that gives unique trading opportunities and a clear indication of the market: trend, signals as well as stop loss and take profit levels. This system has been designed to be as simple as possible and detects extreme overbought and oversold zones, support and resistance levels, a

Cybertrade Auto Fibonacci retraction and projection - MT5
##### Free indicator for an indefinite period. ##### Auto Fibonacci is an indicator that automatically plots the Fibonacci retracement and projection based on the number of bars you select in the indicator setting. You can customize nine different levels of retraction and three levels of projection. It works on periods longer than the period visible on the chart. All values are available in the form of buffers to simplify possible au
FREE
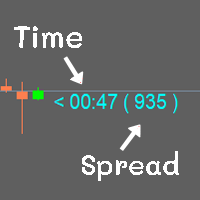
Show the time of candlesticks and spread. All data will be displayed in a rod. Can change color Can fix the size as needed
MT4 : Link https://www.mql5.com/en/market/product/102742 MT5 : Link https://www.mql5.com/en/market/product/102834
Most free code on various websites I didn't write it myself. I only do a little bit.
If you like it, please give 5 stars with it. Thank you.
FREE

Golden Star MT5 - это профессиональный трендовый индикатор для платформы MT5, разработанный группой профессиональных трейдеров. В основе алгоритма его работы - оригинальный авторский метод, позволяющий с высокой вероятностью находить потенциальные точки разворота тенденции и получать сигналы на вход в рынок в начале формирования тренда. Этот индикатор подойдет для работы на золоте, криптовалюте и валютными парами на Forex. Система оповещений (алерт, уведомления на почту и мобильный телефон) пом

Dark Breakout is an Indicator for intraday trading. This Indicator is based on Trend Following strategy, providing an entry signal on the breakout. The signal is provided by the arrow, which confirms the breaking of the level. We can enter in good price with this Indicator, in order to follow the main trend on the current instrument. It is advised to use low spread ECN brokers. This Indicator does Not repaint and N ot lag . Recommended timeframes are M5, M15 and H1. Recommended working pairs

Этот индикатор предназначен для более быстрого и легкого просмотра множества графиков в разных временных масштабах. Отслеживание времени и цены на нескольких графиках Измените символ на одном графике, и все остальные графики того же символа также будут изменены. Простота в использовании, быстрое освоение Индикатор позволяет определить цену и время, когда указатель мыши находится на текущем графике, на всех других графиках, открытых на том же символе. Это позволяет быстро просматривать информацию

Fractal Advanced - отображает индикаторы Fractal и Alligator на графике цены. Обладает широкими возможностями настроек и кастомизации. Также оснащён алертами и системой горячих клавиш.
Инструкция/Мануал ( Обязательно читайте перед приобретением ) | Версия для МТ4
Преимущества
1. Индикатор не забивает весь график фракталами, а позволяет отображать только актуальные сигналы.
2. Регулировка количества фракталов осуществляется при помощи скролла мыши с зажатой клавишей Shift.
3. Мгновенное ото

Скользящая средняя Хала (HMA) пользуется заслуженной популярностью у трейдеров из-за эффективного сглаживания рыночных шумов и относительно небольшого запаздывания. Данная реализация индикатора для MetaTrader 5 меняет цвет при смене направления движения, может давать звуковой и текстовый сигнал. Также поддерживается отправка сообщений на электронную почту и push-сообщений на мобильные устройства. Есть возможность подачи сигнала на текущем незакрытом баре, однако этот сигнал может отмениться до з
FREE

The worktime indicator helps you identify the most important times to day to trade the currency pairs. It was created based on the ICT day trading free tutorials that are freely vailable on his youtube channel. You can use this indicator together with my other indicators that i have shared freely with you like the true day, custom periods, daily month, weekly open lines - they together complement each other very well.
Nuggets from this indicator: 1. Draws the asian session box showinng you th
FREE

Это простой индикатор VWAP, но мы добавили в него оповещения, чтобы вы знали, когда цена касается простого VWAP или пересекает его. Этот индикатор представляет собой традиционный индикатор VWAP для MetaTrader 5 (MT5). Стандартные параметры такие же, как у обычного VWAP, но у вас есть возможность использовать новые расчеты и лучшее: Когда цена касается или пересекает VWAP, вы узнаете об этом через оповещения, уведомления на мобильном телефоне, электронную почту или звуковые события. бесплатный ин
FREE

FXC iRSI-DivergencE MT5 Indicator
This is an advanced RSI indicator that finds trend-turn divergences on the current symbol. The indicator detects divergence between the RSI and the price movements as a strong trend-turn pattern.
Main features: Advanced divergence settings
Price based on Close, Open or High/Low prices Give Buy/Sell open signals PUSH notifications
E-mail sending Pop-up alert Customizeable Information panel Input parameters: RSI Period: The Period size of the RSI indicator.
R

Индикатор Renko Chart позволяет отображать графики "ренко" в окне индикатора. Тип графиков "ренко" показывает лишь движения цены, большие заданного (box size). Он помогает устранить шум и сосредоточиться на основных трендах.
При построении графика время не учитывается, используются лишь ценовые движения. По этой причине графики "Ренко" не похожи на графики цены.
Индикатор работает в 2 режимах: CLOSE - при построении графика "ренко" используются только цены Close; HIGH_LOW - при построении граф
FREE

Этот индикатор находит и отображает фигуры технического анализа "Двойное дно" и "Двойная вершина". Сигнализирует (выводит сообщение на экран), если фигура была сформирована недавно. Часто после появления этих паттернов, тренд поворачивает обратно или происходит коррекция. Чтобы не искать их самостоятельно, или не пропустить их появления, достаточно добавить индикатор на график. Индикатор можно использовать на разных таймфреймах и валютных парах, есть настройки для лучшего поиска на определённой
FREE

Индикатор Magic Histogram MT5 универсальный инструмент, подходящий для скальпинга и среднесрочной торговли. Этот индикатор использует инновационную формулу и позволяет определить направление и силу тренда. Magic Histogram MT5 не перерисовываться, что позволяет оценить его эффектность на истории. Лучше всего использовать на таймфреймах: M15, M30, H1, H4. Версия Magic Histogram для терминала MetaTrader 4: https://www.mql5.com/ru/market/product/23610
Преимущества индикатора Отличные сиг

The Expert Advisor for this Indicator can be found here: https://www.mql5.com/en/market/product/115445 The Break of Structure (BoS) and Change of Character indicator is a powerful tool designed to identify key turning points in price movements on financial charts. By analyzing price action, this indicator highlights instances where the market shifts from a trend to a potential reversal or consolidation phase.
Utilizing sophisticated algorithms, the indicator identifies breakouts where the str
FREE
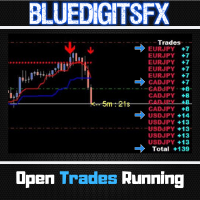
MT4 Version Available Here: https://www.mql5.com/en/market/product/43528
Telegram Channel & Group : https://t.me/bluedigitsfx
V.I.P Group Access: Send Payment Proof of any of our Paid Products to our Inbox
Recommended Broker: https://eb4.app/BDFXOsprey * The Most Sought After Pip Counter for Metatrader ! Features
Will show Currency Symbol in BLUE for Buy positions. Will show Currency Symbol in RED for Sell positions. Will Show pips in BLUE Color for Positive Pips Will Show pips in
FREE

Do you know VWAP Bands? It is an indicator used to identify support and resistance points from the daily VWAP and you can use it to check the best entry and exit points. This indicator does not use the principle of bollinger bands. There is a difference in the calculation method. Use it according to your strategy. See the applications and what results you can get. The indicator is free and can be used on any account.
FREE

Счетчик свечей Этот индикатор подсчитывает и выводит на экран числа свечей на основе большего таймфрейма Длительный период времени Вы можете выбрать дневной таймфрейм как " Большой таймфрейм " и запустить его на любом меньшем графике. что счетчик будет считать бары на основе дневного графика . Если вы передадите в качестве параметра таймфрейм " H1 ", то индикатор будет знать, как считать бары внутри графика H1, вам просто нужно запустить его на меньшем диаграммы. Основным параметром является " Б
FREE
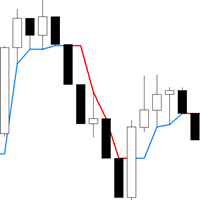
Trend following indicator to assist you in trend trading , analysis or risk management. Non Repainting and works on all timeframes. Robust alert system Benefits: Never redraws the results, the signal is strictly at the close of the candle It can be used in an adviser A great addition to a trading strategy or an independent strategy Market noise filtering algorithm Suitable for any tools Why chose for MetaTrader 5 : Enhanced Precision : Utilize accurate trend analysis to enhance your trading dec
FREE

Индикатор "Sniper MACD" представляет собой улучшенную версию классического индикатора MACD, оптимизированную с использованием нескольких методов для достижения максимальной эффективности торговли. Этот индикатор обладает дополнительной фильтрацией и несколькими уровнями сглаживания, что позволяет получить более точные сигналы. Особенности: Дополнительная фильтрация: Внедрена дополнительная фильтрация для улучшения качества сигналов, что помогает избежать ложных сигналов и повышает точность прог
FREE

Introduction
The Bounce Zone indicator is a cutting-edge non-repainting technical tool built to identify key areas on the price chart where market sentiment is likely to cause a significant price reversal. Using advanced algorithms and historical price data analysis, this indicator pinpoints potential bounce zones. Combined with other entry signal, this indicator can help forex traders place the best trades possible
Signal
A possible buy signal is generated when price is in the green zo
FREE

The first currency based indicator to draw a distinction between map and strength. The map shows the currencies in terms of oversold/overbought levels and gives the direction of travel. The currency strength calculates and shows the strength of that move. Alerts are included for changes in currency direction on the map (confirmed over two bars) and also when the strength reached the appropriate level. The currency map is useful for finding currency pairs to trade and in which direction. Look fo

Индикатор ищет консолидацию(флэт) на рынке в определенное время, строит коробку-канал и отмечает уровни с отступом от него на пробой. После пересечения одного из уровней индикатор отмечает зону для тейкпрофита и считает соответствующий профит или убыток в направлении данного входа на панели. Таким образом, индикатор, подстраиваясь под рынок, находит флэтовый участок с началом трендового движения для входа в него. Версия для MT4: https://www.mql5.com/ru/market/product/57466 Преимущества:
уникал
FREE

Volume Weighted Average Price (VWAP) The volume weighted average price (VWAP) is a trading benchmark used by traders that gives the average price a security has traded at throughout the day, based on both volume and price. It is important because it provides traders with insight into both the trend and value of a security. This indicator VWAP V2 is free and is the manual version of the extended Easy VWAP indicator (30 Euro), where the date and time properties are automatically entered. Wit
FREE

"Hunttern harmonic pattern finder" base on the dynamic zigzag with the notification and prediction mode
This version of the indicator identifies 11 harmonic patterns and predicts them in real-time before they are completely formed. It offers the ability to calculate the error rate of Zigzag patterns depending on a risk threshold. It moreover sends out a notification once the pattern is complete.
The supported patterns:
ABCD BAT ALT BAT BUTTERFLY GARTLEY CRAB DEEP CRAB CYPHER SHARK THREE
FREE

Supply or demand zones refer to price areas where a significant amount of supply or demand had previously entered the market, causing prices to either fall or rise. If the price returns to the demand or supply zone, it is likely to bounce off due to the large number of orders previously placed within the zone. These orders will be defended in these areas.
The Fair Value Gap (FVG) is a concept used to identify imbalances in the equilibrium of buying and selling. Fair Value Gaps are formed in a

FOR CRASH 500 ONLY!! MT5
*This is a smooth heiken ashi setup meant to be used on CRASH 500 in combination with other indicators. *You are welcome to test it on other markets aswell. *I will be posting other indicators aswell to help with trading the crash 500 market. *You can use this to help smooth out price if you do struggle with reading the charts as is. * Just note heiken ashi doesnt represent real price action only smoothes it out for ease of read.
FREE

Trade Assistant MetaTrader System — a multi-timeframe system that is based on three standard indicators: Stochastic oscillator , RSI (Relative Strength Index), and CCI (Commodity Channel Index). It displays current trend directions for M1, M5, M15, M30, H1, H4, D1, W1, and MN1 timeframes. When you follow such an indicator you have a clear picture of the trends across all important timeframes. It doesn't matter which timeframe you attach this indicator to.
Input parameters CheckCandl

This indicator automatically identifies demand and supply zones on a number of 1000 candles or more, and you can change that number of settings.
It also carries a high level of accuracy in describing the type of each zone, as it contains:
Weak areas .
Untested areas . Strong areas . Role-taking areas . Areas tested + number of times visited . Areas to which a return is expected, depending on the direction . The indicator contains alert zones.
For signals and more free indicators, you ca
FREE

Сигналы снайперского входа MFI и RSI для синтетики Boom и Crash поставляются с мощными системами оповещения о входе, а для более продвинутых сигналов фильтрации рассмотрите Harmonic Hybrid Pilot Pro.При торговле шипами у вас есть три ордера, логически расположенных для распределения риска, и третий ордер, наконец, близка к самой высокой вероятности всплеска. Сигналы становятся недействительными через пятнадцать минут после окончательного ордера, и убытки должны быть закрыты немедленно. Что касае
FREE

This Engulfing Candle Indicator as the name implies can detect engulfing candlestick patterns on the chart. The indicator alerts the user of the presence of an engulfing candle (Bearish engulfing candle and Bullish engulfing candle) by using visual representation of arrows on the chart. - Blue arrow for Bullish engulfing - Red arrow for Bearish engulfing Extra modifications can be added based on request.
FREE
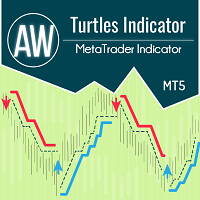
Индикатор работает по системе Черепах и классически предполагает временной интервал 20 и 55 свеч. На заданном временном интервале отслеживается тренд. Вход осуществляется в момент пробоя уровня поддержки или сопротивления. Сигнал выхода – пробой цены в обратном направлении тренда того же временного интервала. Преимущества:
Инструменты: Валютные пары, акции, сырьевые товары, индексы, криптовалюты Таймфрейм: Классически D1, также подходит для работы с любыми таймфреймами Время торговли: круглос
FREE
MetaTrader Маркет - лучшее место для продажи торговых роботов и технических индикаторов.
Вам необходимо только написать востребованную программу для платформы MetaTrader, красиво оформить и добавить хорошее описание. Мы поможем вам опубликовать продукт в сервисе Маркет, где его могут купить миллионы пользователей MetaTrader. Так что занимайтесь только непосредственно своим делом - пишите программы для автотрейдинга.
Вы упускаете торговые возможности:
- Бесплатные приложения для трейдинга
- 8 000+ сигналов для копирования
- Экономические новости для анализа финансовых рынков
Регистрация
Вход
Если у вас нет учетной записи, зарегистрируйтесь
Для авторизации и пользования сайтом MQL5.com необходимо разрешить использование файлов Сookie.
Пожалуйста, включите в вашем браузере данную настройку, иначе вы не сможете авторизоваться.