Смотри обучающее видео по маркету на YouTube
Как купить торгового робота или индикатор
Запусти робота на
виртуальном хостинге
виртуальном хостинге
Протестируй индикатор/робота перед покупкой
Хочешь зарабатывать в Маркете?
Как подать продукт, чтобы его покупали
Технические индикаторы для MetaTrader 4 - 70

Это кластерный индикатор, являющийся развитием линейки CCFpExtraSuperMulti . Теперь он более приспособлен для работы со смешанными кластерами, в которые могут быть включены символы с разных рынков. Например, можно одновременно смотреть валюты Forex и биржевые индексы, CFD, товары. Количество отображаемых линий увеличено до 16. Появилась возможность включить интерактивную линейку для измерения разницы между линиями. Как и в CCFpExtraSuperMulti, индикатор создает внутри себя набор встроенных класт

Strong Pivot trend indicator is a trend indicator that uses standard pivot calculation and some indicators. The purpose of the indicator is to calculate the possible trends using the pivot point. And to give the user an idea about trend direction.
You can use this indicator as a trend indicator. Or with other indicators suitable for your strategy.
Features The blue bar represents the upward trend. The yellow bar represents the downward trend. The blue pivot point represents the upward trend.

Always Strong indicator, an indicator that uses MacD and Bollinger bands. It is a coded indicator to find trends. It finds these trends by its own algorithm. This indicator requires visual monitoring. It does not give any warning because it needs visual follow-up. The main trendline should turn down to find the down trend. The main trend line should go under the white line and then go under the yellow line. The main trendline should turn upward to find the upward trend. The main trend line shoul

Алгоритм работы индикатора основан на том, что цена привлекается к медленной скользящей средней То же самое относится и к быстрой скользящей средней, которая движется вокруг медленной скользящей средней Эти скользящие средние имеют специальный алгоритм сглаживания. Когда быстрая Moving average идет вверх и находится ниже медленная Moving average, имеем потенциальной сигнал для открытия позиция - Buy entry Когда быстрая Moving average идёт вниз и находится выше медленная Moving average, имеем по
Signal Trend Arrows is an indicator designed to generate trading signals. This indicator uses a number of different indicators and generates a signal using a number of historical data. It generally tries to calculate the trend return points. These trend returns may be sometimes very large, sometimes small. The investor should act with the belief that the signal may be small. These signals vary according to market conditions. The signals do not repaint. Currency pairs: Any. Work with at least 20

Trend Waves indicator is a trend indicator that uses Average True Range and Standard Deviation indications. It is aimed to find more healthy trends with this indicator. This indicator can be used alone as a trend indicator.
Detailed review 4 different trend colors appear on this indicator. The aqua color represents the rising trend. Dark aqua color means the train is getting weaker. pink color represents the downtrend trend. The dark pink color means the trend is weaker. Parameters Stdeviati

Colored Trend Bars indicator is a trend indicator working with a set of algorithms and a set of indicators. Trend finds trends by using many factors while you are there. This indicator has 4 mode features. Mode 1 represents short-term trends. Mode 2 represents medium to short term trends. Mode 3 represents medium to long term trends. Mode 4 represents long term trends. Easy to use and simple indicator. The user can easily understand the trends. This indicator has 3 trend features. Up trend, down

Реализация индикации трендового движения с моментами для потенциальных стопов в индикаторе TrendCloud . Может легко употребляться как самостоятельная торговая система. Интерпретировать можно так: расположение курса выше или ниже теней показывают наличие тренда. Переход в тень предупреждает о возможном развороте. Вхождение цены внутрь тени говорит в флэтовом движении. Индикатор отслеживает рыночный тренд с непревзойденной надежностью, игнорируя резкие колебания рынка и шумы вокруг средней цены. П
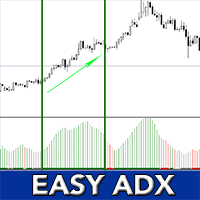
EASY AND SIMPLE STRATEGY - NON REPAINTING - HIGH TIMEFRAME FILTER - EASY TO BACKTEST
*For Desktop MT4 Only *Great For Scalping *Great For Swing Trading *Mobile Alerts, Desktop Alerts *Works On Any Timeframe *Works On Forex, Indices, Crypto *Perfect For New Traders And Expert Traders
We very often use Average Directional Movement Index (ADX) to identify a trend in forex. We use a simple rule: - If the indicator is above level 25, the market is in strong trend and we then study the values
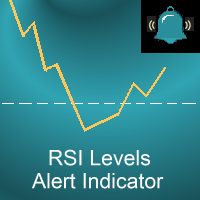
Our custom RSI indicator uses the standard RSI calculation, but it adds a few super-useful upgrades. In our opinion this is the RSI indicator that should come standard with MT4! Have a look and decide for yourself!
Our indicator has the following benefits:
Never miss another RSI set-up when you are away from your computer A colored RSI line makes it easy to see when price is overbought or oversold Get alerts when price moves into overbought/oversold, out of overbought/oversold, or both Custo
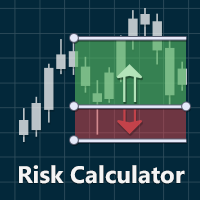
Индикатор Visual Risk Calculator позволяет рассчитать риски перед выставлением ордера.
Возможности:
- Расчет потенциальной прибыли и убытков в пунктах, процентах и в базовой валюте,
включая брокерскую комиссию.
- Расчет соотношение прибыли к потенциальному убытку.
- Информирование о расчетных уровнях стоп-лосса и тейк-профита.
- Возможность перетаскивать уровни входа в рынок, стоп-лосса и тейк-профита на графике для
предварительного просмотра перед установкой ордеров.

Представляем технический индикатор Fibo Channels Ultimate , мощный инструмент, разработанный для того, чтобы коренным образом изменить вашу торговую стратегию Фибоначчи. Благодаря своей расширенной функциональности этот индикатор автоматически рисует все прошлые каналы Фибоначчи на вашем графике, экономя ваше время и усилия. Что отличает Fibo Channels Ultimate, так это его исключительные возможности настройки, позволяющие профессиональным трейдерам рисовать любой уровень Фибоначчи по своему
A Capital Line - это сложный алгоритм, который обнаруживает 100% трендов. Эта строка отмечает следующую информацию: Вход в тренд. Стоп потери. Поддержки и сопротивления. Когда брать прибыль. Отправить оповещения на свой мобильный телефон через Metatrader Он отлично работает на любом инструменте (акции, форекс, крипто, товары, индексы и т. Д.). Также в любой период времени, чтобы приспособиться к любому стилю торговли. Пожалуйста, смотрите скриншоты для примеров и следуйте за нами на Instagram

Trade Trend indicator is an oscillator designed to calculate trend reversal points. A set of bar calculations and a set of algorithms to calculate trend reversals. Level probing system with high probability trends. All of these features combine to make it easier for investors to find trends.
Suggestions and Features There are two levels on the Trade Trend indicator. They are at levels of upper level and lower level. The oscillator bar should be below lower level to find the upward trend. And a
RSI Mtf
Это мультифреймовый вариант стандартного индикатора " Relative Strength Index ". Здесь реализована та же идеология, как и в других индикаторах автора, таких как " Ma_Multi ", " CCI MTF ", " DeMarker Mtf ", " Force Multi ". Их общим отличительным признаком является соблюдение правильного масштаба времени. В окне индикатора вы можете создать любой набор таймфреймов, и масштаб каждого всегда будет соответствовать масштабу ценового графика, который открыт в данный момент. Таким образом м
This indicator is an upgrade of traditional MACD on MT4. It can alert and push notificaton (if configured) when : - MACD line cross Signal Line -MACD line cross Zero -MACD cross Trend Line -MACD cross Horizontal Line It has two working mode: on ClosedCandle and on RunningCandle. With ClosedCandle mode, it only alert when a candle is closed. Trader only draw a line (trend line or horizontal line) on MACD indicator window and the indicator will automatically find that line and check if it is cros

Этот индикатор подсчитывает в реальном времени количество тиков в секунду и показывает их рядом с каждым последним баром.
Кроме того, он показывает двумя разными сигналами конкретные количества тиков, которые мы назначили каждому сигналу.
Этот показатель является особым для определения того, соответствуют ли определенные изменения цены количеству тиков, которые мы ожидаем от рынка.
Индикатор ищет на графике уровни поддержки и сопротивления. Алгоритм устроен так, что при побитии уровней в обратном направлении и закреплением за уровнем индикатор показывает сигнал на покупку или продажу инструмента. Подтверждение сигнала обусловлено низким объемом. Хорошо себя показывает на коротких дистанциях. То есть идеально подходит для скальпинга. Лучшие таймфреймы это: M15, M30, H1. Валютные пары только - EURUSD, EURJPY, USDCHF, GOLD, USDJPY, GBPUSD, GBPJPY. На осталь
Super signals is an indicator that generates trade arrows. It generates trade arrows with its own algorithm. These arrows give buying and selling signals. The indicator certainly does not repaint. Can be used in all pairs. Sends a signal to the user with the alert feature.
Trade rules Enter the signal when the buy signal arrives. In order to exit from the transaction, an opposite signal must be received. It is absolutely necessary to close the operation when an opposite signal is received. The
This indicator is an upgrade of traditional RSI on MT4. It can alert and push notificaton (if configured) when : -RSI line cross its MA line -RSI Enter and Exit Overbought and Oversold Zone. These zones can be set by input. -RSI cross line for both Trend line and Horizontal line. It has two working mode: on ClosedCandle and on RunningCandle. With ClosedCandle mode, it only alert when a candle is closed. Trader only draw a line (trend line or horizontal line) on RSI indicator window and the indi
This indicator is an upgrade of traditional CCI on MT4. It can alert and push notificaton (if configured) when : -CCI line cross its MA line -CCI Enter and Exit Overbought and Oversold Zone. These zones can be set by input. -CCI cross line for both Trend line and Horizontal line. It has two working mode: on ClosedCandle and on RunningCandle. With ClosedCandle mode, it only alert when a candle is closed. Trader only draw a line (trend line or horizontal line) on CCI indicator window and the indi

This is the indicator of trading signals. Signal special will be not repair.
Input Parameters On Alert - True/False (displays a message in a separate window). On Send Notification = True/False. (Sends push notifications to the mobile terminals, whose MetaQuotes IDs are specified in the "Notifications" tab. (Strict use restrictions are set for the SendNotification() function: no more than 2 calls per second and not more than 10 calls per minute. Monitoring the frequency of use is dynamic. The
This indicator is based on the classic Pivot Points concept combined with additional optimizations and advanced features. The levels of support and resistance are calculated by taking into account the average historical volatility. The added multi-symbol scanner allows you to detect the best conditions and trade setups. You can see in real time the current situation for all of your favorite symbols and you can switch the chart to any symbol with one click. The build in alert system allows you

Force Price Power - очень мощный индикатор, который дает ценную и полезную информацию о реальной силе цены путем динамического усреднения в дополнение к объему операций, которые происходят на рынке. Этот показатель является особым для определения динамической силы цены. Расстояние до нуля (вверх или вниз от нуля) будет указывать на уровень силы и силы, будь то медвежий или бычий.

Trend Professional is an indicator that generates trend signal. It generates trend signal with its own algorithm. These arrows give buying and selling signals. The indicator certainly does not repaint. Can be used in all pairs. Sends a signal to the user with the alert feature.
Trade rules Enter the signal when the buy and sell signal arrives. Processing should only be initiated when signal warnings are received. It is absolutely necessary to close the operation when an opposite signal is rece

Level Gun Pro - это индикатор автоматического построения уровней Гана. За основу взята теория Гана, немного доработан алгоритм вычисления вибраций рынка. Основная суть индикатора заключается в том, что он берет всю истории торгового инструмента и на ее основе строит горизонтальные уровни. Годовые, месячные и недельные. Преимущества этого индикатора заключается в том, что он за ранее наносит уровни на график и не подстраивается под его изменения. Годовые уровни наносятся в начале года. Месячные в

About Holy Trend was developed to identify trend and strength.
VIDEO (information and tips) [HERE]
Features
Identifies trend Identifies strength of trend Identifies lines of support and resistance
Easy to analyze Fast signals All timeframes Not repaint (when candle close) No settings required Can be used in Renko charts Can be used with indicator Holy Renko PRO Alerts, email and push notifications
Advantages Sensitive identifier of trend able to identify the long, short movements
PERFENCTRY will show you exactly when to enter a trade. If the trend changes, it will show the reverse accordingly. It works on all time frames and currencies, stocks, commodities & crypto It does not require a change of settings. The default settings are fine. Just load it on to your chart and wait for the entry signal. This works very well when using Trend Qualifier as a filter. You will wonder how you managed without PERFENCTRY DOES NOT REPAINT once candle is closed
Join my Telegram Ana
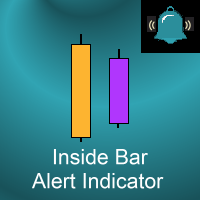
This indicator marks Inside Bars (bars with a lower high and a higher low than the previous bar) on your chart. It will also send alerts when one forms, including via e-mail or push notification to your phone . It's ideal for when you want to be notified of an inside bar set-up but don't want to have to sit in front of your chart all day. You can configure all the settings including: What symbol (if any) is plotted to highlight an inside bar Whether the symbol is plotted above the bar or below t
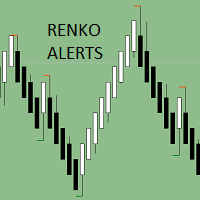
Renko Charts now have the alerts, we need. There are four alert types to choose from for notification on screen, email or phone notification. The alert types also have buffers for use with automation. This indicator can be incorporated with any system that requires renko charts. The four (4) alert types are: Three-bar Formation; Pinbar; Maubozu and Engulfing Bar The alerts may also be adjusted by settings found in the input window of the indicator.

Канал Doonchian состоит из двух отображающих канал. Линии канала определяются по простому и надежному алгоритму. Канал желательно использовать для торговли внутри канала. Индикатор не перерисовывается и не запаздывает, в основе работы простые алгоритмы. Работает на всех валютных парах и на всех таймфреймах. Как всегда предупреждение, не надо забывать, что подход должен быть комплексным, сигналы индикатора требуют дополнительной информации для входа в рынок.
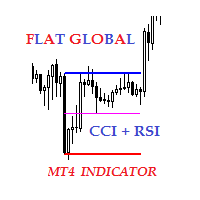
Описание Индикатор локального флета для индикаторов CCI и RSI. Пользователю предоставляется возможность выбора финансового инструмента. Индикатор предоставляет возможность поиска локальных флетов в следующих опциях: Ширина каналов не более определенного диапазона Ширина каналов не менее определенного диапазона Ширина каналов не более и не менее определенного диапазона Индикатор отображает середину, верхнюю и нижнюю границы флета. Возможные варианты применения индикатора показаны на скриншотах. Н
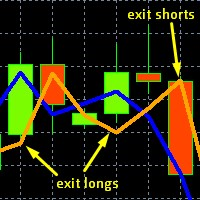
This is the original, simpler version of our core EURUSD algorithm (it calculates and displays 2 lines rather than 3), but it is still capable of detecting levels in the market where EURUSD will likely move to. These levels are indicated by unusual large gaps, formed by the two lines.
Detailed guidance is given to users. All in all it works on the very short term, and more importantly on the daily chart.
The differences between this and our top EURUSD indicator, is that this one only dis

KT Momentum Arrows Indicator is based on a momentary breakout which is calculated using the bands deviation and emerging volatility in a certain direction. A buy signal is generated when the price close above the upper band and a sell signal is generated when the price close below the lower band. A magnitude coefficient is used as the input which affects the band deviation and volatility at the same time. The coefficient value should be carefully selected and analyzed based on the instrument and
This is the FXTrader Ariel Real Candle Color . It shows the current candle color in of all timeframe. It helps you to spot trends and supports your Price Action Trading. The indicator can be used on every time frame. Pro Traders can also you use it for scalping in smaller timeframes (M1, M5 and M15). This indicator is not a complete trading system, it is just support. For Details please contact me here or on instagram. Explanation of Parameters Corner: Choose the corner where to display the ind

Ultimate Engulfing Bar Scanner (Multi Pair And Multi Time Frame) : ---LIMITED TIME OFFER: NEXT 25 CLIENTS ONLY ---46% OFF REGULAR PRICE AND 2 FREE BONUSES ---SEE BELOW FOR FULL DETAILS Nothing is more important than institutional price action and order flow.
And a strong engulfing candle is a clear indication that the institutions have flipped their sentiment.
Engulfing bar patterns are widely used by institutional traders around the world. As they allow you to manage
your trades with
Signal V is an indicator that generates trend signal. It generates trend signal with its own algorithm. These arrows give buying and selling signals. The indicator certainly does not repaint. Can be used in all pairs. Sends a signal to the user with the alert feature.
Trade rules Enter the signal when the buy and sell signal arrives. Processing should only be initiated when signal warnings are received. It is absolutely necessary to close the operation when an opposite signal is received. Or t

Ultimate Correlation Scanner (Multi Pair And Multi Time Frame) : ---LIMITED TIME OFFER: NEXT 25 CLIENTS ONLY ---46% OFF REGULAR PRICE AND 2 FREE BONUSES ---SEE BELOW FOR FULL DETAILS Correlations exist because of ongoing patterns in global capital flows.
Correlations are a fundamental market principle that underpin the markets.
And correlations will never go away. Global capital tends to flow (in unison) in and out of risk sensitive currencies.
While at the same time flowing in and out o
RELIABLE SCALPING INDICATOR ( RSI ) As the name implies, this indicator gives reliable BUY and SELL signals on your chart. NO FANCY INDICATORS, NO MESSING WITH YOUR CHARTS. IT DOES NOTHING TO YOUR CHARTS EXCEPT TO SHOW ARROWS FOR BUYS AND SELLS. It DOES NOT repaint and has alerts and notifications which you can allow. It has chart notifications, mobile and email notifications and alerts. THIS INDICATOR PRODUCES ABOUT 85% ACCURATE SIGNALS WHICH IS VERY ENOUGH TO MAKE YOU PROFITABLE.
RECOMMENDED

DoAid
DoAid indicator is a simple channel indicator with an advance timeframe correlation board. DoAid indicator: can be used with any instrument provided by your broker and MetaTrader, be it Currency , Commodity ,Stock, or Cryptocurrencies.
DoAid indicator can be used for swing, scalping and day trading.
DoAid indicator is also a multi time-frame indicator {MTF}. DoAid indicator can be used with any timeframe. It does not repaint.It does not repaint.
When To Buy
if the market

Стрелочный индикатор, для определения корректировок и локальных трендов Стрелка появляется на текущем баре и после закрытия бара уже не исчезнет Позволяет входить в сделку в самом начале движения Благодаря гибким настройкам можно использовать на любых валютных парах, металлах и криптовалюте Можно использовать при работе с бинарными опционами
Отличительные особенности Не перерисовывается; Дополнительные параметры для точной настройки; Работает на всех таймфреймах и на всех символах; Подходит

SystemPro - профессиональный индикатор, представляет собой полноценную, самодостаточную авторскую стратегию работы на рынке Forex. Уникальный алгоритм работы анализа валютного рынка основан на расчете опорных точек на трех разный временных периодах. Таким образом, индикатор одновременно анализирует долгосрочное, среднесрочное и краткосрочное поведение цены перед тем как выдать сигнал. Индикатор устанавливается обычным образом и работает с любыми торговыми символами.
Преимущества индикатора явл

Square Dashboard is a new generation indicator that has the task of simplifying the technical analysis of the market and speeding up access to the charts. The logic of this indicator is really simple but effective, you can observe the daily, weekly and monthly opening values. The confluence of these values leads to the generation of the warning, red to identify bearish conditions, green to identify bullish conditions, while the gray color identifies the lateral condition. Having the whole market

Панель предназначена для быстрого визуального нахождения и отображения внешних баров по всем периодам и на любых выбранных валютных парах одновременно. Цвет сигнальных кнопок, указывает на направление паттерна. По клику на сигнальную кнопку, осуществляется открытие графика с данным паттерном. Отключить не используемые периоды, можно кликом по его заголовку. Имеется поиск в истории (по предыдущим барам). Прокрутка (scrolling) панели, осуществляется клавишами "UP" "DOWN" на клавиатуре. Имеется Pus

The High Low indicator is a very simple indicator that has the task of showing us the minimum and maximum levels of the time frame that we wish to underline. This indicator also has the ability to show you minimum and maximum price levels of institutional periods as a level, such as quarterly, half-yearly and annual. We believe these minimum and maximum levels are the true key market levels and therefore a correct visualization on the graph is able to show the important price levels.

The Triangular Breakout looks for when there is a volume spike followed by a 3 bar break. It then draws arrow when price breaks out of the recent high or low of the 3 bar pattern.
We also look for triangles that form when price fractals converge. It also will draw arrows when price breaks out of the recent high or low of this triangle pattern.
There are alerts set for when either we get a 3 bar break or triangle or when we get an arrow.
According to DOW theory triangles are really momen

Market Dashboard Indicator gives you advanced information’s about your selected Symbols in MarketWatch Daily Price Movements (M1 – D1) RSI Values with Highlight Function for your current Timeframe & H1 & H4 Profit per Symbol and traded lots (buy & sell) EMA 5 – 100 based on selected period Swap Information (which direction is positive) FIBO Info & Tracking (highlighted FIBO Levels close to current price – based on selected period) One Click ChartOpen Important:
Get informed about new Product

The Hi Lo Breakout is taken from the concept of the ZZ Scalper EA which exploits the inevitable behaviour of price fluctuations and breakouts. The fact that because market prices will always fluctuate to higher highs before ebbing down to lower lows, breakouts will occur.
But here I've added a few more filters which I see work well also as an Indicator.
Range Analysis : When price is within a tight range this Indicator will be able to spot this and only then look for price breaks. Yo

Индикатор NEWLevel. Зоны уровней поддержки и сопротивления Самый надежный инструмент в руках любого технического аналитика – это уровни поддержки и сопротивления.
Именно эти уровни магическим образом работают на рынке, ведь от них цена то отбивается, то наоборот набирает максимальное ускорение, пробивая их и стремясь к новой ценовой отметке. Однако на практике многие начинающие сталкиваются с огромными трудностями при их построении. Вызвано это тем, что цена может совершенно по-разному реа

SystemBinaryM1 - профессиональный индикатор для торговли краткосрочными бинарными опционами, представляет собой полноценную, самодостаточную авторскую стратегию работы на рынке бинарный опционов. Уникальный алгоритм работы анализа валютного рынка основан на расчете опорных точек на трех разных временных периодах M15, M5. M1. Таким образом, индикатор одновременно анализирует долгосрочное, среднесрочное и краткосрочное поведение цены перед тем как выдать сигнал. Индикатор устанавливается обычным

Super MA Trend indicator is an indicator designed to find trends. It uses a moving average, a set of candle combinations and High/Low levels to find trends. This indicator is a complete trading system. You can trade with this indicator as you like.
Features and Recommendations You can use this indicator on all pairs except for the volatile pairs. It is recommended to use it on M15 and over graphics. The most important element in this indicator are alerts. Do not open orders unless you receive

The MTF MA Trend indicator is an advanced model of the moving average indicator. With this indicator, you can follow the moving averge inductor in the multi time frame from a single graphical display. This indicator shows 7 different time zones on a single graphical display. This display is designed in oscillator style. It is also a new generation trend indicator.
Features It can work in 7 different time zones. different color settings can be made for each time zone. each time zone has a level

Strategy Builder
Индикатор Strategy Builder дает возможность создания классических и индивидуальных стратегий не нагружая график большим количеством индикаторов и не отслеживая множество разных индикаторов для выявления истинного сигнала. Strategy Builder выводит сигналы в виде стрелок по 30 стандартным индикаторам, 23 индикаторам показывающих дивергенцию классическую и скрытую, получение сигналов от уровней Фибоначчи, горизонтальных, трендовых линий и прямоугольника. При помощи данного инди

This is the FXTraderariel Psychology Indicator . It calcutes a sell and buy zone according to Psychology Levels. The indicators shows also potential Take Profit Targets. Depending on the settings and trading style, it can be used for scalping or long-term trading . The indicator can be used on every time frame , but we advise to use it on H1, H4 and D1 . Especially if you are a novice trader. Pro Traders can also you use it for scalping in smaller timeframes (M1, M5 and M15). This indicator is n

Индикатор отражает тенденции в динамике цен на рынке. Существует основные три тенденции в динамике цен: восходящее движение, нисходящее движение и боковое движение цены. Индикатор помогает определять превалирующее направление движения цены. Говоря простыми словами, позволяют визуализировать тенденции, присутствующие на рынке. Используя индикатор вы всегда сможете торговать в направлении тренда. Также, индикатор можно использовать как определение канала или уровней поддержки и сопротивления. Реко

1. Что такое Floating Nest?
Данный индикатор предназначен для автоматизации построения зон принятия решения (могут выступать в качестве уровней поддержки-сопротивления) по стратегии "Плавающее гнездо".
Так же индикатор позволяет существенно сократить время при анализе поведения цены в зонах принятия решения на исторических данных. Работает на любых валютных парах. Таймфрейм: M1-H1.
Торговая система"NEST" (Гнездо) , отличается своей простотой и эффективностью при торговле на биржевых рынках

Данная версия индикатора Floating Nest работает только в тестере, на демо счетах и на реальных счетах на паре USDCHF.
1. Что такое Floating Nest?
Данный индикатор предназначен для автоматизации построения зон принятия решения (могут выступать в качестве уровней поддержки-сопротивления) по стратегии "Плавающее гнездо".
Так же индикатор позволяет существенно сократить время при анализе поведения цены в зонах принятия решения на исторических данных. Работает на любых валютных парах. Тай
FREE
The Stochastic Alerts indicator is an advanced model of the standard stochastic indicator. This indicator is different from the standard indicator 2 level warning feature has been added.
For example, the user will be able to receive warnings at levels above 80 and below 20. It can change the levels you wish. For example 60 and 40 can do. This depends on the user's discretion. you can turn the alerts on or off as desired.
Parameters Kperiod - Standard stochastic kperiod setting Dperiod - Stan
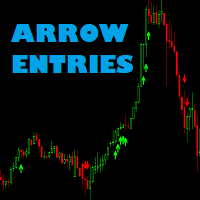
Arrow entries indicator Arrow entries is a tool to help make entry decisions. It draws arrows for buy and sell and is based on 2 MFI indicators and filtered by fast over or under slow Moving Average.
Check out my other products: https://www.mql5.com/en/users/tkjelvik/seller#products
Input variables Period MFI1: How many candels to calculate MFI1. Shift_MFI1: Candels back to be used. Period MFI2: How may candels to calculate MFI2. Shift_MFI2: Candels back to be used. Overbought/Oversold are
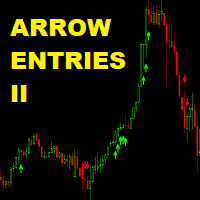
Arrow Entries II Arrow entries II indicator Arrow entries is a tool to help make entry decisions. It draws arrows for buy and sell and is based on 2 Signals and filtered by fast over or under slow Moving Average. Do not confuse this with my other indicator Arrow Entries. The rules for a signal is different. Arrow Entries II produce less signals than Arrow Entries, but are more precise Want an EA to do the job for you? Buy it here: https://www.mql5.com/en/market/product/33266 Check out my ot
Real Trading Signal is an indicator that generates trade arrows. It generates trade arrows with its own algorithm. These arrows give buying and selling signals. The indicator certainly does not repaint. Can be used in all pairs. Sends a signal to the user with the alert feature.
Trade rules Enter the signal when the buy signal arrives. In order to exit from the transaction, an opposite signal must be received. It is absolutely necessary to close the operation when an opposite signal is receive

Индикатор Advanced Trend Scalper разработан как для начинающих, так и для профессиональных трейдеров. Индикатор анализирует рынок и формирует сигналы на покупку и продажу. Он не использует никакие другие индикаторы, работает исключительно с ценовым действием. Сигнал появляется сразу после закрытия свечи и не перерисовывается. Эффективный алгоритм обеспечивает высокую степень достоверности таких сигналов. Версия Advanced Trend Scalper для терминала MetaTrader 5 : https://www.mql5.com/ru/marke
Индикатор очень своевременно показывает изменение направления рынка на любом инструменте. Более того, этот индикатор мультитаймфреймовый, что позволяет увидеть на текущем периоде графика смену направления движения рынка с более старшего таймфрейма. Стрелка вверх сигнализирует о восходящем движении, стрелка вниз - о нисходящем. Каждая стрелка имеет свою ценовую составляющую, равную(как правило) значению экстремума на используемом таймфрейме, что можно использовать в качестве установки стоповых
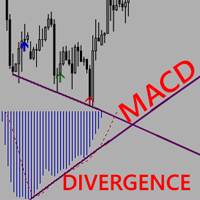
MACD Divergence with arrows complements the MACD indicator. It scans for divergence within the MACD oscillator then draws arrows on the entry points in the chart window. NB:The indicator does not bring up the MACD window nor does it draw lines on the MACD window. The screenshots are a mere description of how they work. The user will become alerted whenever a divergence is in progress and should WAIT for the perfect moment to make an entry. Perfect entries can be anything basic such as support an

Trend Line Finder will project forward a support and resistance lines using 2 previous highs for resistance and 2 previous lows for support. It will then signal to the trader by alert making the trader more aware that a possible good move is about to happen. This is not a stand-alone trading system but is very useful in finding key areas of support resistance levels where price will usually either rebound from or breakthrough. Its down to the trader to decide what to do with use of other s

Trend indicator with Multi-level Take Profit indication. Possibility to setting in normal or Aggressive mode. Fully customizable in color and alarm. Very useful to understand the trend and where price could go No need to explain, see the images. You'll se the trend, 3 possibly target and stop loss (or other take profit) when the trend change. You can adopt various strategy, for example. 1) Open trade and try to close it at target 1 2) Open 2 trade, close 1 at target 1, stop in profit for 2 and t
Индикатор очень своевременно показывает входы в рынок на любом инструменте. Каждая стрелка имеет свою ценовую составляющую, равную(как правило) значению экстремума на используемом таймфрейме, что можно использовать в качестве установки стоповых ордеров или других действий при применении индикатора в советниках. Индикатор имеет минимальное количество параметров, позволяющих без особого труда настроить его работу. Параметр Level_Open отвечает за скорость выдачи сигнала. Чем больше этот парамет

Данный индикатор разновидность графического анализа движения цены для моментального определения состояния рынка, который позволяет определить, на какой стадии состояния он находится. Индикатор строится в нижнем отдельном окне отделенном от основного графика. С помощью индикатора можно получить информацию о возможной смене направления движения цены, а значит и возможность открытия позиций в нужную сторону. Описание настроек индикатора: bar_limit - ограничение отображения индикатора на определенно

What is SuperMA?
SuperMA is an advanced custom indicator converting standard moving averages into a powerful tool. With help of this tool you will be able to see any moving average from the higher chart period on any lower timeframe.
In standard MA indicator, once the user changes chart period (e.g. from daily to 1h) MT4 calculates new moving average for the 1h chart – which is completely different from the moving average for the daily chart. SuperMA makes it possible to see the exact movin

Индикатор Average Price производит расчет средних цен открытых позиций BUY и открытых позиций SELL, с учетом размера открытых позиций, комиссий и свопов. Индикатор строит среднюю линию открытых позиций BUY, после пересечения которой, ценой снизу вверх, суммарная прибыль по всем позициям BUY по текущему инструменту, становится больше 0. Индикатор строит среднюю линию открытых позиций SELL, после пересечения которой, ценой сверху вниз, суммарная прибыль по всем позициям SELL по текущему инструмен
MetaTrader Маркет предлагает каждому разработчику торговых программ простую и удобную площадку для их продажи.
Мы поможем вам с оформлением и подскажем, как подготовить описание продукта для Маркета. Все продаваемые через Маркет программы защищаются дополнительным шифрованием и могут запускаться только на компьютере покупателя. Незаконное копирование исключено.
Вы упускаете торговые возможности:
- Бесплатные приложения для трейдинга
- 8 000+ сигналов для копирования
- Экономические новости для анализа финансовых рынков
Регистрация
Вход
Если у вас нет учетной записи, зарегистрируйтесь
Для авторизации и пользования сайтом MQL5.com необходимо разрешить использование файлов Сookie.
Пожалуйста, включите в вашем браузере данную настройку, иначе вы не сможете авторизоваться.