Смотри обучающее видео по маркету на YouTube
Как купить торгового робота или индикатор
Запусти робота на
виртуальном хостинге
виртуальном хостинге
Протестируй индикатор/робота перед покупкой
Хочешь зарабатывать в Маркете?
Как подать продукт, чтобы его покупали
Технические индикаторы для MetaTrader 4 - 68
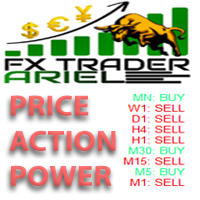
This is the FXTraderariel Price Action Power . It scans the market for opportunities and shows a buy or sell signal.It uses price action to find the best opportunities. You will get an overview on all Timeframes. Depending on the settings it and trading style, it can be used for scalping or long-term trading . The indicator can be used on every time frame , but we advise to use it on H1 and H4 . Especially if you are a novice trader. Pro Traders can also you use it for scalping in smaller timef
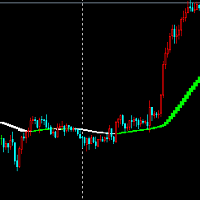
Look at the picture can see clearly, multi-space color index is very useful index.
Indicator parameters can be set at will, I usually use this indicator to measure the judgment of many and empty when trading.
Although the index is delayed, I think the performance and appearance of this index can make you judge the empty, I think the index is a trader's reference.
Color description in the index When the indicator turns green to white, it means that the price rise has ended, or falls or shoc

The indicator depends on the price action's analysis how is based on the rsi indicator and the moving average line from a platform containing multi symbols and different time-frames with the possibility to select your desired symbols and time-frames . Special Characteristics : * Real time analysis or at price close . * The possibility to open several windows with the selected symbols . * Different alert systems .
Indicator Characteristics : * Multiple symbol and time frame with

Панель предназначена для быстрого визуального нахождения и отображения пин-баров по всем периодам и на любых выбранных валютных парах одновременно. Цвет сигнальных кнопок, указывает на направление пин-бара. По клику на сигнальную кнопку, осуществляется открытие графика с данным паттерном. Отключить не используемые периоды, можно кликом по его заголовку. Имеется поиск в истории (по предыдущим барам). Прокрутка (scrolling) панели, осуществляется клавишами "UP" "DOWN" на клавиатуре. Имеется Push-ув
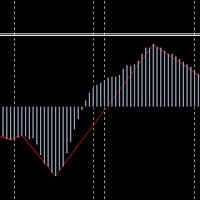
The translation of MACDbeili metrics into English means MACDdeviation. It is based on the requirement of the investor to write the high end EA's artifact, which can get a MACD deviation signal well according to this index. Some investors like to do MACD deviations, and use this index to write EA on the deviation of the MAcd.
Investors know that MACD deviation is a good way to operate, according to the signal of MACD deviation, the success rate is very high.
On the parameters of MACDbeili The

Stochdeviation Stochdeviation index is what we usually call the KDJ deviation index, according to this index we can judge whether the market reversal, with my previous MACDbeili index, can effectively filter out some false signals, help investors effectively grasp the top or bottom of the market, deviation is divided into one deviation and two deviations. Deviation, the second deviation shows that the possibility of market reversal is still relatively large, can be very good to help investment t
Набирается блок баров при условии конвергенции . Если условия конвергенции не соблюдаются, блок удаляется. Более точнее, условием является переход блока баров из состояния конвергенции в состояние дивергенции . Блоки формируются выборочно с пропусками. Пропуски характеризуются состоянием дивергенции баров. Индикатор показывает величину конвергенции . Если индикатор ниже нуля, блок не формируется и бары пропускаются. Если индикатор ниже нуля формируются противоположные условия – дивергенции
Набирается блок баров при условии конвергенции . Если условия конвергенции не соблюдаются, блок удаляется. Более точнее, условием является переход блока баров из состояния конвергенции в состояние дивергенции . Блоки формируются выборочно с пропусками. Пропуски характеризуются состоянием дивергенции баров. Индикатор показывает величину и направление цены в блоке конвергенции . Для определения величины конвергенции см. здесь , линия экстремальных баров внутри блока см. здесь . Для формиро
Набирается блок баров при условии дивергенции . Если условия дивергенции не соблюдаются, блок удаляется. Более точнее, условием является переход блока баров из состояния дивергенции в состояние конвергенции . Блоки формируются выборочно с пропусками. Пропуски характеризуются состоянием конвергенции баров. Индикатор показывает величину ди вергенции . Если индикатор выше нуля, блок не формируется и бары пропускаются. Если индикатор выше нуля формируются противоположные условия – конвергенции

Набирается блок баров при условии дивергенции . Если условия дивергенции не соблюдаются, блок удаляется. Более точнее, условием является переход блока баров из состояния дивергенции в состояние конвергенции . Блоки формируются выборочно с пропусками. Пропуски характеризуются состоянием конвергенции баров. Индикатор показывает величину и направление цены в блоке ди вергенции . Для определения величины дивергенции см. здесь , линия экстремальных баров внутри блока см. здесь . Для формирова

This indicator shows Linear Regression Line and it's channels which calculated with fibo numbers. You can use this indicator in different timeframes on your chosen timeframe chart. You only need to attach this indicator on the chart twice or more with a different colors to do this. There are 6 input parameters; period : you can choose regression timeframe independent of chart timeframe. linewidth : width of line on the chart. bars back regression begin : calculated regression bar count. LR

PABT Pattern Indicator - это классическая реализация одного из сигнальных паттернов. Логика индикатора заключается в том, что он определяет ситуации в которых максимум и минимум сигнального бара находится в пределах максимума и минимума предыдущего бара, тем самым показывает разворот тренда. Для сигнала на покупку сигнальный бар закрывается выше цены открытия, для сигнала на продажу сигнальный бар закрывается ниже цены открытия, предыдущий бар соответственно противоположного сигнальному типа. В
AST_personov is an indicator, which presented of the arithmetic average of the ticks. Next to the current price, a line appears with the value of the AST deviation from the current price (in points). If the value is positive, it is green and if it is negative, it is red. What is the arithmetic average of the ticks ? This is the average of the last ticks that the price move. It has nothing to do with bars ( prices Open, Close, High and Low ). Calculations are carried out using ticks. The values c

Kappa Trender is a unique indicator that will recognize trend direction and give you dynamically changing values for stop loss accordingly to further market movements and unique target calculations (take profit or trailing stop loss) based on last market movements. Even if you miss the signal (or close last trade at TP), this tool will give you range of price where you can re-enter with good risk-to-reward relation or you can enter manually and use current stop loss and take profit values. How

A sophisticated trend change indicator with additional filters to cherry pick trades. Also includes genuine statistics and ground-breaking automatic optimization. The indicator does not repaint but doesn't calculates stop loss and take profit. We Follow the trend depending on special formula plus price action The statistics explain all important information most trader need it.consideration spread, the last three days can be shown together with results at the charts and ordered/ranked by profita

This indicator examines the relative strengths of the currencies of 8 different countries and displays the one that has the potential to gain profit in the short term as a suggestion. The relative strength of each country's currency over the selected time period is shown on the graph as a percentage.
The recommended currency according to BuyLevel and SellLevel determined by the user is shown in the bottom right section. The indicator also automatically brings up the 30-minute graph of the sugge
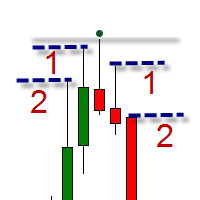
Индикатор предназначен для свинг торговли. Индикатор способен определить тренд и важные вершины тренда (свинги), которые будут важнымы уровнями поддержки/сопротивления. Преимущества Простое визуальное отображение 3 типов свингов : Минорных свингов - которые не влияют на тренд, а только на движение внутри тренда Обычных свингов - которые могут влиять на направление тренда Сильных свингов - которые имеют двойное подтверждения важности уровня Визуальное отображение разворота тренда Минимум настрое

The Euro Currency Index or EURX , quantifies and displays strength and weakness of the single currency. As the index rises it signals strength in the single currency against a basket of currencies. As the index falls this signals weakness in the euro.
The Quantum EURX is calculated from a basket of four currencies with each currency having an equal weighting of 25%. US Dollar Japanese Yen British Pound Australian Dollar The indicator can be used in one of three ways: First, to identify and con

This indicator has been developed to identify and display these trends quickly and easily, allowing you to see instantly, those currency pairs which are trending, and those which are not – and in all timeframes, with just one click. The 28 currency pairs are displayed as a fan as they sweep from strong to weak and back again, and this is why we call it the ‘currency array’. All 28 pairs are arrayed before you, giving an instant visual description of those pairs that are trending strongly, those

Trading the currency markets is a complex business, not least since we are dealing with pairs of currencies, and by inference, pairs of economies. All economies around the world are interlinked, and reflected in the constant ebb and flow of currency strength and weakness. The problem for us as traders is monitoring so many pairs simultaneously, since every pair does not move independently, but reflects the interrelated nature of this market.
The Quantum Currency Heatmap delivers the informatio

The words powerful, unique and game changing are ones that are often over used when applied to trading indicators, but for the MT4/MT5 Quantum Camarilla levels indicator, they truly describe this new and exciting indicator completely.
Why? Because the indicator has something to offer every trader, from the systematic to the discretionary and from swing trading to breakout trading. And it’s not an indicator which is simply used for entries. The Camarilla indicator delivers in all areas, from ge

Prophet - индикатор тренда. Показывает направление точек разворота. Можно использовать с оптимальным коэффициентом риска к прибыли. Стрелками показывает благоприятные моменты и направления для входа в рынок. Использует один параметр для настройки (регулировать от 1 до 3). Вероятность успешного тренда очень высока.При работе тейк-профит значительно больше стоп-лосса! Работает на всех валютных парах и на всех таймфреймах.

Индикатор Trendes работает на всех валютных парах и на всех таймфреймах. Стрелками показывает благоприятные моменты и направления для входа в рынок. Вероятность успешного тренда очень высока. Trendes можно использовать как для пипсовки на мелких периодах, так и для долгосрочной торговли. Индикатор определяет точки входа по методикам, описанным книге "Как играть и выигрывать на бирже". Параметры LengthA — Количество баров для расчета первой функции; LengthB — Количество баров для расчета втор
Индикатор Martingal работает на всех валютных парах и на всех таймфреймах. Стрелками показывает оптимальные точки входов для будущего усреднения по Мартингейлу даже с нулевой экспонентой. Индикатор показывает сигнал на закрытие серии только в том случае, если все предыдущие сигналы можно закрыть в профите. После закрытия серии в профите нужно сразу открывать ордер в направлении сигнала. Таким образом сигнал на закрытие - это одновременно точка реверсного открытия в другую сторону нового ордера.

ForexGumpXL - новое поколение в линейке индикаторов forex gump. Более точный, более быстрый, менее сложный в настройках это все о новом индикаторе ForexGumpXL. В новой версии индикатора мы применили по настоящему новый алгоритм работы. Теперь он не просто анализирует рынок на предмет разворота цены, но и с помощью алгоритма адаптации определяя текущую волатильность на рынке индикатор с высокой степенью вероятности способен предугадывать ложные развороты цены, чтобы в дальнейшем на них не реагиро

Если у вас еще нет своей торговой стратегии, Вы можете воспользоваться нашей готовой торговой стратегией, которая максимально эффективна! Индикатор тренда Spin создан на основе дивергенции цены. Поможет в поиске точек входа при анализе. Может применяться как фильтр в торговле. Имеет один параметр Length . Индикатор может работать как для точек входа, так и как фильтр. Индикатор отражает информацию в наглядном виде. Не надо забывать, что подход к торговле должен быть комплексным, для входа в ры

Интеллектуальный алгоритм индикатора Variator с точностью генерирует входные сигналы и уровни выхода. Если среднее значение цены синее, вам следует искать точки входа для открытия длинных позиций, когда рынок не перекуплен, а если среднее значение цены красное, вам следует искать точки входа для открытия коротких позиций, когда рынок не перепродан. Правила могут быть сведены к следующим. Следует покупать во время восходящего тренда, когда цена достигает среднего значения или перепроданности, и

Advanced indicator of a professional trader - это профессиональный индикатор на базе известного индикатора Stochastic Oscillator. Advanced indicator of a professional trader представляет из себя осциллятор с динамическими уровнями перекупленности и перепроданности, у стандартного Stochastic Oscillator эти уровни статические и никогда не изменяются. Это позволяет индикатору адаптироваться под постоянно меняющийся рынок. При появлении сигнала на покупку или продажу на графике рисуется стрелка и п

This is the FXTraderariel-TakeProfit - Stop Loss Indicator . It provides you 3 potential Take Profits and 1 Stop Loss. These potential targets are computed based on several methods . The indicator can be used on every time frame, but we advise to use it on H1, H4 and D1. Especially if you are a novice trader. Pro Traders can also you use it for scalping in smaller time frames (M1, M5 and M15). This indicator is not a complete trading system. It doesn't provide you a Signal nor can predict the m
В индикаторах часто необоснованно принимается положительная шкала, хотя по сути они симметричные. Такое свойство имеет и стандартный RSI. Настоящий индикатор работает в симметричной относительно нуля шкале, но при этом полностью повторяет форму оригинала. В этом индикаторе важные уровни 20 и -20. Это очень удобно при использовании его в автоматической торговле, так как применение одного порога при оптимизации исключает переоптимизацию. Кроме того, алгоритм вычисления индикатора оптимизирован (ис

This is the complete REX package. It consists of the lite, pro and ULTRA version.
Perfect for beginners and intermediates. REX complete is 100% non repaint. The strategy is based on a mix of different strategies, statistics, including pivot points, oscillators and patterns. As the trading idea consists of a variety of some classic indicators like Momentum, Williams Percent Range, CCI, Force Index, WPR, DeMarker, CCI, RSI and Stochastic, it is clear that the fundamental indicators have being

Индикатор Universal Main Window работает по вашим правилам. Достаточно ввести формулу, по которой будет рисоваться линия индикатора.
Данный индикатор предназначен для работы в главном окне графика.
Все индикаторы серии Universal :
В главном окне В дополнительном окне Бесплатные МТ4 Universal Main Window Free МТ5 Universal Main Window Free MT5 МТ4 Universal Separate Window Free МТ5 Universal Separate Window Free MT5 Полные МТ4 Universal Main Window МТ5 Universal Main Window MT5 МТ4 Universal

Индикатор Universal Separate Window работает по вашим правилам. Достаточно ввести формулу, по которой будет рисоваться линия индикатора.
Данный индикатор предназначен для работы в дополнительном окне графика.
Все индикаторы серии Universal :
В главном окне В дополнительном окне Бесплатные МТ4 Universal Main Window Free МТ5 Universal Main Window Free MT5 МТ4 Universal Separate Window Free МТ5 Universal Separate Window Free MT5 Полные МТ4 Universal Main Window МТ5 Universal Main Window MT5 МТ
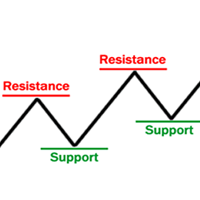
Supports & Resistances is an indicator that draws and reads automatically support and resistance levels like trendlines and fibonacci retracements to identify the most likely areas where the market will bounce. It mainly generates several horizontal and diagonal lines based on past highs and lows. The strenght: Reading on the code the supports and resistances areas permits to use the indicator in the Expert Advisor. The risk: Too many drawn lines on chart could confuse the manual trader but it

Due to the huge success of the limited free version, the now low priced LOTUS version will continue being updated in the future.
Optimal for Binary Options and Forex. For beginners and intermediates. Lotus is 100% non repaint. The strategy is based on 4 ADX parameters, including pivot points and candle patterns. It is recommendable to combine the arrow with an moving average, Elliot waves indicator or Parabolic SAR. The main goal was to keep it as simple as possible ! No useless oscillators

Market Skanner Baks - новый сигнальный индикатор линейки market scanner. Данный индикатор оснащен новым алгоритмом определения тренда. Теперь трейдеру для определения направления движения цены не нужно анализировать десятки различных индикаторов. Достаточно поместить на график Market Scanner Baks и посмотреть куда показывает стрелка на больших и маленьких таймфреймах. Таким образом можно понять краткосрочное и долгосрочное потенциальное движение цены. Кроме того, индикатор по завершения движения

Индикатор, обладающий повышенной информативностью, благодаря уровням перекупленности и перепроданности для более точного отображения ситуации на рынке. Полностью доступны все настройки скользящих средних, такие как тип средней и цены, по которым она строится. Также имеется возможность изменить вид отображения индикатора - линия или гистограмма. Благодаря дополнительным параметрам появилась возможность более тонкой настройки, а торговля может вестись как внутри канала, так и по тренду.
Отличи
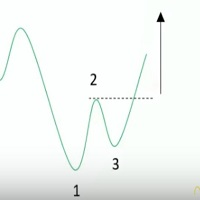
Ross Hook is a price pattern indicator that help traders to forecast market inversions. The activation of the pattern could identify turning points by finding the breakout SR levels or technical analysis figures like triangles, rectangles or head and shoulder. The Indicator runs in all Brokers using Metatrader 4 platform and can be used in an Expert Advisor or as a support of manual trading. This indicator is composed by the OnChart and OnWindow parts: OnChart : Draws the points 1, 2 and 3 t

Price Action Signals generates buy and sell signals with price close and complex logic. You can use it different timeframes and pairs. Best results are on M30 and H1 charts with default parameter. You can change this parameter ( nFrequency ) for other timeframes. ( except M1 timeframe ) There is only one extern input: nFrequency: It determines signal frequency. Default is 0.004. You can use this arrow for Expert Advisors. Upsignal: iCustom(......"PriceActionSignals", buffer nr:0 ) Downsignal :

PipMaster is built using a powerful trend + momentum following algorithm. Made after years of testing and with market noise filtering built-in. Aggressive traders can enter a trade as soon as an arrow appear. Conservative traders should wait for a visual alert after a closed candle bar. This indicator is a great tool to be used with your most trusted trend/momentum trading strategy and with solid money management rules.
Key Benefits: -Super easy to use by following color coded arrow pointing

Here is an automated Andrews Pitchfork indicator which is DESIGNED SPECIFICALLY to integrate with custom Expert Advisor or MANUAL indicator. It will not allow manual modification as it is strictly use for automatic. However, you still can change the Zig Zag parameters to suits your need. Proposed default parameter is 18-Periods or more with +18. Feature Highlight
Right top corner of the Currency information % Strength / Spread / Remaining Bar Time Bottom Right Current & Previous SEQUEN

ATR Channel is an indicator. It shows us ATR ( depends on selected period ) Line on main chart. It also draw 3 up ATR channels (ATRu) and 3 down ATR channels (ATRd) on the same window. All they helps you to trade with a ATR indicator. There are 6 extern inputs; PeriodsATR : You can change ATR Period default is 13. MA_Periods : Use for draw ATR channels MA periods. Default is 34. MA_Type : You can change MA_method here. Default is Linear weighted. Mult_Factor1 : It is for first up and d
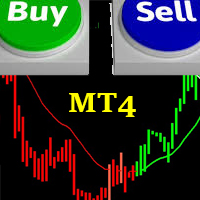
FRIENDLY TREND This indicator is based on the common saying in forex and stock trading that:"THE TREND IS YOUR FRIEND" It is easy to understand and follow; even newbies can achieve great trades out of it. It paints Green candles in an uptrend and signals BUY. It also paints Red candles in a downtrend and signals SELL. The indicator DOES NOT repaint. It is good for any time frame and currency pair. It can be used for Scalping, Day Trading and Swing Trading. Friendly Trend gives push notifications
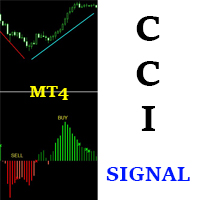
CCI SIGNAL This indicator is based on a custom CCI that is colored to reflect the trend. It was created with the idea in mind: "THE TREND IS YOUR FRIEND". It is simple and easy to use. Even a newbie can understand and use it to achieve great trade results. Simply follow the colors. RED means SELL. GREEN means BUY. It DOES NOT repaint and can be used for Scalping, Day Trading and Swing Trading. It can be used for any time-frame and any currency pair. CCI Signal is highly reliable and provides pow

Fibonacci retracement is one of the most reliable and used technical analysis tools for trading. It uses the so called “golden ratio” to predict certain levels of support (price movement reverses from downward to upward) and resistance (price movement reverses from upward to downward) which is a mathematical pattern seen through out nature and even the universe. Because so many traders make use of this trading strategy and watch these price levels, more often than not the Fibonacci levels become
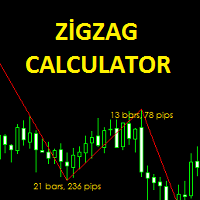
The Zigzag Calculator indicator is designed to calculate bar and pips of zigzag lines. this indicator pips the distance between the end points. You can also see how many zigzag lines are completed in the bar. It is simple and practical to use. Parameters Fontsize - Font size setting. TextColor - Text color adjustment. Depth - the depth setting. Deviation - Deviation setting. Backstep - back calculation setting.
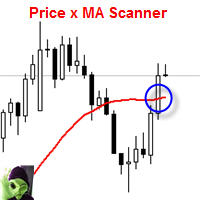
This indicator scans and displays currency pairs that have crossed a moving average depending on a given timeframe. You can configure which pairs the indicator will scan. It also includes all types of alert options.
Features Attach to one chart and scans all the currency pairs configured and visible in the Market Watch Window It can monitor all the available timeframes from M1 to MN1 and sends alerts on every timeframe's candle close when it crosses over a Moving Average Display all currency p
Trading System Signals is an indicator that generates trade arrows. It generates trade arrows with its own algorithm. These arrows give buying and selling signals. The indicator certainly does not repaint. Can be used in all pairs. Sends a signal to the user with the alert feature.
Trade rules Enter the signal when the buy signal arrives. In order to exit from the transaction, an opposite signal must be received. It is absolutely necessary to close the operation when an opposite signal is rece

Pivots Channels Breakouts presents 16 different formulas for Pivots Levels. It draws each one of them and also draws specific channels, trend histograms, and SL/TP levels derived from them . It includes commonly used formulas as Classic, Woodie, ATR, Fibonacci, Camarilla and Demark Pivots, and also presents never seen before formulas based on the Padovan mathematical sequence. Price often reacts at Pivots levels, and at Resistances (R) and Supports (S) of these formulas. That is why a lot of tra
Signal Power System is an indicator that generates trade arrows. It generates trade arrows with its own algorithm. These arrows give buying and selling signals. The indicator certainly does not repaint. Can be used in all pairs. Sends a signal to the user with the alert feature.
Trade rules Enter the signal when the buy and sell signal arrives. Processing should only be initiated when signal warnings are received. It is absolutely necessary to close the operation when an opposite signal is rec

The Super Cross Trend Advanced indicator is designed for trend and signal trading. This indicator generates trend signals. It uses many algorithms and indicators to generate this signal. It tries to generate a signal from the points with the highest trend potential. This indicator is a complete trading product. This indicator does not need any additional indicators. You can only trade with this indicator. The generated signals are displayed on the graphical screen. Thanks to the alert features y

Super Bollinger Trend indicator is an oscillator designed to calculate trend points. A set of bollinger bands calculations and a set of algorithms to calculate trend reversals. Level probing system with high probability trends. All of these features combine to make it easier for investors to find trends. Prameters bollinger_Period - bollinger bands period setting bollinger_Deviations - bollinger bands deviations setting

Индикатор Magneto BCS работает на основе анализа свечей. Определяет точки разворота и продолжение тренда. Основан на простой и стабильной стратегии для внутридневной и среднесрочной работы. Адаптируется к текущей волатильности инструмента.
Настройка и работа с индикатором Настройка индикатора сводится к подбору параметров Gate и Size detect . Чем больше значение Gate тем меньше сигналов. Size detect позволяет применить расчёт только к телу свечи либо к полному размеру. Кроме выделенных на гр
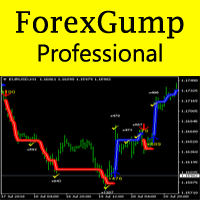
Теперь ForexGump стал еще более профессиональным инструментом для торговли на форекс. ForexGump Professional работает по стратегии следования за трендом. Все функции фильтрации, оптимизации и мониторинга рынка встроены в один индикатор. Полностью автоматический алгоритм нейронной сети с точностью определяет направление цены и максимально эффективные точки открытия и закрытия ордеров. Все, что Вам нужно - это следовать указаниям ForexGump Professional. Теперь индикатор в очень простой и доступной
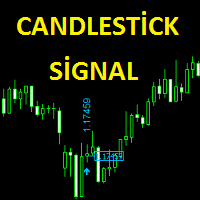
The Candlestick Signal indicator generates signals using a set of indicators and a set of candle patterns. It allows you to operate with these signals. Features
Works on any currency pairs. It works in all periods. Sensitivity setting. You can set the signal frequency. Use recommended standard settings. The greatest feature of this display is the possibility of manual martingale.
The signal intensity region tends to go in the direction of the signal. Works on all charts. Any broker. It is ad

This indicator scans and displays currency pairs that have recently aligned moving averages on a given timeframe. You can configure which pairs the indicator will scan. It also includes all types of alert options. Bullish MA Alignment = MA1>MA2>MA3>MA4>MA5
Bearish MA Alignment = MA1<MA2<MA3<MA4<MA5
Features Attach to one chart and scans all the currency pairs configured and visible in the Market Watch Window It can monitor all the available timeframes from M1 to MN1 and sends alerts on ever
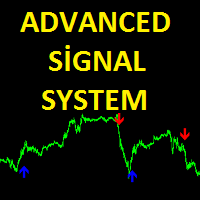
Advanced Signal System is an indicator that generates trade arrows. It generates trade arrows with its own algorithm. These arrows give buying and selling signals. Can be used in all pairs. Sends a signal to the user with the alert feature. The indicator certainly does not repaint.
Trade rules Enter the signal when the buy signal arrives. In order to exit from the transaction, an opposite signal must be received. It is absolutely necessary to close the operation when an opposite signal is rec

TREND REBORN is a non-repainting indicator that shows you the trend of the market can be used as a trend filter or a trade entry or exit BUY when indicator is blue and SELL when Indicator is Orange only The indicator can be used alone or with another indicator based on your trading strategy
Timeframe All Timeframe can be traded Currency pairs All Currency pairs can be traded
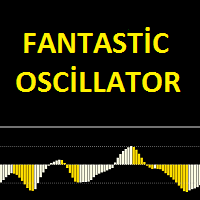
Fantastic oscillator indicator is an oscillator designed to calculate trend reversal points. A set of bar calculations and a set of algorithms to calculate trend reversals. Level probing system with high probability trends. All of these features combine to make it easier for investors to find trends.
Suggestions and Features There are two levels on the fantastic oscillator indicator. They are at levels of 0.5 and -0.5. The oscillator bar should be below -0.5 to find the upward trend. And a blu
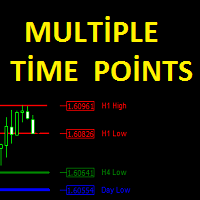
The Multiple Time Points indicator is designed to show candle high and low points. It also shows the high and low points of 4 different time periods. All graphics appear on a single graphical screen. the currently used time slots are H1, H4, D1, W1. Parameters Line style - Line style setting. H1 color - H1 color setting. H4 color - H4 color setting. Day color - D1 color setting Week color - W1 color setting. H1 width - H1 width setting. H4 width - H4 width setting. Day width - D1 width setting.
This indicator is designed to find the difference in MACD price and indicator. This indicator shows the price and indicator difference on the screen. The user is alerted with the alert sending feature. Our Popular Products Super Oscillator HC Cross Signal Super Cross Trend Strong Trend Super Signal
Parameters divergenceDepth - Depth of 2nd ref. point search Fast ema - Fast ema setting Slow ema - slow ema setting MACD sma - macd sma setting indAppliedPrice - Applied price of indicator indMA

Stronger Trend is an indicator that generates trend signal. It generates trend signal with its own algorithm. These arrows give buying and selling signals. The indicator certainly does not repaint. Can be used in all pairs. Sends a signal to the user with the alert feature.
Trade rules Enter the signal when the buy and sell signal arrives. Processing should only be initiated when signal warnings are received. It is absolutely necessary to close the operation when an opposite signal is received
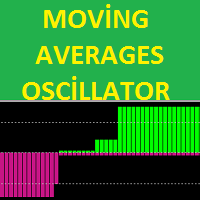
The MA's oscillator indicator is a trend indicator consisting of moving average indicators. It was formed with 4 moving average indicators. This indicator is used to find trends. It is also compatible with other indicators suitable for stretching. The indicator also has multi-time frame (MTF) capability.
Features There are two channel lines on the display. these are the channel lines 3.5 and -3.5. The 3.5 level is the overbought territory The -3.5 level is the oversold territory. The indicator

EZT_Stochastic This is a Multi Timeframe stochastic indicator, with colored background. The colored background can be set to different colors based on the K and D line, (moving up, or down), and also about the position of the lines. In the oversold or overbought zones you can choose different colors. Settings: You can choose the time-frame you want to see the stochastic. Set the regular parameters in a same way like in the original stochastic. Histogram style: The style. Histogram width: The
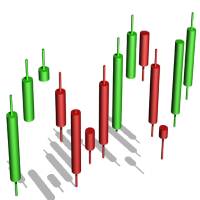
Алгоритм индикатора Tic Tac Toe отличаются от обычных индикаторов на ценовых графиках тем, что он полностью игнорируют течение времени и отражают только изменения в цене. Вместо того, чтобы на оси X отображать временные интервалы, а на оси Y значение цен, индикатор Tic Tac Toe отображает изменения цен на обоих осях. Индикатор отображает красным цветом, если цены вырастают на определенное базовое значение (TicTacToe) и синим, если цены падают на это же значение. Если цены упали/выросли на величи

This Cross Trend Signal indicator uses Donchian channel and ATR indicators. This trend tracking system uses historical data to buy and sell. This indicator does not repaint. The point at which the signal is given does not change. You can use it in all graphics. You can use it in all pairs. This indicator shows the input and output signals as arrows and alert. Open long deals on blue arrows Open short deals on red arrows When sl_tp is set to true, the indicator will send you the close long and cl

The Channel Trade System indicator is an indicator designed to trade with channels. Only by this indicator can be done beautifully by itself. This indicator is composed of moving average and some algorithms.
Features and Suggestions The display has 4 channels. There is one main trend line. The signal line is the thick channel with magenta color. To trade, it is advisable to start with the channel line which is magenta color. A channel calculation setting of 3 to 5 is recommended. the different
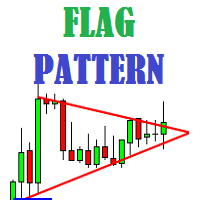
Flag Pattern indicator is an indicator designed to find flag patterns. Bullish and bear find flag patterns. It finds these patterns by its own algorithm. The display is easy to use and simple.
Features Bullish and bear find flag patterns. Draw patterns on the graphic screen. invalid flag patterns. alert the user with the alert feature. Flag patterns have the ability to change colors. Parameters MinSplashHeight - Min. height of splash setting MaxBarsDuration - Max bars before crossing setting

Strong Oscillator is an indicator designed to find indicator trends. It finds trends using a set of algorithms and a set of indicators.
This indicator is a trend indicator. Helps to find trends easily. You can use this indicator alone, or you can use it as an auxiliary indicator for other strategically appropriate indicators. You can use it as a trend validation indicator.
Suggestions and Features There are 4 level lines on the indicator. These level lines 5, 20 and 80 are 95 lines. 5, 20 le
MetaTrader Маркет предлагает каждому разработчику торговых программ простую и удобную площадку для их продажи.
Мы поможем вам с оформлением и подскажем, как подготовить описание продукта для Маркета. Все продаваемые через Маркет программы защищаются дополнительным шифрованием и могут запускаться только на компьютере покупателя. Незаконное копирование исключено.
Вы упускаете торговые возможности:
- Бесплатные приложения для трейдинга
- 8 000+ сигналов для копирования
- Экономические новости для анализа финансовых рынков
Регистрация
Вход
Если у вас нет учетной записи, зарегистрируйтесь
Для авторизации и пользования сайтом MQL5.com необходимо разрешить использование файлов Сookie.
Пожалуйста, включите в вашем браузере данную настройку, иначе вы не сможете авторизоваться.