MetaTrader 5용 새 기술 지표 - 28

A free deals history results panel.
Its working principle is to calculate the income of each month by consulting the historical trading records, and show it in the form of a table. At the same time, it also statistics all the trading results of the current account, so that traders can adjust their trading strategies according to the historical records.
If you have more needs, please contact the author!
FREE
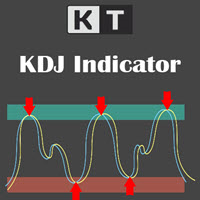
Basic technical analysis tools use signals during market changes by providing critical information that can influence investment and trading decisions. Several technical analysis tools are developed for this purpose, and one of the most popular indicators traders use the KDJ Random index. It's known as the Random Index, is primarily a trend-following indicator that aids traders in identifying trends and prime entry points.
Features
It analyzes and projects changes in trends and price patte
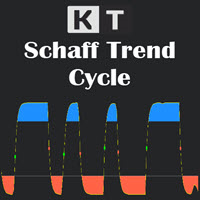
The Schaff Trend Cycle (STC) is a technical analysis tool that helps traders and investors plot highly-probable predictions on the price direction of an instrument. Due to its predictive properties, It's a good tool for foreign exchange (forex) traders to plot buy and sell signals. The Schaff Trend Cycle was developed by prominent forex trader and analyst Doug Schaff in 1999. The idea driving the STC is the proven narrative that market trends rise or fall in cyclical patterns across all time fr

Time Line by MMD is a simple indicator that supports historical data analysis and trading on statistical models that follow the MMD methodology.
Start Time - specifying the time when we start analyzing and playing the MMD statistical model Time Duration in minutes - duration of the model and its highest effectiveness (after the end of the line, the price returns - statistically - to the set level) Lookback days - the number of days back, subjected to historical analysis Base Time Frame - the
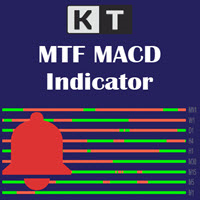
As a trader, monitoring multiple timeframes simultaneously will help you better understand the trend and know when multiple timeframes are in agreement or disagreement. The KT Multiple Time Frame (MTF) MACD displays the overall direction of an instrument in one chart by showing the moving average convergence divergence (MACD) for all time frames. The indicator displays a simple table with the respective MACD trend for each timeframe. You can also see whether MACD is gaining or losing momentum ac
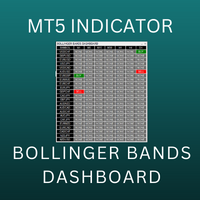
Bollinger Bands Multi Dashboard MT5 uses the value of Bollinger Bands indicator. This dashboard will monitor all symbols in the market watch. We can set up to receive an alert, notification or an email when the buy/sell signal appear on each timeframe. You can check all symbols via only 1 chart. This dashboard will check almost popular time frame (M1,M2,M3,M4,M5,M6,M10,M12,M15,M20,,M30,H1,H2,H3,H4,H6,H8,H12 and D1) in MT5. The colors can be customized. We can have a look at many pairs and many t

To download MT4 version please click here . - This is the exact conversion from TradingView: "Trend Direction Force Index - TDFI [wm]" By "causecelebre". - This indicator uses multiple levels of averaging to detect trend strength. - You can optimize filter low and filter high levels to achieve best results. - You have access to buffers to use in EAs. - This is a light-load processing and non-repaint indicator. - You can message in private chat for further changes you need.
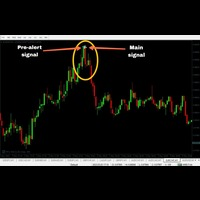
'Zoro PRO' is a reversal strategy based MT5 indicator with advance pre-alert system. Its an 100% non repaint indicator with an average accuracy of about 70-95% in any kind of market. (EXCEPT BAD MARKET AND NEWS TIME) MT4 version https://www.mql5.com/en/market/product/89772 PLEASE NOTE: MT4 version has more accuracy. Better avoid this MT5 version and go for the above link of MT4 version
Recommended Broker: Alpari, Amarkets, tickmill. Recommended pairs for M1
EURUSD
USDJPY
EURGBP
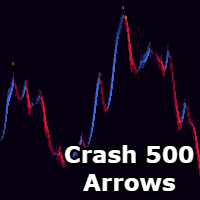
Sylvan Crash 500 Arrows!! MT5
*Only use this on Crash 500 Market. *Only for the 15M Chart. *Sells only. *This doesnt redraw or repaint but the candle needs to close for the arrow to print permanently, it does print on candle open. *It doesnt get you at the tip of highs but instead as soon as price slows down or drops from its overbought parameters. *Do not change input settings as this is already optimized.

MT5용 Obie Scalper Alerts 지표는 스캘퍼와 데이 트레이더 모두를 위한 탁월한 매수/매도 신호 도구입니다.
신호는 매우 이해하기 쉽고 기본 차트 창에 파란색과 빨간색 점으로 나타납니다.
구매 및 판매 신호: 파란색 점은 매수 신호입니다. 빨간색 점은 매도 신호입니다. 지표의 다양한 설정과 입력 값을 자유롭게 실험해 보십시오.
이 표시기는 모든 통화 쌍(메이저, 마이너 및 엑조틱)에서 동일하게 잘 작동하며 올바르게 사용하면 유망한 결과를 보여줍니다.
거래 팁: 이 스캘퍼 표시기로 거래할 때 자신이 좋아하는 거래 항목, 손절매 및 이익실현 전략을 자유롭게 사용하십시오.
항상 그렇듯이 전체 추세에 동의하고 이 지표를 완전히 이해할 때까지 먼저 데모 계정에서 연습하십시오.
표시기 사양 및 입력: 거래 플랫폼: Metatrader 5(MT5)용으로 개발됨
거래 상품: Forex, 주식, 상품, 주가 지수, 귀금속, 에너지 및 주식에 대한 작업
시

What Is Market Imbalance? Market Imbalance, also known as "IPA" or Improper Price Action, is when price moves so quick in one direction with no orders on the other side of the market to mitigate the price movement. We all know Big Banks, or "Smart Money", can move the market by placing huge orders which in turn can move price significantly. They can do this because Big Banks are the top 10 Forex traders in the world . But unfortunately, the Big Banks cannot leave these orders in drawdown and mu

Ichimoku Trend Alert is the Ichimoku Kinko Hyo indicator with Alerts and signal filters.
Ichimoku Trend Alert features: Optional check of Ichimoku cloud, Tenkan sen(Conversion Line), Kijun sen(Base Line), Senkou span A, Senkou span B, and Chikou span relative to price, and more. Popup, email, and phone notification alerts for selected symbols and timeframes.
There are 9 classic Ichimoku trend filters you can enable/disable in settings: Price/Cloud Order: Checks the price position relative
FREE

All about Smart Money Concepts Strategy: Market struture: internal or swing BOS, CHoCH; Orderblock; Liquity equal; Fair Value Gap with Consequent encroachment, Balanced price range; Level with Previous month, week, day level or in day level (PMH, PWH, PDH, HOD); BuySell Stops Liquidity (BSL, SSL); Liquidity Void Long Wicks; Premium and Discount; Candle pattern ... "Smart Money Concepts" ( SMC ) is a fairly new yet widely used term amongst price action traders looking to more accurately navigate

This indicator is developed based on the multiple session trading to aid in analysis for all the day traders. The indicator supports all currency pairs as well as other trading instruments like indicies, commodities, metals ,etc. The way the indicator work is by making analysis on your behalf. During asian session that's when the indicator does the calculations and provided trading plans in form of areas on the chart for the current day. And this process happens everyday which allows for hands f

XE Forex Strengh Indicator MT5 displays visual information about direction and strength of a signal for current pair and chosen timeframes (M5, M15, M30 and H1). Calculations are based on multiple factors and results are shown as a colored panel with scale bar, numerical values and arrows. There are also displayed values of current price and spread on the pair. There can be activated an alert (as a mail or pop-up window with sound) for each available timeframes which send a message when the dir
FREE

This indicator is stand alone version from MP Pivot Levels (All in one) containing Woodie Pivots. Woodie’s pivot points are made up of multiple key levels, calculated from past price points, in order to frame trades in a simplistic manner. The key levels include the ‘pivot’ itself, and multiple support and resistance levels (usually up to three each). Traders use these levels as a guide for future price movements when setting up trades.
The pivot : (Previous high + previous low + 2 x previou
FREE

This indicator contains Pivot Levels of: Traditional Fibonacci Woodie Classic Demark Camarilla Calculation periods can be set to auto / Daily / Weekly / Monthly / Yearly. Number of Levels are editable. Options to hide level labels and price labels. Pivots Points are price levels chartists can use to determine intraday support and resistance levels. Pivot Points use the previous days Open, High, and Low to calculate a Pivot Point for the current day. Using this Pivot Point as the base, three

Mini One for All Trend Scanner is a trend following multi-symbol indicator that can be used with any input: forex, stocks, commodities,... The panel shows three indicators and six symbols with the trend for every pair (symbol/indicator): up, down or no trend. The indicators are: Average Directional Movement Index (ADX) Moving Average Convergence Divergence (MACD) Relative Strength Index (RSI) You can change quickly the chart by clicking any one of the symbol button in the panel. This feature
FREE

This indicator is stand alone version from MP Pivot Levels (All in one) containing Demark's Pivots.
Calculations: PP = X / 4 R1 = X / 2 - LOWprev S1 = X / 2 - HIGHprev Uses: When the pair currency price may change the direction of movement. Possible constraints of support and resistance that creates plateaus for the currency pair prices. Tendency identification by comparing the present prices according to current day's pivot point and also the prior day's pivot points. ___________
FREE

The Indicator indicator draws 2 clouds based on Keltner indicator values. The upper cloud is formed by the upper lines values and the lower cloud by the lowers lines values. The indicator allows to change the Keltner parameters and the clouds colors the period of the base line and the deviations of each Keltner instance. The indicator holds 5 buffer index as follow: [0] - Outer values of the upper cloud [1] - Inner values of the upper cloud [2] - Base/Center line values [3] - Inner values of
FREE
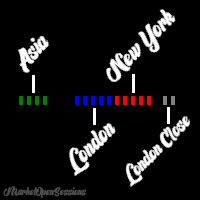
MarketOpenSessions is an indicator helps as a visual clue for which market session is at the time being. If you consider killzone, market open/close as important factor, this indicator would help you reduce effort in converting from one time zone to another. It has the following features 2 display styles: section (as colored line), and histogram 4 major configurable market sessions i.e. Asia, London, New York, and London-Close session. In additional to end of trading session of the day. Female s

The Indicator indicator draws 2 clouds based on Donchian Channels indicator values. The upper cloud is formed by the upper lines values and the lower cloud by the lowers lines values. The indicator allows to change the Channels parameters and the clouds colors the period of the base line and the multiplier of each Donchian Channels instance. The indicator holds 5 buffer index as follow: [0] - Outer values of the upper cloud [1] - Inner values of the upper cloud [2] - Base/Center line values [3
FREE

The Indicator indicator draws 2 clouds based on Envelopes indicator values. The upper cloud is formed by the upper lines values and the lower cloud by the lowers lines values. The indicator allows to change the Envelopes parameters and the clouds colors the period of the base line and the deviations of each Envelopes instance. The indicator holds 5 buffer index as follow: [0] - Outer values of the upper cloud [1] - Inner values of the upper cloud [2] - Base/Center line values [3] - Inner valu
FREE

The Indicator indicator draws 2 clouds based on Bollinger Bands indicator values. The upper cloud is formed by the upper lines values and the lower cloud by the lowers lines values. The indicator allows to change the Bollinger Bands parameters and the clouds colors the period of the base line and the deviations of each Bollinger Bands instance. The indicator holds 5 buffer index as follow: [0] - Outer values of the upper cloud [1] - Inner values of the upper cloud [2] - Base/Center line values
FREE

100 % PER MONTH PROFIT---- MY NEW SIGNAL HERE -------> https://www.mql5.com/en/signals/2162238?source=Site+Signals+My#
The Commodity Channel Index (CCI) measures the current price level relative to an average price level over a given period of time. CCI is relatively high when prices are far above their average. CCI is relatively low when prices are far below their average. Using this method, CCI can be used to identify overbought and oversold levels.
You can set the period of CCI.
The i

My Pivot is an Indicator based on Pivot Lines and Support-Resistance zones. This Indicator will Plot 11 SR zones including Pivot Line which will definitely help you to understand the exact SR zones of the Market.
Steps to Setup the Indicator: Install the Custom Indicator; Set all the Lines Color, Width and Styles; Set visualization to All Timeframe; and DONE
It can be used for: All Pairs: Forex, Cryptocurrencies, Metals, Stocks, Indices. All Timeframe All Brokers All type of Trading

My Trendline is an Indicator based on Upper and Lower Trendline which will Plot Automatically into the Chart. This Indicator will perfectly indicate you the Trend of the Market. It can be use in any Time Frame. The Indicator will automatically adjust according to the Current Time Frame.
Steps to Setup the Indicator: Install the Custom Indicator; Set all the Inputs, Line Color, Width and Styles etc. (Can use the Default Setting also); Set visualization to All Timeframe; and DONE
It ca
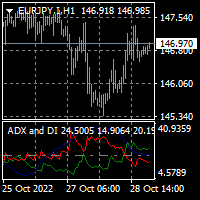
To download MT4 version please click here . This is the exact conversion from TradingView indicator: "ADX and DI" By " BeikabuOyaji". This is probably the most popular implementation of Average Directional Index available. This indicator lets you read the buffers as below: index 0: DIPlusBuffer ==> Green Line by default index 1: DIMinusBuffer ==> Red Line by default index 2: ADXBuffer ==> Navy Line by default - You can message in private chat for further changes you need. Note: This is a non-rep

CoioteOscilator é um rastreador de tendência e padrões de estruturas gráficas. O Indicador é composto de 3 elementos. oscilador principal lento: histograma com nível de 0 até 50 e 4 cores, 2 compradoras, de 0 até 30 e acima de 30 e duas vendedoras, de 0 até 30 e acima de 30. oscilador principal rápido: linha magenta com nível de -50 até 50. gatilho: linha amarela com nível de -50 até 50. O oscilador principal lento é um rastreador de tendência primaria.
O oscilador principal rápido é

KT Trend Exhaustion is our personal implementation of the famous Trend Exhaustion Index developed by Clifford L. Creel, Ph.D., in 1991.
The change in price direction often comes with uncertainty. TEI helps to tackle the uncertainty by showing a crisp direction using the smoothed color-changing index.
Features
Easy to use and interpret. It comes with a multi-timeframe scanner that scans the upcoming signals across all the time-frames. It can be used as an entry signal or trend confirmation

KT Know Sure thing is a momentum oscillator based on the smoothed rate of change over four different timescales and was developed by Martin Pring. In 1992, Pring published the initial description of the indicator in Stocks & Commodities magazine's "Summed Rate of Change (KST)" article. KST creates a momentum oscillator by combining the price momentum measurements from four different price cycles. Traders can utilize KST to search for bullish or bearish divergences, signal line crossovers, and ce
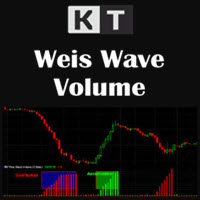
The KT Weis Wave Volume is a technical indicator based on the current market trend and description of the price movement's direction. The indicator is based on volume and displays the cumulative volumes for price increases and decreases in the price chart.
In addition, the indicator window shows a histogram of green and rising red waves.
The green color represents upward movement; the more the price rises, the larger the green volume. The red color represents a decreasing wave; the larger t

KT Forex Line can be described as an improved version of the moving average indicator. The indicator is embedded in the main trading chart and features a line that switches between blue and white depending on the prevailing direction or mood of the market.
Utilizing the indicator is simple. You do not need to understand complex graphs and intricate lines. Recognize the indicator line's color and trade accordingly.
Key Features
The indicator has customizable colors, with the blue and red b

The KT Market Speed is a unique and straightforward oscillator-based technical analysis tool that helps traders visualize the speed at which the price of an instrument changes based on the preset length. The Market Speed representation helps correctly map the price momentum: is it moving fast, slowing down, or trapped in a range? These are the questions the indicator answers, giving traders more bandwidth to execute better-informed trade positions.
Formula
It's a simple technical analysis t

KT Forex Super Scalper is created to identify market trends and plot trade signals based on the direction of the predetermined trend. It functions very similarly to moving averages but reacts quickly to changes in price actions and can signal right away once a valid trend is confirmed. The quick reactionary feature makes it a valuable tool for scalpers. However, anyone familiar with moving averages can use it for actual trading because of its signaling process and chart demonstration simplicity

The double top bottom pattern is arguably one of the technical analysis's most popular chart patterns. These patterns are used to capitalize on recurring patterns and identify trend reversal patterns, thereby creating well-placed entry and exit levels. The KT Double Top Bottom is based on these patterns and fine-tunes the trade signal development process for traders.
Features
It's based on one of the most reliable trading patterns and brings some fine-tuning and automation to the process. A

20 Pips per trade - Componding strategy,
This indicator will send you alerts when certain conditions are met together with entry price as well as exit prices. Al you have to do is take the trade with proper risk management. The compounding strategy works as follows :
Trade Pairs : This indicator will work best on any currency pairs but has been optimized for the follow : , EUR/AUD, EUR/CAD, GBP/AUD, GBP/USD. Using this indicator on other trading instruments will work but is not advised. Co

다중 시간 프레임 이동 평균 OSW
(메타트레이더 5)
이 표시기를 사용하면 모든 유형의 구성에 대한 이동 평균을 추가할 수 있습니다. 단, 시간 프레임에 있는 경우 더 높은 수준에서 추가할 수 있다는 차이점이 있습니다(예: 5분 시간 프레임에 있는 경우). 15분, 1시간, 4시간의 시간성 20의 이동 평균 지수를 보고 싶다면 지표 메뉴에서 올바른 매개변수를 구성해야만 지표 이미지에 표시된 대로 볼 수 있습니다. 다중 시간 프레임 이동 평균 OSW
(메타트레이더 5)
이 표시기를 사용하면 모든 유형의 구성에 대한 이동 평균을 추가할 수 있습니다. 단, 시간 프레임에 있는 경우 더 높은 수준에서 추가할 수 있다는 차이점이 있습니다(예: 5분 시간 프레임에 있는 경우). 15분, 1시간, 4시간의 시간성 20의 이동 평균 지수를 보고 싶다면 지표 메뉴에서 올바른 매개변수를 구성해야만 지표 이미지에 표시된 대로 볼 수 있습니다.
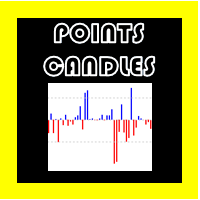
포인트 캔들 OSW
(메타트레이더 5)
이 지표를 사용하면 차트에서 처리되고 있는 각 양초의 크기를 포인트 단위로 알 수 있으며 각 양초의 크기와 방향에 대한 정보를 제공합니다. 지표는 강세일 경우 위를 가리키고 약세일 경우 아래를 가리킵니다. . 또한 모든 양초를 숨기거나 표시할 수도 있습니다. 강세만 또는 약세만 표시할 수 있습니다. 이는 Deriv와 같이 한 방향으로 더 강한 양초를 제공하는 자산을 관리하는 중개인을 위한 것입니다. 브로커가 정상인 경우 이렇게 해서는 안됩니다. 개발할 전략이 없다면? 포인트 캔들 OSW
(메타트레이더 5)
이 지표를 사용하면 차트에서 처리되고 있는 각 양초의 크기를 포인트 단위로 알 수 있으며 각 양초의 크기와 방향에 대한 정보를 제공합니다. 지표는 강세일 경우 위를 가리키고 약세일 경우 아래를 가리킵니다. . 또한 모든 양초를 숨기거나 표시할 수도 있습니다. 강세만 또는 약세만 표시할 수 있습니다. 이는 Deriv와 같이 한
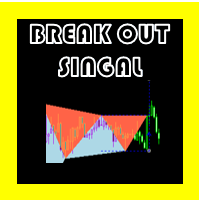
브레이크 시그널 OSW
(메타트레이더 5)
최고점과 최저점을 깨고 일하고 싶습니까? 이는 이러한 유형의 항목에서 신호를 받는 데 완벽한 지표입니다.
지표가 시작되자마자 어떤 신호도 표시하지 않지만 가격이 상승함에 따라 완벽한 패턴을 찾을 때까지 시장을 읽을 것입니다.
최고점과 최저점을 읽는 지표는 지그재그를 위한 특별한 구성을 가지고 있어 가장 적합한 것만 취할 수 있습니다.
다른 지표와 마찬가지로 완벽한 항목을 제공하지는 않지만 결과적으로 제공하는 많은 항목이 승자이며 우수한 기술적 분석과 함께 매우 좋은 결과를 제공합니다.
강세 항목은 파란색으로, 약세 항목은 빨간색으로, 각 항목에는 제안된 손절매 및 이익실현이 있으며, 읽을 수 있도록 버퍼가 완벽하게 구성되어 있고 신호 알림을 켜고 끌 수 있습니다.

The indicator represents the session boxes for the Asian, European and American sessions. It is possible to change the time of each session, such as color. It is also possible to disable the display of each session. You will find in input parameters variables to modify in format hh:mm. In Colors tab you can change the color of boxes of each sessions. If you need some implementations please contact me.
FREE

What is the Volume Weighted Average Price (VWAP)? The volume weighted average price (VWAP) is a trading benchmark used by traders that gives the average price an instrument has traded at throughout the day, based on both volume and price. It is important because it provides traders with insight into both the trend and value of the instrument.
What is the Difference between VWAP and AVWAP? While VWAP is having as starting point the beggining of the day,week,month etc. in the AVWAP you can p

Magic Trend
This MT5 indicator is a Moving Average with 3 signal colors. The 3 input parameters on this Indicator give you a chance to set any Moving Average of choice. A combination of 2 different exponential moving averages, relative strength index, commodity channel index, and William's percent range provide the signals.
White color = Null/No/Exit Signal Green color = Buy Signal Red color = Sell Signal
Point To Note: Confirm the color change only after the current candle closes to avo
FREE

Watch permanently the strength of all majors! The strength is shown through horizontal bars in the top left corner. Additionally you get a recommendetation which pair is currently the strongest/weakest and should therefore be bought or sold. Simple and easy! I use this indicator in my own expert advisor - but I will probably NOT publish this expert advisor! Sorry guys!

To download MT4 version please click here . - This is vortex indicator. - It is used to detect trend strength and direction. - It consists of two line(buffers). ==> VIM and VIP - There are three types of signals related to this indicator: 1. crossing VIM and VIP 2. threshold on distance between VIP and VIM 3. VIP above VIM vice versa. - This is a non-repaint indicator with light processing.
FREE

For MT4 version please click here . This is the exact conversion from TradingView: "Range Filter 5min" By "guikroth". - This indicator implements Alerts as well as the visualizations. - Input tab allows to choose Heiken Ashi or Normal candles to apply the filter to. It means it is a (2 in 1) indicator. - This indicator lets you read the buffers for all data on the window. For details on buffers please message me. - This is a non-repaint and light processing load indicator. - You can message in p
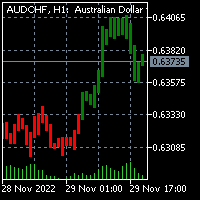
To download the MT4 version of Donchian Candles please click here . You may also check this link . This is inspired by TradingView: "Donchian Trend Ribbon" By "LonesomeTheBlue". This indicator merges Ribbon data into chart Candles. The result is one of the coolest indicators out there to detect trend direction and strength. As a trader you always need such indicator to avoid getting chopped in range markets. - You can message in private chat for further changes you need. The indicator is l

Keltner Channels (ou Canais de Keltner ) é mais um indicador de volatilidade utilizado pela análise técnica. Também chamado de envelope , esse canal foi criado por Chester Keltner para monitorar os seus investimentos no mercado futuro de café na década de 1960. Porém, com o passar do tempo, passou também a ser utilizado para outros ativos e, atualmente, é uma das ferramentas mais utilizadas pelos traders. Nesta versão customizada foram adicionados novas opções de método de média movel

A Média Móvel é um indicador que faz parte da Análise Técnica. Com ela, é possível identificar o equilíbrio dos preços no mercado, observando tendências de alta, neutra ou baixa. Este indicador customizado traz opções extras pera definir o método de cálculo podendo-se esclolher entre SMA,EMA,SSMA,LWMA,JJMA,JurX,ParMA,T3,Vidya,AMA,HULL MA. Também conta com varias opções para escolher o método de cálculo para o preço base a ser usado no cáculo da média.
This Renko is: Live : constantly updated on the market prices Dynamic : updating on each new ATR value Backtestable : Generating the chart during backtest, allowing Real Ticks Accuracy and Time Period Accuracy Guppy Built-in : GMMA with 12 EMA built-in This is what you are looking for! RENKO A Renko chart is a type of chart, developed by the Japanese, that is built using price movement rather than both price and standardized time intervals like most charts are. It is thought to be named a

How to use?
• Buy Low and Sell High.
• Brighter zones means strong Support or Resistance.
• Weaker zones appear lighter.
• Brighter zones are formed by overlapping of lines from multiple levels of support or resistance.
Indicator Menu
• The indicator can input 5 different Lengths.
• The default settings uses 13, 21, 52, 100 & 200.
• Every option are customizable.

Multiple Timeframe MACD indicator. This indicator was built for making multiple timeframe analysis possible in MT5 using MACD Indicator. MACD Indicator traditionally shows two lines and one histogram. MACD Line(Yellow) is calculated by subtracting 12period EMA(fast) from 26period EMA (slow). Signal Line(Blue) is created by a 9period EMA from MACD Line. Histogram is just the difference between MACD and Signal lines. Histogram is colored based on the difference between its value and the previous h

지원 및 저항 구역 표시기 MT5 이 표시기는 상단과 하단을 자동으로 식별하는 방법을 알고 있습니다. 이 지지선과 저항선 표시기는 상단과 하단을 기준으로 지지선과 저항선을 만듭니다. 지지선과 저항선을 만드는 방법. 자동 지지선과 저항선을 만드는 지표입니다. 지표로 지원 수준을 찾는 방법 이 표시기는 자동으로 상단과 하단을 찾습니다. 지그재그(ZigZag)가 자동으로 바닥을 생성하거나 새로운 바닥을 이전 바닥보다 낮게 만들 때마다 표시기가 자동으로 지지선을 생성하므로 표시기가 자동으로 화면에 자동 지지선을 그립니다. 저항선을 만드는 방법. 지그재그(ZigZag)가 새로운 최고점이나 최고점을 이전 최고점보다 높게 만들 때마다 표시기가 지지선을 생성하는 것과 같은 방식으로 자동으로 저항선을 생성하므로 표시기가 자동으로 새로운 저항을 생성하므로 사용자가 상단과 하단 레벨이 어디에 있는지 걱정해야 합니다. 이 지표는 트레이더가 차트에 지지와 저항을 표시할 수 있는 쉬운 방법입니다. 상단 표시
FREE

Gartley Hunter Multi - An indicator for searching for harmonic patterns simultaneously on dozens of trading instruments and on all possible timeframes. Manual (Be sure to read before purchasing) | Version for MT4 Advantages 1. Patterns: Gartley, Butterfly, Shark, Crab. Bat, Alternate Bat, Deep Crab, Cypher
2. Simultaneous search for patterns on dozens of trading instruments and on all possible timeframes
3. Search for patterns of all possible sizes. From the smallest to the largest
4. A

이 지표는 트레이더가 시장의 방향을 식별하는 데 도움이 되도록 개발되었습니다. 트레이딩에는 세 가지 유형의 움직임과 UPTREND, DOWNTREND 및 SIDEWAYS가 있습니다. 사이드웨이 시장 움직임은 대부분의 트레이더가 갇히는 곳입니다. 통합, 이것은 단순히 방향이 없음을 의미합니다. 스캘퍼에게 이것은 자산 클래스가 이 기간에 있는 시기를 식별하는 방법을 알고 있는 경우에만 이점이 될 수 있습니다.
추세를 식별하기 위해 괭이를 개발하려는 시도는 이 지표의 모든 것입니다. 가격이 녹색 점 위에 있을 때 고수하고 2개의 연속 점이 발생한 후 매수 거래를 하거나 가격이 빨간색 점 아래에 있을 때 매도 포지션에 집중합니다. .
내가 이 지표에서 한 것은 시장이 범위 내에 있을 때, 가격이 빨간색 점 아래에 있지 않을 때, 가격이 녹색 점 위에 있지 않을 때 판매하지 않는 것, 구매하지 않는 것을 피하는 것입니다.
내 항목의 대부분은 가격이 점보다 높을 때까지 기다린 다음
FREE
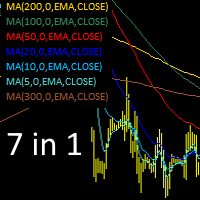
Moving Average indicators - 7 in 1. Installing 7 indicators at once, setting their parameters and properties. The indicators used (with basic properties) are shown in the upper left corner of the chart. When you click on the properties, the indicator turns on (activates) or turns off. The properties of the active indicator are displayed by its color. The properties of a disabled (not active) indicator is grayed out.
In the ind_ma indicator parameters: 1. Display the indicator on the chart (yes

지표 소개:
지표는 추세선과 히스토그램을 그립니다. 가격 지연이 적고 미래 기능이 없으며 신호가 표류하지 않습니다. 시장이 지역간 변동을 보일 때 표시기가 빨간색과 녹색 히스토그램으로 나타나면 저가 구역이고, 표시기가 자홍색과 노란색 히스토그램으로 나타나면 고가 구역입니다. 또한 고가 및 저가 영역에 따라 시장의 추세를 분석하는 데 사용할 수 있습니다. 표시기 이전 k 라인에 위쪽 화살표 또는 아래쪽 화살표가 있을 때 이 신호를 사용하여 때때로 거래할 수 있도록 편의를 제공하기 위해 이메일, 경고 및 알림을 보낼 수 있습니다. 표시기에는 히스토그램의 높이, 선의 기간 및 비율을 포함하여 변경 가능한 매개변수가 있습니다. 모든 시간대에 적용되며 M1 이상의 시간대에 적합합니다. 표시기의 작업은 스크린샷에 나와 있습니다. 이 표시기가 거래에 도움이 되기를 바랍니다.
FREE
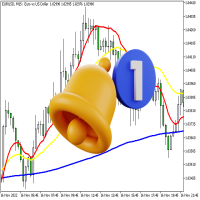
표시기는 세 개의 선을 표시하고 두 가지 유형의 교차점을 모니터링합니다. 표시기의 세 줄: " MA " - 느린 표시기 "이동 평균", " DEMA 느린 " - 느린 표시기 " 이중 지수 이동 평균" 및 " DEMA 빠른 " - 빠른 표시기 "이중 지수 이동 평균". 두 가지 유형의 교차로 : " Alert Price MA " - 가격이 "MA" 라인을 교차하고 " Alert DEMA DEMA " - 라인이 교차합니다. "DEMA 슬로우" 및 "DEMA 패스트 ". 건널 때 다음 옵션을 사용할 수 있습니다. 소리 이름 - 확장자가 있는 파일 이름(예: "alert.wav"), 이 파일은 터미널의 "Sounds" 폴더에 있어야 합니다. 예를 들어 터미널이 "C" 드라이브에 있는 경우 소리는 "C:\Program Files\MetaTrader 5\Sounds"입니다. 반복 - 한 마디 내 반

Are you tired of missing out on trading opportunities by not being able to identify price reversals in time? Do you want to maximize your profits and make informed trading decisions? Introducing the Reversal Vol Propagation Indicator, the revolutionary tool that uses neural networks and volume data to predict potential price reversals. Based on a powerful combination of advanced algorithms and cutting-edge technology, the Reversal Vol Propagation meticulously analyzes volume patterns and past pr

Moving Average Trend Alert is a triple MA indicator that helps traders to identify potential market trends based on 3 MAs alignment and crossover.
Moving Average Trend Alert features: Customizable short-term, medium-term, and long-term MAs. Option to filter signals based on a minimum distance between moving averages to avoid premature MAs alignment. Optional Filter of signals with RSI indicator overbought/oversold levels. Optional Filter of signals with ADX indicator. Popup, email, and phone n
FREE

The Indicator show Daily Pivot Points. It is possible to specify the number of days to display. For forex it doesn't consider the sunday session data. It is possibile to modify the color, style and width for every level. It is better to use this indicator with timeframe not higher than Н1. 4 Levels of support and resistance with also Intermediate Levels that is possible to hide.
FREE

Indicator introduction: The indicator draws wave lines and histograms, It has small price lag, and the signal will not drift. The indicator can send emails, alerts and notifications to you when previous k line has an up arrow and it is under the histogram sections or it has a down arrow. you can choose whether or not to send the two kind of alerts, the alerts repetition times can also be changed. If the indicator appears red and green histograms, this is a buy zone. It can be used to analyze mar
FREE

Indicator introduction:
The indicator is calculated by volumes and prices, It is a single side indicator, only has up arrow signals. It is better to use it in conjunction with other trend indicators, and you need to find the most efficient time to use it in order to acquire a high winning probability. The indicator can send emails, alerts and notifications to you when the indicator before k line has an up arrow. The indicator's parameters can be changed, including the computation period of the
FREE
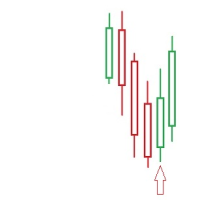
- simple Price Action Indicator - we recommend it for CURRENCY and GOLD Trades - NON Lagging ! the Alert shows instantly whats happening --> thats why the ARROW appears at the MOMENT the REVERSAL-Candle gets EXCEEDED
SETUP: - recommended SETUP is: 3 Candles bullish or bearish --> can easily be adjusted - user defined more than 4 is NOT recommended --> 50/50 its a heavy move going on - recommended Timeframe: M30 (we strictly recommend M30 ONLY!) - VOLUME Check? (last 2 tre

- simple Price Action Indicator - a 3 Candle Pattern (1. Direction-Candle / 2. the TRAP / 3. Trigger-Candle) BUT every Signal needs ATTENTION to check for a clean Range - NON Lagging ! the Alert shows instantly whats happening - recommended SETUP is: - there is a VOLUME-Filter (in points for the 1. candle ) to avoid alerts with tiny Candles during a NON-VOLUME-Time - 10% off the Boobietrap-Candle as the ALERT-Level --> can easily be adjusted - user defined - recommended Timeframe: M30 (we
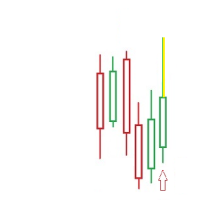
- simple Price Action Indicator - NON Lagging ! the Alert shows instantly whats happening - there is a VOLUME-Filter (Candle-Size in points) to avoid alerts with tiny Candles during a NON-VOLUME-Time plus you have a RANGE-Filter-Option (to make sure you get only the highest/lowest within that RANGE!) - recommended SETUP is: 25-30% Wicksize ( means the %percentage of the whole Candle) bullish or bearish --> can easily be adjusted - user defined - recommended Timeframe: M30 (with some experience
Adrian MOROSAN (2011) examined the same set of data using both traditional and modified RSI. He also incorporated trading volume in the method's calculating formula. Finally, findings acquired using the indicator's traditional form will be compared to those obtained using the modified version. He found that, in comparison to the original form, his version resulted in a greater advantage when a different, even opposing interpretation was used. And, in the alternative case, it resulted in much lar
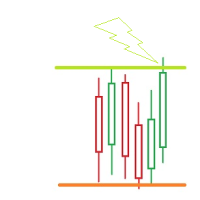
- simple PRICE Action Indicator/ Tool - SELF-Adjusting - you choose the UPPER Border of your RANGE ( Resistance) - you choose the LOWER Border of your RANGE ( Support) # Alert happens when the PRICE TOUCHes 1 of these Borders # (we release a CLOSED above/below - Version too) - popup Alert or custom sound - PUSH notification ( no email - that tool is for quicker action) - once a Border got hit --> it doesnt disappear --> it goes a selectable amount of POINTS ( RANGE(new) ) above/b
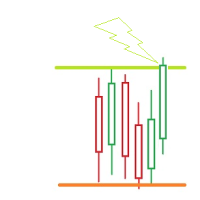
- simple PRICE Action Indicator/ Tool - SELF-Adjusting - you choose the UPPER Border of your RANGE ( Resistance) - you choose the LOWER Border of your RANGE ( Support) # Alert happens when the PRICE CLOSES above/below 1 of these Borders # (we released a TOUCH - Version too) - popup Alert or custom sound - PUSH notification - eMAIL notification - once a Border got crossed(closed candle! )--> it doesnt disappear --> it goes a selectable amount of POINTS ( RANGE(new) ) above/below t

This indicator is based on a mathematical formula which gives you the possibility to seek and find the right frequency of the movement, and to determine its key level; just adjust the frequency parameter! Simple and highly effective; using this indicator you can easily predict the next support and resistance levels of the day. Also, this indicator determines the range and the next two importants levels of the movement outside this range so far. SGFL3 and RGFL3 are levels with high certainty
MetaTrader 마켓은 거래 로봇과 기술 지표들의 독특한 스토어입니다.
MQL5.community 사용자 메모를 읽어보셔서 트레이더들에게 제공하는 고유한 서비스(거래 시그널 복사, 프리랜서가 개발한 맞춤형 애플리케이션, 결제 시스템 및 MQL5 클라우드 네트워크를 통한 자동 결제)에 대해 자세히 알아보십시오.
트레이딩 기회를 놓치고 있어요:
- 무료 트레이딩 앱
- 복사용 8,000 이상의 시그널
- 금융 시장 개척을 위한 경제 뉴스
등록
로그인
계정이 없으시면, 가입하십시오
MQL5.com 웹사이트에 로그인을 하기 위해 쿠키를 허용하십시오.
브라우저에서 필요한 설정을 활성화하시지 않으면, 로그인할 수 없습니다.