MetaTrader 5용 새 기술 지표 - 11
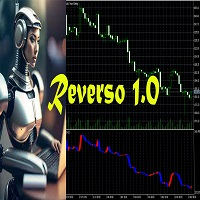
Reverso 1.0 est un Indicateur Technique basé sur la tendance. Cet Indicateur intègre une formule exceptionnelle qui permet de décider au croisement du signal et du prix de clôture d'entrer dans le marché.
Le timeframe indiqué est compris entre 2H et 1D.
Les symboles que je conseille sont les suivants:
BTCUSD-ETHUSD
XAUGBP-XAUEUR-XAUAUD-XAGEUR-XAUUSD
NZDJPY-GBPUSD-EURJPY-GBPJPY-USDJPY-CHFJPY-CADJPY-AUDJPY

ParabolicSAR is a multi-currency professional Expert Advisor that uses a variety of trading strategies in the foreign exchange market. Each of the individual strategies has gone through many years of development and testing on quotes with 100% simulation. Thanks to the use of several strategies for each currency pair, the Expert Advisor is successfully tested with 100% simulation of quotes over a long period of time. IMPORTANT! After the purchase please send me a private message to receive

note: this indicator is for METATRADER4, if you want the version for METATRADER5 this is the link: https://www.mql5.com/it/market/product/108106 TRENDMAESTRO ver 2.4 TRENDMAESTRO recognizes a new TREND in the bud, he never makes mistakes. The certainty of identifying a new TREND is priceless. DESCRIPTION TRENDMAESTRO identifies a new TREND in the bud, this indicator examines the volatility, volumes and momentum to identify the moment in which there is an explosion of one or more of these data a

이 지표는 클래식 MACD와 지그재그 지표를 결합하여 가격과 지표 간의 차이를 감지합니다. 또한 첨단 인공지능(AI) 기술을 사용해 발산의 타당성을 탐지한다.
MACD는 '지표의 왕'으로 알려져 있으며 지그재그도 매우 유용한 지표입니다. 이 두 지표를 결합함으로써 이 지표는 두 지표의 장점을 모두 활용합니다.
발산의 탐지는 확률론적 문제이다. 종종 차이가 발생하고 이어서 같은 방향으로 가격이 추가로 이동하는 경우가 있습니다. 따라서 우리는 고급 AI 기술을 사용하여 발산의 유효성을 판단하고 유효하지 않은 발산을 필터링한 다음 다양한 방법으로 사용자에게 경고하려고 합니다. 할인 가격:59$ 특징 * MACD 형식의 지그재그 표시기 * 가격과 MACD 지표 간의 차이를 감지합니다. * AI 기술을 사용하여 발산의 타당성을 감지합니다. * 사용자에게 발산 신호를 경고합니다. * 휴대폰을 통해 사용자에게 발산 신호를 경고합니다. * 이메일을 통해 사용자에게 발산 신호를 경고합니다.

정밀 거래 시스템의 PTS Demand Index 코드
Demand Index는 James Sibbet의 창조물이며 볼륨과 가격을 조합으로 해석하는 작업을 간단하게 만들기 위해 복잡한 코드를 사용합니다.
볼륨을 이해하는 것은 쉬운 작업이 아니지만, 이 아름다운 프로그래밍 조각은 작업을 훨씬 쉽게 만듭니다.
이 지표가 거래자와 투자자에게 어떻게 혜택을 줄 수 있는 몇 가지 방법이 있습니다.
다이버전스 (선행 지표로) 여러 해 동안 다양한 기술 지표를 연구한 결과, Demand Index는 의미 있는 다이버전스를 찾는 데 한몫하는 것 중 하나라는 의견을 형성했습니다.
시장 가격이 새로운 고점을 찍고 Demand Index가 아닌 경우 이를 악재 다이버전스라고 합니다. 웹 사이트에는 어떤 것을 찾아볼 지 이해하기 위해 극단적인 다이버전스 사례를 보여주는 강렬한 사진이 여러 장 있습니다. 다이버전스의 차이가 클수록 추세 변화 이벤트를 예측하는 데 중요한 지표가 됩

Trader! Don't you want to spend all day on your computer screen looking at quotes?
And do you want to receive stock buying/selling tips based on one of the most used indicators in FOREX on your cell phone?
Then discover the Vegas Tunnel
Support and product questions at the link below:
Support
This indicator searches for Buy and Sell SIGNALS in Stock Exchange Assets. It works on any asset on the market.
Select in the parameters which Fibonacci line the signal will be sent a

This indicator provides the ability to recognize the SMC pattern, essentially a condensed version of the Wyckoff model. Once the pattern is confirmed by RTO, it represents a significant investment opportunity. There are numerous indicators related to SMC beyond the market, but this is the first indicator to leverage patterns to identify specific actions of BigBoy to navigate the market. The SMC (Smart Money Concept) pattern is a market analysis method used to understand the behavior of "smart

The Datasource AC indicator is a technical analysis tool developed by the author based on the Accelerator Oscillator. Everyone knows the general principles of working with the AC indicator. Therefore, I will not describe them separately. I will focus on differences.
Differences are a purely technical implementation and expanded indicator. An important feature is that the indicator does not change its values even when using the closing price, since the indicator uses the safe calculation algor

This is a multi-timeframe indicator that detects and displays support and resistance (S&R) lines using the ZigZag indicator.
Features
The support and resistance lines are not redrawing. The indicator is capable of adding new support and resistance levels as they appear. Each S&R line has a tooltip that displays the price level and start time. Shows the start time, price level and number of touches of all S&R lines when pressing the shortcut Shift+I Save time for multi-timeframe analysis on

V-Flow is a Trading System that takes into account volume, flow and other factors to give a signal when to enter, hold and close a position. There are two trading modes: conservative and aggressive . CONSERVATIVE: In this mode, the system shows you when to trade by painting the graph according to the signal (buy or sell). After that, when the trend ends, the graph turns gray, indicating the time to exit the operation. However, if the histogram at the bottom still points to the same trend, it is

This indicator is great for trading on various trading pairs. The indicator itself uses mathematical linear strategies of augmented accuracy. It has many additional signals and basic signals. Many settings can be configured in the initial settings. There are lines and arrows on the graph for visualization. He displays his decision on a graph in the form of icons, text, and colored lines. There are only two types of main icons. In the tester it works fine by default in the settings. It is alread

--- StudentK Ict Smc Structure --- 1. Inner Circle Trading
2. Smart Money Concept
3. Structure
--- What are included in tool --- 1. Market Session Box
2. Kill Zone
3. High/Low
4. Imbalance
5. FU Candle
6. Thicker Wick + Doji Candlestick
7. StudentK's Structure Line
8. Pivot Point
--- Context --- StudentK is not indicated as a master or K Sir for knowledgeable person who claims for winning all the time. (But lots of traders should know the fact that it is rarely truth, especially

This is just a ADX with multi symbols, multi timeframes, and colors. features. different symbols and timeframes from the main chart. draw ADX and ADX moving average. easy to identify if ADX is above 25 or not. e asy to identify if ADX is above moving average or not. easy to identify the direction of the trend by color, not by DI line. unnecessary DI lines can be erased
FREE
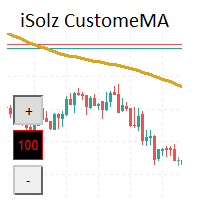
Finding the BEST Setting for your Strategy is always tough and time spending if your Strategy is using Moving Average. You need to change Period setting every time and then look on chart and repeat this until you find or you get Tired.. But Now you can find that soon and spend Extra time and Enjoy.
1. On chart buttons to change Period of MA 2. You can place multiple MA lines just by Change of Prefix in new Indicator Settings
FREE

Introducing the "Bull vs Bear Price Strength Oscillator" Indicator: Your Key to Smart Trading Decisions! Are you looking for a trading tool that can provide you with a clear and visual representation of price trend strength? Look no further! The Price Strength Indicator is here to transform the way you analyze the markets and make trading decisions. Uncover Hidden Market Strength: The Price Strength Indicator is designed to help you assess the market's momentum with ease. It does this by evaluat

This MetaTrader 5 indicator helps traders by identifying and marking two important levels on the chart:
1. Previous Day's High (PDH):
- The highest price reached in the market during the previous trading day.
2. Previous Day's Low (PDL):
- The lowest price reached in the market during the previous trading day.
How it Works:
1. Initialization:
- When you attach the indicator to a chart, it initializes by calculating the PDH and PDL based on the highest and lowest prices of
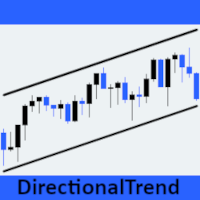
방향성 추세 트레이딩 인디케이터는 금융시장 추세를 명확하고 정확하게 볼 수 있도록 설계된 혁신적인 도구입니다. 이 지표는 과거 시장 데이터를 기반으로 특정 기간 동안 시장이 움직이는 일반적인 방향을 식별하고 표시합니다. 주요 목표는 시장의 지배적인 추세에 대한 명확한 신호를 제공하여 트레이더가 정보에 입각한 결정을 내릴 수 있도록 돕는 것입니다. 직관적 인 인터페이스로 설계된이 지표는 이해하고 사용하기 쉬우므로 모든 경험 수준의 트레이더에게 적합합니다. 신호가 차트에 명확하게 표시되므로 정보에 입각한 결정을 쉽게 내릴 수 있습니다. 트레이더는 진입 및 청산 신호 확인, 추세 반전 지점 식별, 손절 및 이익실현 수준 설정 등 다양한 방법으로 DirectionalTrend를 사용할 수 있습니다. 이 도구를 차트 분석에 통합하면 트레이더는 더 많은 정보에 입각한 결정을 내리고 시장에서 수익성을 높일 수 있습니다. 직관적이고 사용하기 쉬운 사용자 인터페이스를 갖춘 이 인디케이터는 모든 경
FREE

PTS - Precision Trading Systems의 Divergence Buy Finder
Precision Divergence Finder는 시장 바닥을 핀포인트 정확도로 찾아내도록 설계되었으며 이를 자주 수행합니다.
기술적 분석에서 바닥을 고르는 기술은 일반적으로 정상을 선택하는 것보다 훨씬 쉽습니다. 이 항목은 정확히 이 작업을 위해 설계되었습니다. 상승 Divergence가 식별되면 구매하기 전에 트렌드가 반등할 때 기다리는 것이 현명합니다. 10 또는 20 바 높음을 사용하거나 이전 바의 이동 평균 15-30이 상승하는 것을 식별하기 위해 사용할 수 있습니다.
복잡한 알고리즘은 실시간 바 단위로 활성 Demand Index(DI) Divergence 수를 찾아내고 계산합니다.
모델은 시장 가격이 새로운 최저점을 기록하고 Demand Index가 새로운 최저점을 기록하지 않을 때 Divergence를 발생시키는 것을 관찰합니다.
이 지표는 두 가지

프리시전 트레이딩 시스템의 로저 메드칼프에 의한 프리시전 인덱스 오실레이터 (Pi-Osc)
버전 2는 차트에 신속하게 로드되도록 주의 깊게 다시 코딩되었으며 경험을 향상시키기 위해 몇 가지 다른 기술적 개선 사항이 통합되었습니다.
Pi-Osc는 정확한 거래 타이밍 신호를 제공하도록 개발되었으며 시장이 모든 사람의 스톱을 청산하기 위해 가야 하는 극도의 고갈 지점을 찾는 데 목적이 있습니다.
이 제품은 극단적인 지점이 어디에 있는지 알고 있는 고전적인 문제를 해결하며 트레이더로서의 삶을 훨씬 간단하게 만듭니다.
이것은 업계 표준 오실레이터와는 상당히 다른 강력한 차이점을 가지고 있는 고도로 복잡한 합의 지표입니다.
사용하는 기능 중 일부는 수요 지수, 자금 흐름, RSI, 스토캐스틱, 패턴 인식, 거래량 분석, 표준 편차 극단점 및 다양한 길이에서 위와 유사한 변형을 갖습니다.
미숙한 눈에는 다른 오실레이터와 비슷해 보일 수 있지만 RSI 또는 모멘텀과 같은 다

MultiFractal 은 수정된 Bill Williams 프랙탈 표시기로, 시간 프레임을 변경하는 것과 유사하게 크기 차이가 4인 고차 프랙탈로 보완됩니다. 원래 터미널 표시기에 비해 장점: 편의 시계 정보 내용 이 지표는 작업할 때 다른 기간으로 전환할 필요가 없기 때문에 편리합니다. 가시성 - 하나의 차트에서 소규모 시장, 중규모 시장, 대규모 시장 움직임까지 차트의 구조를 볼 수 있습니다. 정보 내용 - 시각적으로 그래픽에 대한 더 많은 정보를 얻습니다. 이제 MultiFractal 지표를 기반으로 하거나 기반으로 하는 모든 거래 전략에는 추가 신호가 있습니다.
또한, 아시다시피 프랙탈은 지지선과 저항선의 역할을 할 수 있습니다. 그리고 일부 거래 전략에서는 유동성 수준을 표시합니다. 거래에서 큰 이익을 얻으시기 바랍니다.

Market Noise 시장 노이즈는 가격 차트에서 시장 단계를 결정하는 지표이며, 축적 또는 분산 단계가 발생할 때 분명하고 부드러운 추세 움직임과 시끄러운 평탄한 움직임을 구별합니다. 각 단계는 자체적인 거래 유형에 적합합니다. 추세를 따르는 시스템에서는 추세를 따르고, 공격적인 시스템에서는 플랫합니다. 시장 소음이 시작되면 거래 종료를 결정할 수 있습니다. 마찬가지로, 소음이 끝나자마자 공격적인 거래 시스템을 꺼야 합니다. 누군가는 두 가지 유형의 거래 전략을 서로 전환하면서 거래할 수 있습니다. 따라서 이 지표는 거래 결정 분야에서 훌륭한 조력자 역할을 합니다. 모든 가격 변동은 선택한 기간 동안의 일반적인 가격 변동과 해당 기간 내 가격 변동 형태의 노이즈라는 두 가지 구성 요소로 나눌 수 있습니다. 동시에, 서로 다른 기간의 서로 다른 시장은 잡음과 추세 구성 요소 사이의 광범위한 상호 관계를 보여줄 수 있습니다(그림 1). 가격 변동의 소음 수준이 높을수록 기본 추세의

Magic Channel Scalper 는 MetaTrader 5 터미널의 채널 표시기입니다. 이 지표를 사용하면 가장 가능성이 높은 추세 반전 지점을 찾을 수 있습니다.
대부분의 채널 표시기와 달리 Magic Channel Scalper는 다시 그려지지 않습니다.
경고 시스템(경고, 이메일 및 푸시 알림)은 여러 거래 상품을 동시에 모니터링하는 데 도움이 됩니다.
차트에 표시기를 연결하면 신호가 나타나면 경고가 트리거됩니다.
우리의 경고 시스템을 사용하면 단 한 번의 포지션 개시 신호도 놓치지 않을 것입니다!
장점 스캘핑에 딱 맞습니다. 추세 반전을 식별하는 데 탁월합니다. 초보자와 숙련된 거래자에게 적합합니다. 모든 시간대에 작동합니다. 표시기가 다시 그려지지 않습니다. 유연한 경고 시스템. 차트 사용자 정의(선의 크기 및 색상)
권장 기호 USDCAD, EURUSD, USDCHF, AUDNZD, AUDCAD, GOLD.
사용에 대한 권장 사항

Indicator IRush uses a modified version of a popular indicator RSI (Relative Strength Index) to look for entries on a daily chart or lower. The indicator has been set up and tested with the major symbols: AUDUSD, EURUSD, GBPUSD, USDCAD, USDCHF, and USDJPY. An automated trading with this indicator is implemented in the expert advisor Intraday Rush . This expert advisor can open, trail and close its trades. Check it out, it may be exactly what you are looking for!
A Correct Reading of IRush
Th
FREE
Pick Trend is a reliable indicator without redrawing that will not leave any trader indifferent.
Pick Trend tool, which, based on mathematical calculations, analyze all five aspects: opening price, high, low, closing price and volume. Using the Pick Trend Forex indicator algorithm, you can quickly understand what trend is currently developing in the market. As a result of the calculations, the Pick Trend technical indicator is plotted on the chart in the form of a set of points for easy inter

Analyze potential Covered Call structures in the Brazilian market. Define where you want the break-even of your structure and see what structure to use.
It works for any asset that has authorized series of options on B3 (Brazilian Stock Exchange). Associate the indicator to the asset you want to set up the Covered Call. *** ATENTION *** For the robot to work, the service that consults the authorized series of B3 options must be running on your terminal. Download the utility for free from
FREE

Trend Channel is a Forex trend arrow indicator for identifying potential entry points. I like it, first of all, because it has a simple operating mechanism, adaptation to all time periods and trading tactics. Created based on a regression channel with filters. We display the signals of the Trend Channel indicator on the price function chart using a mathematical approach.
How it works: when the price breaks through the overbought/oversold zone (channel levels), a buy or sell signal is generate

Entry and exit signals from the IFR2 Strategy by Larry Connors in his book "Short Term Trading Strategies That Work".
Larry claims this strategy correctly predicted the shortterm direction of the S&P 500 83.6% of the time from 1995 to 2007.
How does it work? The indicator activates the buy signal when the price closes above the 200-day moving average and the 2-period IFR closes below 5. The sell signal is the opposite.
How to use it? Enter the trade with a market order as soon as the cand

Fair Value Gap (FVG) Indicator: Master the ICT Method in Forex Trading
What Traders Are Saying: " Transformed my trading approach with its precise gap spotting ..." – J. Doe " The alert feature is a lifesaver, never miss a trading opportunity.. ." – Alex P. " A crucial tool for anyone following the ICT methodologies in Forex. .." – Samantha R. Unlock the secrets of price movement in the Forex market with the revolutionary Fair Value Gap (FVG) Indicator. Designed for precision and ease of use,

The Beta index, also known as the Beta indicator, is one of the key reference indicators for hedging institutions. It allows you to measure the relative risk of individual assets, such as currencies and commodities, in comparison to market portfolios, cross-currency pairs, the U.S. dollar index, and stock indices. By understanding how your assets perform in relation to market benchmarks, you will have a clearer understanding of your investment risk. Key Features: Accurate Risk Assessment: The Be
The Corr indicator, also known as the Correlation Indicator, serves as a reference indicator for hedge institutions. It is used to measure the degree of relationship between two or more financial products. In the financial field, especially in the currency market, correlation coefficients are commonly used to study the correlation and degree of relationship between different currencies. Correlation coefficients are typically represented by values ranging from -1 to 1. Here are some common interp

Introducing this manual trading strategy that will change the way you approach funding tests! Our indicator has been meticulously designed to maximize your success, offering an impressive accuracy rate of 83% on entries . Imagine having a tool at your disposal that guides you accurately through the financial markets, giving you an unparalleled competitive advantage. With our innovative technology, you'll be one step ahead in every operation. You no longer have to rely solely on intuition or expe

Uses the built-in news calendar of the MT5 terminal or the Investing.com website (in the latter case, the Get news5 utility is required) Has the Scale parameter={100%, 110%, 125%, ...} to adjust the comfortable size of the text and control elements
Tells you in which direction it is safer to open positions 3 in 1: news + trends + news impact index
news for the selected period: current and in tabular form
actual trends for 5 customizable timeframes and trend reversal levels
forecast of exc

The Tiko Trend indicator not only signals immediate buy or sell. It indicates the short term and long term trend. operations. The simplest way to use the indicator is to open a trade in the direction of the existing trend. The indicator allows you to study real and historical market trends in more detail! Shows the points for opening transactions to sell or buy, and also indicates the direction of the trend in: short-term and long-term periods. The analysis is based on the selected timefram

Here is a quantitative analysis indicator for any market. Its essence is simple - it calculates the magnitude of the waves of price movement from top to bottom, and gives the median value of the magnitude of the non-recoil trend. If the current value of the movement has exceeded this threshold by more than 10% (110% of the indicator indicator), you can enter a trade against the trend and work with a large margin of action based on ATR. Transactions are obtained with a high risk-reward ratio and
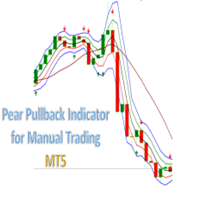
Grape PullBack Indicator for Manual Trading. Indicator (arrow) Type Strategy (Pullback) for all Symbols and Periodicity, Preferably from 30M periodicity. Can be used for manual trading. The indicator i s determined by strategies that is based on criteria for the location of candlesticks in the channel and for the Rsi, Atr, Fractal and Market facilitation index indicators. Its workspace corresponds to channel of 3 bars of Bill Willians with a channel extension . BUY when there is a Green A

Что такое Stochastic? Осциллятор стохастик (Stochastic) – это индикатор импульса, который сравнивает конкретную цену закрытия инструмента с его диапазоном максимумов и минимумов за определенное количество периодов. Основная идея индикатора заключается в том, что импульс предшествует цене, поэтому стохастический осциллятор может давать сигналы о фактическом движении цены непосредственно перед тем, как оно произойдет. Stochastic является осциллятором с привязкой к диапазону от 0 до 100 (по
FREE

Dr. Trend is based on Market Trend Detection. With this Indicator anybody can easily understand the Market Trend and Trade accordingly. It will be very very helpful to Trade perfectly and increase the Accuracy Level.
Recommendation: Use this Indicator along with my another Indicator --->>> Dr. Trend Alert ; Use this Indicator along with my another Indicator --->>> My PVSR <<<--- Click Here ; Good_Luck
It can be used for: All Pairs: Forex, Cryptocurrencies, Metals, Stocks, Indice
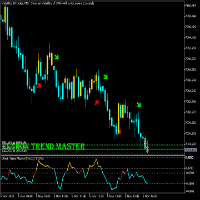
ULTRON TREND MASTER
This Indicator strategy works on any volatility market together with currency pairs and gold. It uses 2 files (Ultron Trend Master 1 and 2) Due to only uploading one file. Please also download Ultron Trend Master 1 free from comment section of this indicator . The purchased file is the main file with the strategy and should be used together with Trend Master 1 File.
The only indicator on the market that will be able to trade any Vix market together with any currency pair
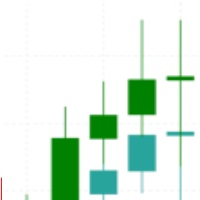
Are you tired of the uncertainty that arises when your orders fail to stop at a specific line due to the spread? Look no further! Introducing our indicator that plots candlesticks based on the Ask price instead of the traditional bid-based chart commonly used in MQL4. With this indicator, you can say goodbye to the frustrations caused by the bid-based chart, as it provides you with a more accurate representation of market movements. By utilizing the Ask price, which represents the price at whic

My PVSR is based on All Type of Pivot Points. Use this Indicator to get proper Support / Resistance Zone and Trade accordingly..
Recommendation: Use this Indicator along with my another Indicator --->>> Dr. Trend <<<--- Click Here ; To get the best output result feel free to contact me ; Best of Luck
It can be used for: All Pairs: Forex, Cryptocurrencies, Metals, Stocks, Indices etc. All Timeframe All Brokers All type of Trading Style like Scalping, Swing, Intraday, Short-Term, Lon

Harness the Power of Donchian Channels for Trend Trading
The Donchian Channel Indicator may your key to precision trading. With Donchian channels, you'll gain insights into market volatility, breakouts, and overbought/oversold conditions. This winning strategy is named after its developer, Richard Donchian.
How Does the Donchian Strategy Work? The upper band represents the previous period's highest high; The lower band represents the previous period's lowest Low; The centre band refle
FREE

PMax is a brand new indicator developed by KivancOzbilgic in earlier 2020.
It's a combination of two trailing stop loss indicators;
One is Anıl Özekşi's MOST (Moving Stop Loss) Indicator
and the other one is well known ATR based SuperTrend.
Both MOST and SuperTrend Indicators are very good at trend following systems but conversely their performance is not bright in sideways market conditions like most of the other indicators.
Profit Maximizer - PMax tries to solve this problem.

神奇九转, 顾名思义就是每当出现数字9时,行情就很大的几率会发生逆转,这时应该注意止盈。是一个很有效的指标。 在序列显示和形成过程中,一旦出现不符合触发条件的情况,则前面序列数字消失,本次九转序列结构不存在。如果连续九天都达到触发条件,九转序列结构形成,价格走势可能发生反转。
九转序列可分为上升九转结构和下降九转结构,也就是九转序列在买多和买空以及判断各种走势反转是都可以使用。 九转序列买入建仓,即下降九转序列结构形成时,价格走势将要发生转变,考虑建仓买入。 买入条件:连续出现九根K线,并且满足收盘价都低于前一根K线收盘价,当第8、9根K线满足上述条件时,九转序列形成,投资者准备买入建仓。
使用分时九转时需要注意两点: 1、极端行情时(连续上涨或下跌),九转序列失效; 2、当九转序列完全形成时,再进场操作(尤其不用刚出现数字8或9就入场,一定要完全形成之后才可以。)

당신만의 전략 구축 이 도구를 사용하면 MetaTrader에서 기본으로 제공되는 모든 지표 및 인터넷에서 다운로드한 모든 지표를 사용하여 전략을 개발할 수 있습니다. 이 도구를 사용하면 MetaTrader를 고려하여 거래 전략을 자동화할 더 이유가 됩니다. 이 도구를 사용하면 MetaTrader의 어떤 지표든 사용하여 간단하고 직관적으로 자신의 전략 신호를 만들 수 있습니다. 인터넷에서 다운로드한 지표가 버퍼를 사용하는지 어떻게 알 수 있을까요? 간단합니다. 이 도구를 실행하기만 하면 모든 지표가 가지고 있는 버퍼를 자동으로 찾아내어 해당 버퍼를 기반으로 전략을 만들 수 있게 해줍니다. 이 도구는 자동으로 지표가 버퍼를 가지고 있는지와 버퍼가 몇 개의 데이터를 가지고 있는지를 식별할 수 있습니다. 버퍼를 올바른 값과 연결하는 일만 하면 됩니다. 이러한 지표는 이미 통합 버퍼를 가지고 있기 때문에 이러한 원천 MetaTrader 지표인 이동 평균, RSI, 스토캐스틱, MACD 등은
FREE
알고 지도
특징
- 엔트리 레벨
- 수익 수준을 높이세요
- 반전 항목 점
- 반전 전략
- 트렌드 트레이딩 전략
- 매 시간마다 스윙 트레이딩 신호를 사고 팔 수 있습니다.
#1 트레이딩 소프트웨어는 이 MT5 소프트웨어로 언제든지 어떤 시장에서도 승리할 수 있습니다!
PROP 회사를 통과하고 싶습니다 ALGO 지도는 Prop 회사 친화적입니다!
거래가 처음이고 시간이 지남에 따라 효과가 있는 전략을 원하시면 Algo MAP에 내장된 반전 전략을 사용하세요!
MT5 스토어에서 90% 할인!
(화이트 차트용으로 제작됨)
트레이더에 의한 트레이더를 위해 제작되었습니다!
사용하는 방법?
-알고가 완전히 작동할 수 있도록 MT5 서버 시간 07:00까지 기다리세요. 녹색 선이 교차되는 것을 보면 거래 시간이 녹색 선으로 표시됩니다. 이제 거래 준비를 시작하세요.
-가격이 킬 존의 진입 수준에 도달하면 반전 가능성이 높으므로 반
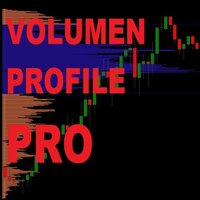
Möchten Sie Ihre Gewinne maximieren, um Ihre Ziele schneller zu erreichen? Denn schauen Sie sich unser Volumenprofil genauer an. Denn die grafische Darstellung der Volumenverteilung macht es Ihnen leicht, die Verteilung und Verschiebung des Gesamtvolumens zu erkennen. Dies führt zweifellos zu besseren Trades und steigert Ihre Leistung erheblich. Mit unserem leistungsstarken Volumenprofil, das die Geschwindigkeit und Effizienz von Metatrader 5 in keiner Weise einschränkt, können Sie das tatsächl

Что такое Heiken Ashi? Heiken Ashi — это метод построения графиков, который можно использовать для прогнозирования будущего движения цены. Он похож на традиционные свечные графики. Однако в отличие от обычного свечного графика, график Heiken Ashi пытается отфильтровать часть рыночного шума для лучшего определения трендовых движений на рынке. Как рассчитать Heiken Ashi?
Heiken Ashi использует формулу COHL, которая означает «Закрытие, Открытие, Максимум, Минимум». Это четыре компонента, кото
FREE
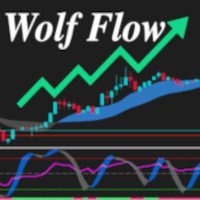
The Wolf Flow Indicator for MetaTrader 5 is the perfect solution for traders looking for instant clarity and precision in their market analysis. Simple to use and immediate to view, this tool offers you a complete overview of market dynamics in a single glance.
Strengths:
Absolute Simplicity: A clean and intuitive interface guarantees effortless use, even for less experienced traders. I mmediate and Rapid: Key data is presented in real time, allowing you to make instant decisions with

Shows the agression balance (buy agression deals - sell agression deals) in a histogram. The agression is calculated on every tick of a given candle and is the sum of volume of all the market buys minus all of the market sell trades. If the ticker does not have real volume, tick volume is used insted;
Very useful to determine if a given candle is dominated by bulls or bears
It is necessary for the data provider to have a list of trades (times & sales) as well as the agressor (buy/sell) d
FREE
The scanner is designed to scan signal buffers of indicators (arrows) and display the nearest signal bar on the panel in color and digital display. Symbols to be scanned, time frames and the number of bars to be scanned are specified, starting from the current (0th) bar. There is also a complex signal, which indicates a list of timeframes on which the indicator signal must match.
You can collapse the indicator by clicking the left mouse button on the upper left corner of the panel (name)

Что такое Awesome Oscillator? Создателем данного индикатора является Билл Вильямс. Этот трейдер разработал собственную торговую систему. Её основой служит постулат: «Рынок движется хаотично. Какие-либо закономерности этого движения вывести довольно сложно, так как многое зависит от психологических факторов.» Поэтому Вильямс разработал собственные инструменты для анализа рынка.
Одним из таких инструментов и является индикатор АО. Это осциллятор, который дает возможность выявить силу текущего
FREE

Что такое CCI индикатор? Стандартный Индикатор CCI (Commodity Channel Index) – это осциллятор, который измеряет силу, стоящую за тем или иным движением цены. Он помогает определить, кто находятся у руля: быки или медведи. Как и многие осцилляторы импульса, CCI работает, сравнивая текущую цену с предыдущими показателями, и на основе этого сравнения он решает, насколько сильное движение цены вверх/вниз.
Как рассчитать CCI? Метод расчета стандартного индикатора представляет собой оригинальн
FREE

Indicator Name : Fourier Transform Curve Indicator Description : The Fourier Transform Curve Indicator for MetaTrader 5 is a powerful tool that leverages Fourier analysis to depict curves directly on your price chart. It is designed to provide valuable insights into the underlying harmonic components of the price data. Parameters : Input Candle Count : This parameter allows you to specify the number of candles to include in the Fourier transformation calculation. A higher value will capture lon

Quarterly Cycles
Quarterly Cycles is based on the Quarterly Theory developed by Daye ( traderdaye on X ). This is an aid to the user to find Cycles and it is NOT automatic detected, user can select AMDX or XAMD in each Cycle and it will be visually drawn on the chart. Quarterly Cycles: Yearly, Monthly, Weekly, Daily, 6 Hour (90 minutes)
– Yearly Cycle : The year is divided in four sections of three months each Q1 - January, February, March Q2 - April, May, June Q3 - July, August, Sept

Что такое RSI? Индикатор RSI (Relative Strength Index, индекс относительной силы) — это индикатор, который измеряет соотношение восходящих и нисходящих движений. Расчет ведётся таким образом, что индекс выражается в диапазоне от 0 до 100. Как понять RSI?
Если значение RSI находится равно 70 и больше, считается, что инструмент находится в состоянии перекупленности (ситуация, когда цены выросли выше, нежели того ожидал рынок). Значение RSI на уровне 30 и ниже считается сигналом о том, что инст
FREE

Super Trend Indicator for MetaTrader 5 - Elevate Your Trading Precision Experience the future of trading with the "Super Trend Indicator" designed for MetaTrader 5. This versatile tool is your key to precise market analysis, providing insights into potential trend directions that enhance your trading decisions. Basic Details : Indicator Type : Super Trend Indicator for MetaTrader 5 Key Metrics : Real-time analysis of market trends using a proprietary algorithm. Customization : Fully customizable

Что такое MACD? Обычный MACD – это осциллятор хотя его часто называют трендовым индикатором, или даже «трендовым осциллятором». Происходит это потому, что MACD строится на основе показаний двух скользящих средних. Чем отличается MACD DA?
В MACD DA используется специальный ценовой фильтр. Только после фильтрации строится индикатор. Гистограмма отображает степень расхождения двух скользящих средних: если одна удаляется от другой, то растут и столбики гистограммы, если сближаются, тогда столбц
FREE

Что такое OsMA DA? Индикатор OsMA DA – это осциллятор, который построен на показаниях другого осциллятора – MACD. OsMA DA показывает расхождение между сигнальной линией MACD и его гистограммой. Момент пересечения гистограммы и линии – это нулевая отметка OsMA. Если гистограмма MACD поднимается выше линии, то гистограмма самого OsMA DA поднимается выше нулевой отметки. В обратной ситуации OsMA DA демонстрирует отрицательные значения. OsMA DA более узконаправленный индикатор, чем MACD. OsMA
FREE

Что такое Momentum DA? Индикатор Momentum DA- это инструмент техническго анализа, который измеряет скорость, с которой меняются цены активов за определенный период времени. Является модификацией обчного Momentum. Основная идея этого индикатора заключается в том, чтобы помочь трейдерам определить возможные точки разворота ценового тренда, определяя моменты ускорения или замедления роста или падения цен. Он основан на предположении, что быстрое увеличение цены будет вероятно сопровождаться
FREE
Зачем нужен этот индикатор? Думаю вы замечали каким «хаотичным» может быть дви- жение цены. Бывают периоды, когда цена движется направле- но, почти без коррекций. В такие периоды трендовые страте- гии работают очень хорошо. Но как только направленное движение заканчивается, торговая стратегия перестаёт работать. Появляется очень много ложных сигналов, что приводит к большому количеству отрицательных сделок. Тогда возникла мысль: «А что если создать индикатор, который смог бы заменить ценов
FREE
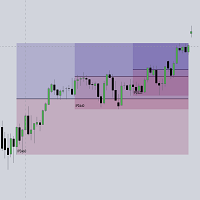
This script automatically calculates and updates ICT's daily IPDA look back time intervals and their respective discount / equilibrium / premium, so you don't have to :) IPDA stands for Interbank Price Delivery Algorithm. Said algorithm appears to be referencing the past 20, 40, and 60 days intervals as points of reference to define ranges and related PD arrays. Intraday traders can find most value in the 20 Day Look Back box, by observing imbalances and points of interest. Longer term traders c

The GGP Wave Trend Oscillator MT5 Indicator is a volatility and momentum tool designed to help traders optimize their trading performance and providing traders find the most accurate market reversals. This indicator is MT5 conversion of the Indicator: WaveTrend Oscillator [WT] by “ LazyBear “ in Trading View website and some alert methods are added to provide real-time alerts when a trading signal is generated, in order to allow traders to act quickly and efficiently. When the oscillator is abov
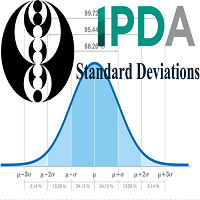
> Introduction and Acknowledgements
The IPDA Standard Deviations tool encompasses the Time and price relationship as studied by Dexter's . I am not the creator of this Theory, and I do not hold the answers to all the questions you may have; I suggest you to study it from Dexter's tweets, videos, and material. > Tool Description This is purely a graphical aid for traders to be able to quickly determine Fractal IPDA Time Windows, and trace the potential Standard Deviations of the moves at thei

This Indicator represents the standard Heikin Ashi Candle converter from normal candles. They are applied on a different chart, so you can identify easily both prices. You can also change candles to your favourite colours. If you want to, you can use this indicator into an iCostum, so you can apply other indicators over this on, because there are excellent indicators combined with this type of candles

The GGP ADX and DI MT5 Indicator is used to quantify trend strength. ADX calculations are based on a moving average of price range expansion over a given period of time. This indicator is MT5 conversion of the ADX and DI Indicator by “BeikabuOyaji “ in Trading View website and some alert methods are added to provide real-time alerts when a trading signal is generated, in order to allow traders to act quickly and efficiently. For MT4 version please click here . ADX is plotted as a single line wit
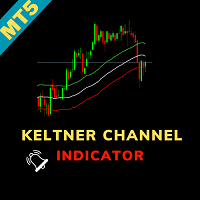
Keltner Channel Indicator for MetaTrader 5 - Precision in Every Trade Unlock precision in your trading with the "Keltner Channel Indicator" tailored for MetaTrader 5. This powerful tool, based on Chester Keltner's work, offers you unparalleled insights into price volatility, helping you make well-informed trading decisions. Basic Details : Indicator Type : Keltner Channel Indicator for MetaTrader 5 Key Metrics : Real-time analysis of price volatility and trend identification. Customization : Ful

Squeeze Momentum Indicator for MetaTrader 5 - Unleash the Power of Market Momentum Introducing the "Squeeze Momentum Indicator" for MetaTrader 5, your gateway to mastering market momentum. This advanced tool is meticulously crafted to provide you with actionable insights into market dynamics, helping you make well-informed trading decisions. Basic Details : Indicator Type : Squeeze Momentum Indicator for MetaTrader 5 Key Metrics : Real-time analysis of market momentum and volatility. Customizati

Directional Volatility and Volume Oscillator for MetaTrader 5 - Master Market Dynamics Discover the power of precision trading with the "Directional Volatility and Volume Oscillator" meticulously designed for MetaTrader 5. This advanced tool combines the insights of directional analysis, volatility measurement, and volume tracking to provide you with unparalleled market understanding. Basic Details : Indicator Type : Directional Volatility and Volume Oscillator for MetaTrader 5 Key Metrics : Rea

To get access to MT4 version please click here . Also you can check this link . This is the exact conversion from TradingView: "UT Bot" by "Yo_adriiiiaan". This is a light-load processing indicator. This is a non-repaint indicator. Buffers are available for processing in EAs. All input fields are available. You can message in private chat for further changes you need. Thanks for downloading
MetaTrader 마켓은 거래로봇과 기술지표를 판매하기에 최적의 장소입니다.
오직 어플리케이션만 개발하면 됩니다. 수백만 명의 MetaTrader 사용자에게 제품을 제공하기 위해 마켓에 제품을 게시하는 방법에 대해 설명해 드리겠습니다.
트레이딩 기회를 놓치고 있어요:
- 무료 트레이딩 앱
- 복사용 8,000 이상의 시그널
- 금융 시장 개척을 위한 경제 뉴스
등록
로그인
계정이 없으시면, 가입하십시오
MQL5.com 웹사이트에 로그인을 하기 위해 쿠키를 허용하십시오.
브라우저에서 필요한 설정을 활성화하시지 않으면, 로그인할 수 없습니다.