
CCI indicator. Three transformation steps

In the previous article, I have considered possible changes in the conventional Commodity Channel Index indicator. They concerned the methods of calculation, but did not affect the essence of this indicator. In this article, I will consider changing the indicator from a slightly different point of view by amending its calculation logic. Let's see how these changes will affect the indicator results. Of course, I will try to evaluate the validity of the implemented changes.
Step one
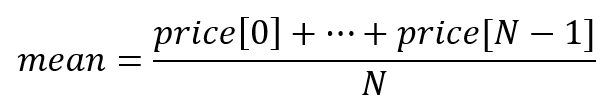
CCI is based on simple and intuitive calculations. First, the difference between the current price and the average value is calculated. This difference is then divided by the standard deviation. In other words, we evaluate how many times more (or less) the difference between the price and the sample mean compared to the sample standard deviation.
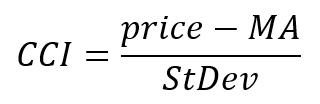
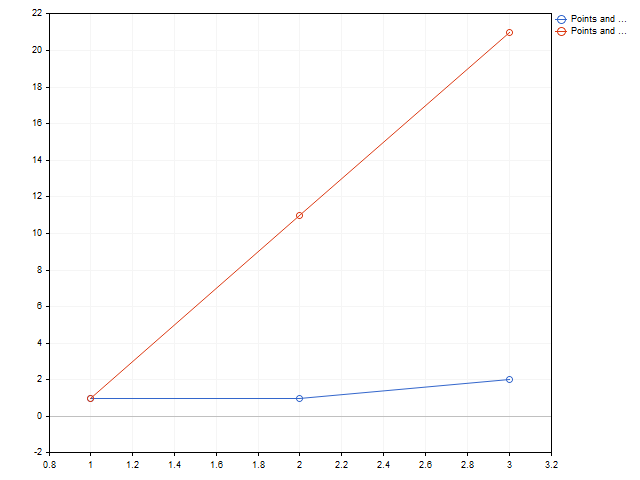
Everything is simple and clear. But there is also a drawback that can lead to wrong decisions. Let's take two sequences as an example: 2, 1, 1 and 21, 11, 1. If we translate these sequences into the language of trading, then the first is a flat, and the second is a clear and strong trend.
Which of these two sequences will give higher CCI value? Try to answer based on your intuition and justify your answer. In the meantime, I will do the necessary calculations.
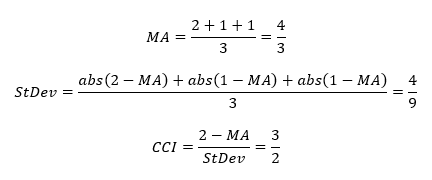
First sequence
Second sequence
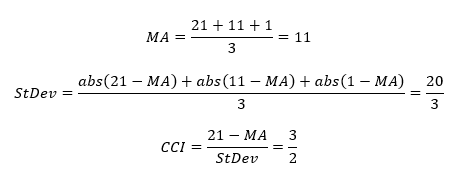
As we can see, both sequences yielded the same result. The main reason is that we use the standard deviation. For the first sequence, the difference between the current value and the average is small. But the standard deviation is also small. For the second sequence, the difference has increased, but the standard deviation has increased as well. This is why two dissimilar sequences led to the same result.
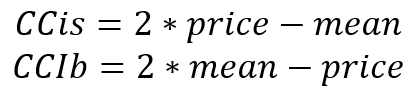
If we ask any trader about their requirements for a technical indicator, then they will most probably say: a unique situation should lead to a unique indicator value. Is it possible to fulfill such a wish when it comes to CCI? The answer is yes. But to achieve this, we need to abandon division and replace it with multiplication. Then the indicator formula will look like this:
With such a change, the indicator should highlight trending price movements well enough when both the difference and the standard deviation are large. But this approach has its own peculiarities. We cannot (even approximately) estimate the range of indicator values and its levels. This shortcoming can be easily overcome, however. Let the indicator itself calculate what values it takes and how often. Having collected such data, we can set the indicator level. Indicator readings that deviate slightly from zero will occur more frequently. Larger values will occur less frequently. By delimiting the indicator values by the frequency of their occurrence, we will be able to set the indicator levels. Let's take into account that statistics for positive and negative values of the indicator may differ from each other. Therefore, let's collect data for the positive and negative levels separately.
The very value of the levels is most conveniently set as a percentage. For example, if the level is equal to 70, then this is exactly the proportion of the indicator values that will lie between the level and the zero line. Only 30% of the values will go beyond the levels.
To calculate the levels, we will proceed as follows. Let's create two arrays to store the indicator values in (positive and negative values are separated from each other).
int array_dn[],         // array for storing positive values
    array_up[],         // array for storing negative values
    size_dn=0,size_up=0;// array sizes
Let's set the array sizes.
ArrayResize(array_up,size_up,rates_total);
ArrayResize(array_dn,size_dn,rates_total);
As historical data become available, we set the obtained results. Please note that we set positive numbers to the array for negative values. This is done for the convenience of subsequent handling.
if(cci>0)
  {
   ArrayResize(array_up,size_up+1);
   array_up[size_up]=(int)MathRound(cci/_Point);
   size_up++;
  }
if(cci<0)
  {
   ArrayResize(array_dn,size_dn+1);
   array_dn[size_dn]=(int)MathRound(-cci/_Point);
   size_dn++;
  }
Before opening a zero bar, you first need to sort these arrays. Then find the indices of the array elements. These cells will contain the level values. Do not forget to return the minus sign for a negative value.
ArraySort(array_up);
IndicatorSetDouble(INDICATOR_LEVELVALUE,0,array_up[size_up*level/100]*_Point);
ArraySort(array_dn);
IndicatorSetDouble(INDICATOR_LEVELVALUE,1,-array_dn[size_dn*level/100]*_Point);
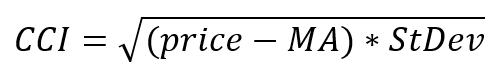
Now let's have look at our new indicator.
As we can see, all calculation options have yielded a similar picture. The main difference is the numerical values of the levels. Interestingly, the levels for positive and negative values of all options differ from each other. This means that price upward and downward movements are not symmetrical from the indicator point of view, and our assumption about a separate collection of statistics turned out to be justified.
However, it is even more interesting to compare our new indicator with the conventional CCI. Here we can meet areas where the indicators look quite similar
as well as the sections where the indicators show different behavior. This difference becomes especially noticeable if we pay attention to the crossings of the indicator line and its levels.
Now let's test our new indicator in action. Develop an EA to trade by its signals. Since the indicator levels can change, we will set the rules for opening positions as follows. A Buy position will be opened if the current value of the indicator is below the negative level, and the previous value of the indicator is below the current one. A Sell position will be opened if the current value of the indicator is above the positive level, and the previous value is above the current one. Opening a position of one type leads to closing of all opposite positions.
Test parameters: EURUSD H1, 2021.01.01 - 2021.12.31.
The main results of each test are shown in the table
| TypeInd | Total Net Profit | Gross Profit | Gross Loss | Total Trades |
|---|---|---|---|---|
| Classical | 248.21 | 1 361.74 | -1 113.53 | 823 |
| Square | -304.83 | 2 993.08 | -3 297.91 | 3581 |
| Modern | -567.15 | 2 540.88 | -3 108.03 | 3251 |
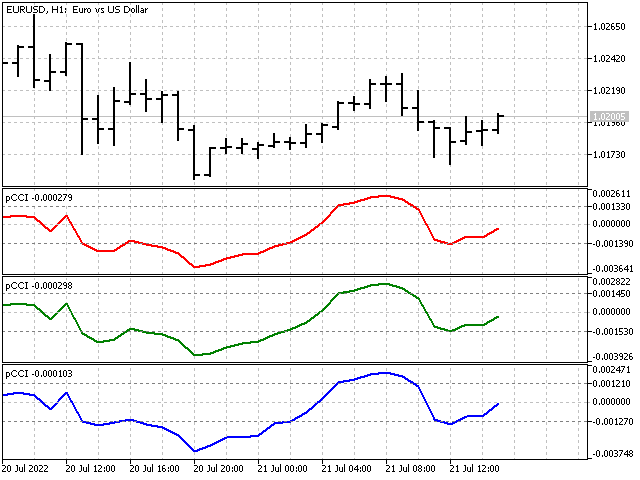
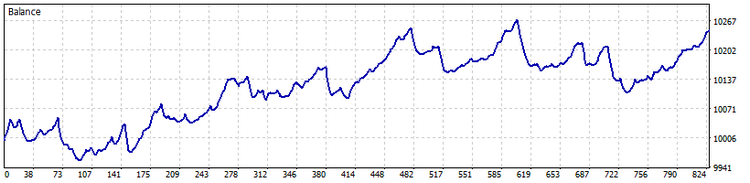
Interestingly, the classic method of calculating the standard deviation immediately yielded a positive result. In the last two options, the number of trades increased significantly. This may indicate the need to increase the indicator trigger levels. Then the number of trades will decrease, and, possibly, their efficiency will improve. The example of a balance curve for the classic version is shown below.
Step two
So far, I have used the standard deviation to calculate the indicator. The use of the standard deviation to normalize the values is justified only if the distribution of the values occurs according to the normal law. In case of CCI, the initial data are the differences between the price and the average. Let's see how they are actually distributed.
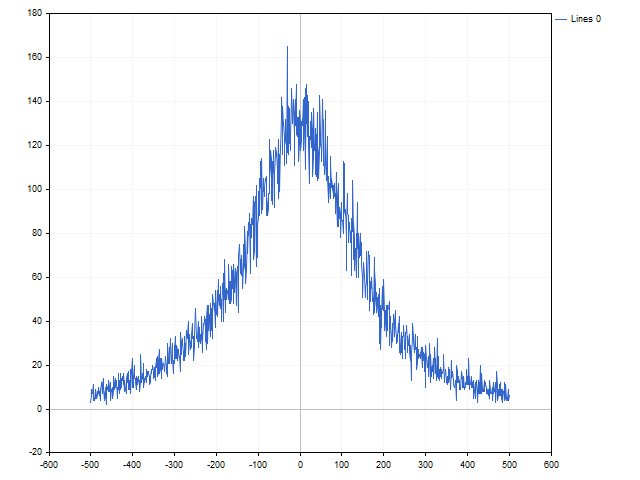
In order to emphasize the features of the obtained result, I reduced the sample size and removed zero values from it. As you can see, the graph turned out to be rather peculiar, and it does not even approximately look like a normal distribution graph.
If the differences are distributed according to some empirical law, we can afford to abandon the standard deviation. Then our indicator will turn into a half of the CCI.
Let's think about the consequences of such a step. Obviously, without smoothing, the spread of indicator values will be quite large and it will look somewhat unusual. In addition, large price movements can affect the visual perception of the indicator. But these shortcomings cannot outweigh one great advantage.
When calculating the values of the CCI indicator, we use a simple average. This is a well-known equation but I will still show it here:
But what is behind this formula? This can be the arithmetic mean, the mathematical expectation of a random variable and a rectangular window. Let's focus on the last option. Why a rectangular window? After all, we have other window functions that can be applied.
I know about fifty window functions with their own names. The number of window functions without proper names is much greater.
For the experiment, we will take a rectangular window, a triangular window and a flat-top window. The last window function is rather unusual as some of its weights take on negative values. Let's also take three asymmetric windows - with linear, power and exponential weights. The averages with linear and exponential weights are available in MetaTrader in the Moving Average menu.
The general view of all options is shown in the figure (the lowest indicator is the classic CCI).
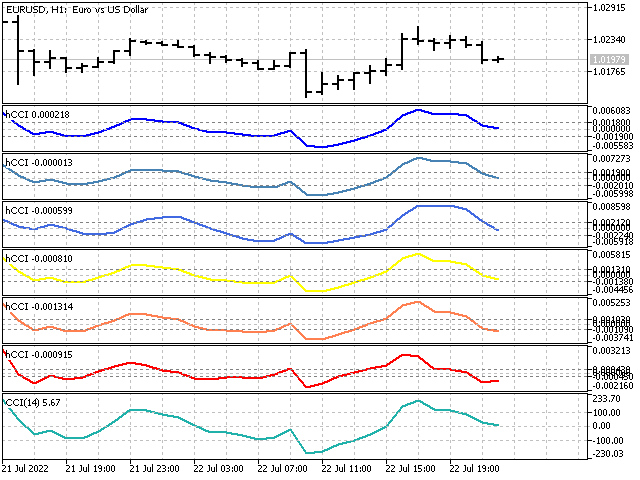
All options are quite similar, but their levels can differ quite a lot. It depends on the window function used — some of them lag behind, and relatively large indicator values may occur more often. Other window functions follow the price, and small deviations are more common as a result.
Also, add two smoothing options to the indicator just in case. They will not change the essence of the calculations, but they can make the indicator visually more attractive.
Let's develop another EA to test this hCCI indicator. The signals for opening and closing positions will be exactly the same as for the previous EA. The test parameters and its interval are also the same as in the previous case.
The main test results are shown in the table.
| Window | Total Net Profit | Gross Profit | Gross Loss | Total Trades |
|---|---|---|---|---|
| Rectangular | 224.57 | 1 745.03 | -1 520.46 | 726 |
| Triangular | 94.17 | 1 532.10 | -1 437.93 | 696 |
| FlatTop | 236.54 | 1 354.67 | -1 118.13 | 643 |
| LWMA | 243.62 | 1 444.48 | -1 200.86 | 639 |
| Power | 44.57 | 1 175.79 | -1 131.22 | 561 |
| Exponential | -317.41 | 725.11 | -1 042.52 | 359 |
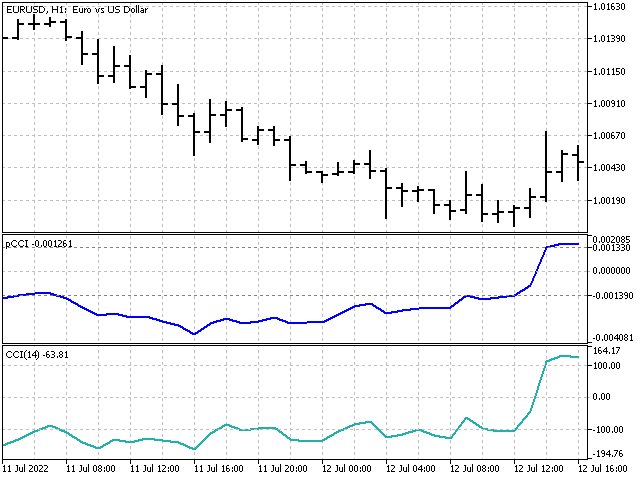
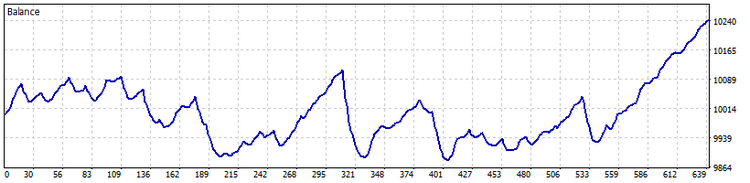
Of all the window functions, only the exponential window yielded a negative result. This does not mean that it is not suitable for trading. This means that its parameters need to be fine-tuned. The rules for closing positions should also be improved. (This applies to all EA versions). The figure shows the balance curve of the EA with the LWMA window function.
Step three
So far, we have considered the CCI indicator as an oscillator. But it would be interesting to move it to the main chart and see how it will be displayed on it. Let's look at how we can achieve this.
Most oscillators are based on a simple principle — suppression of the main signal, while highlighting subtle price movements. Thus, to transfer the indicator to the main chart, we need to add a reference signal to its value. In case of CCI, the current price or the average can be used as a signal. Then the equations for calculating the indicator value will be as follows:
Both options are unstable. Their values can strongly deviate from the price line. But this disadvantage is compensated by the fact that both indicators can highlight trend price movements well.
Conclusion
The presented indicators develop the principles laid down in the classic CCI indicator. The undoubted advantage of the new indicators is the ability to customize them at trader's choice.
Indicator parameters:
pCCI indicator
- TypeInd – sets the method for calculating indicator values;
- iPeriod – indicator period, minimum value 2;
- iLevel – value of indicator levels, valid value 1 – 99.
hCCI indicator
- Window – type of window function used;
- Smoothing – applied smoothing;
- iPeriod – indicator period, minimum value 2;
- iLevel – value of indicator levels, valid value 1 – 99.
lCCI indicator
- Window – type of window function used;
- Direct – reference signal type;
- iPeriod – indicator period, minimum value 2.
Difference Distribution script
- Length – moving average period;
- Level – maximum sample value;
- ViewDuration – display duration;
- ScreenShot – if the parameter is enabled, then the chart is saved in the Files folder.
EA pCCI
All its parameters are the same as those of the pCCI indicator. Signals for opening and closing positions occur when a new bar is opened.
EA hCCI
Its main settings correspond to those of the hCCI indicator.
Translated from Russian by MetaQuotes Ltd.
Original article: https://www.mql5.com/ru/articles/8860
 Neural networks made easy (Part 22): Unsupervised learning of recurrent models
 Neural networks made easy (Part 21): Variational autoencoders (VAE)
- Free trading apps
- Over 8,000 signals for copying
- Economic news for exploring financial markets
You agree to website policy and terms of use