
Drawing Indicator's Emissions in MQL5
Introduction
Certainly, many traders and developers of trading strategies are interested in these questions:- How the strong market movements are emerging?
- How to determine the correct direction of upcoming changes?
- How to open profitable position for trade?
- How to close position with maximal profit?
Finding the answers for these questions led me to creation of a new approach to the market research: construction and analysis of indicator emissions. To make it clearer, take a look at the following figures:

Fig. 1 Emission of DCMV indicator.

Fig. 2. Emission of indicator, based on iMA envelopes.
It shows the emission from different indicators, but the principle of their construction is the same. More and more points with different color and shape appear after the each tick. They form numerous clusters in the forms of nebulae, clouds, tracks, lines, arcs, etc. These shapes can help to detect the invisible springs and forces that affect the movement of market prices. The research and analysis of these emissions are something like chiromancy.
Emission and its Properties
The emission is a set of points, located at the intersection points of specific lines of the indicator.
The properties of emissions haven't been still clear yet, they are still waiting for the researchers. Here is a list of known properties:
- the points of same type tend to cluster;
- the emission has a direction - from the present to the future or to the past;
- the clusters are important - the dense clusters can attract or, conversely, can repel the price.
Calculation of the Indicator's Emission
Let's consider the fundamentals of emission calculation using an example. Let's take two indicators - iBands and iMA - and find the intersection of their lines. We will use them to draw the points of emission. For this we will need graphic objects. The algorithm is implemented in Expert Advisors, but it can be done in the indicators.
The initial indicators are presented in Fig. 3.:
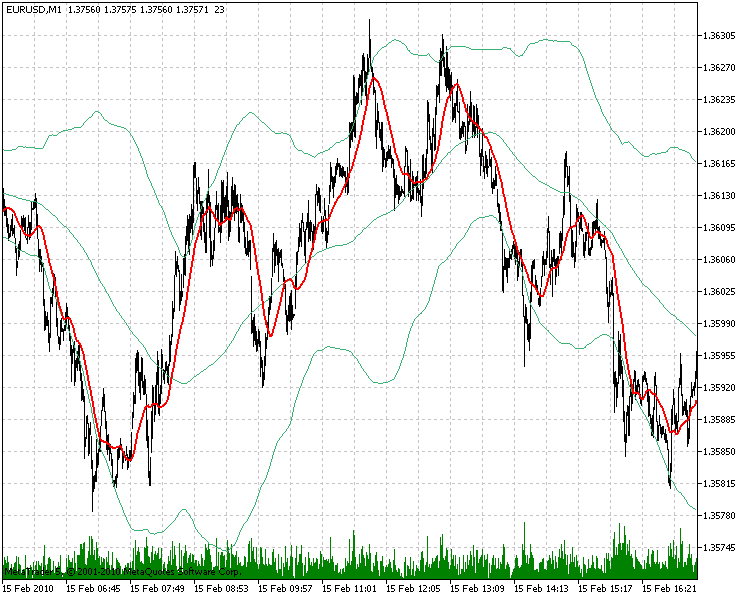
Fig. 3. The iBands (green) and iMA (red) indicators.
We need an Expert Advisor to create emission points. It's better to use the MQL5 Wizard to create an Expert Advisor template.

Fig. 4. Creating an Expert Advisor template using MQL5 Wizard.
//+------------------------------------------------------------------+
//|                                      Emission of Bands && MA.mq5 |
//|                                                 Copyright DC2008 |
//|                                              https://www.mql5.com |
//+------------------------------------------------------------------+
#property copyright "DC2008"
#property link      "https://www.mql5.com"
#property version   "1.00"
//+------------------------------------------------------------------+
//| Expert initialization function                                   |
//+------------------------------------------------------------------+
int OnInit()
  {
//---

//---
   return(0);
  }
//+------------------------------------------------------------------+
//| Expert deinitialization function                                 |
//+------------------------------------------------------------------+
void OnDeinit(const int reason)
  {
//---

  }
//+------------------------------------------------------------------+
//| Expert tick function                                             |
//+------------------------------------------------------------------+
void OnTick()
  {
//---

  }
//+------------------------------------------------------------------+
First, we need some auxiliary plottings. We need to continue indicator lines using rays (Fig. 5.). It will allow to control the correctness of calculation and visualization of emission points. Later, we will remove these lines from the chart.
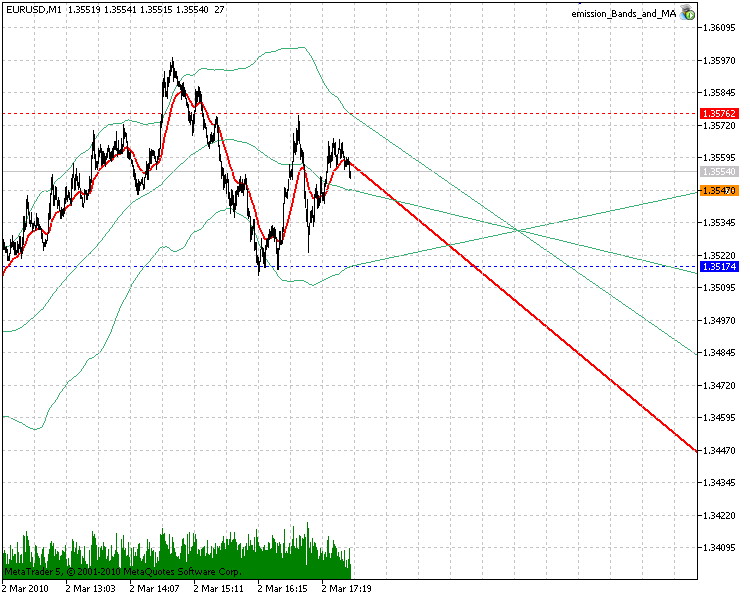
Fig. 5. Auxiliary plottings. Continuation of the indicator's lines using rays.
Thus, let's add the graphic objects (horizontal and trend lines) to the code of our Expert Advisor.
input bool     H_line=true;   // flag to enable drawing of the horizontal lines
input bool     I_line=true;   // flag to enable drawing of the indicator's lines
//---
string         name;
//---- indicator buffers
double      MA[];    // array for iMA indicator
double      BBH[];   // array for iBands indicator  - UPPER_BAND
double      BBL[];   // array for iBands indicator - LOWER_BAND
double      BBM[];   // array for iBands indicator - BASE_LINE
datetime    T[];     // array for time coordinates
//---- handles for indicators
int         MAHandle;   // iMA indicator handle
int         BBHandle;   // iBands indicator handle
//+------------------------------------------------------------------+
//| Expert initialization function                                   |
//+------------------------------------------------------------------+
int OnInit()
  {
//---
   MAHandle=iMA(Symbol(),0,21,0,MODE_EMA,PRICE_CLOSE);
   BBHandle=iBands(Symbol(),0,144,0,2,PRICE_CLOSE);
//---
   if(H_line)     // Horizontal lines of iBands indicator
      {
         //--- iBands - UPPER_BAND
         name="Hi";
         ObjectCreate(0,name,OBJ_HLINE,0,0,0);
         ObjectSetInteger(0,name,OBJPROP_COLOR,Red);
         ObjectSetInteger(0,name,OBJPROP_STYLE,STYLE_DOT);
         ObjectSetInteger(0,name,OBJPROP_WIDTH,1);
         //--- iBands - LOWER_BAND
         name="Lo";
         ObjectCreate(0,name,OBJ_HLINE,0,0,0);
         ObjectSetInteger(0,name,OBJPROP_COLOR,Blue);
         ObjectSetInteger(0,name,OBJPROP_STYLE,STYLE_DOT);
         ObjectSetInteger(0,name,OBJPROP_WIDTH,1);
         //--- iBands - BASE_LINE
         name="MIDI";
         ObjectCreate(0,name,OBJ_HLINE,0,0,0);
         ObjectSetInteger(0,name,OBJPROP_COLOR,DarkOrange);
         ObjectSetInteger(0,name,OBJPROP_STYLE,STYLE_DOT);
         ObjectSetInteger(0,name,OBJPROP_WIDTH,1);
      }
//---
   if(I_line)     // Indicator lines
      {
         //--- iMA
         name="MA";
         ObjectCreate(0,name,OBJ_TREND,0,0,0,0);
         ObjectSetInteger(0,name,OBJPROP_COLOR,Red);
         ObjectSetInteger(0,name,OBJPROP_STYLE,STYLE_SOLID);
         ObjectSetInteger(0,name,OBJPROP_WIDTH,2);
         ObjectSetInteger(0,name,OBJPROP_RAY_RIGHT,1);
         ObjectSetInteger(0,name,OBJPROP_RAY_LEFT,1);
         //--- iBands - UPPER_BAND
         name="BH";
         ObjectCreate(0,name,OBJ_TREND,0,0,0,0);
         ObjectSetInteger(0,name,OBJPROP_COLOR,MediumSeaGreen);
         ObjectSetInteger(0,name,OBJPROP_STYLE,STYLE_SOLID);
         ObjectSetInteger(0,name,OBJPROP_WIDTH,1);
         ObjectSetInteger(0,name,OBJPROP_RAY_RIGHT,1);
         ObjectSetInteger(0,name,OBJPROP_RAY_LEFT,1);
         //--- iBands - LOWER_BAND
         name="BL";
         ObjectCreate(0,name,OBJ_TREND,0,0,0,0);
         ObjectSetInteger(0,name,OBJPROP_COLOR,MediumSeaGreen);
         ObjectSetInteger(0,name,OBJPROP_STYLE,STYLE_SOLID);
         ObjectSetInteger(0,name,OBJPROP_WIDTH,1);
         ObjectSetInteger(0,name,OBJPROP_RAY_RIGHT,1);
         ObjectSetInteger(0,name,OBJPROP_RAY_LEFT,1);
         //--- iBands - BASE_LINE
         name="BM";
         ObjectCreate(0,name,OBJ_TREND,0,0,0,0);
         ObjectSetInteger(0,name,OBJPROP_COLOR,MediumSeaGreen);
         ObjectSetInteger(0,name,OBJPROP_STYLE,STYLE_SOLID);
         ObjectSetInteger(0,name,OBJPROP_WIDTH,1);
         ObjectSetInteger(0,name,OBJPROP_RAY_RIGHT,1);
         ObjectSetInteger(0,name,OBJPROP_RAY_LEFT,1);
      }
   return(0);
  }
//+------------------------------------------------------------------+
//| Expert deinitialization function                                 |
//+------------------------------------------------------------------+
void OnDeinit(const int reason)
  {
//---

  }
//+------------------------------------------------------------------+
//| Expert tick function                                             |
//+------------------------------------------------------------------+
void OnTick()
  {
   //--- filling the arrays with current values
   CopyBuffer(MAHandle,0,0,2,MA);
   ArraySetAsSeries(MA,true);
   CopyBuffer(BBHandle,0,0,2,BBM);
   ArraySetAsSeries(BBM,true);
   CopyBuffer(BBHandle,1,0,2,BBH);
   ArraySetAsSeries(BBH,true);
   CopyBuffer(BBHandle,2,0,2,BBL);
   ArraySetAsSeries(BBL,true);
   CopyTime(Symbol(),0,0,10,T);
   ArraySetAsSeries(T,true);

   //--- Horizontal lines of iBands indicator (correction)
   if(H_line)
      {
      name="Hi";
      ObjectSetDouble(0,name,OBJPROP_PRICE,BBH[0]);
      name="Lo";
      ObjectSetDouble(0,name,OBJPROP_PRICE,BBL[0]);
      name="MIDI";
      ObjectSetDouble(0,name,OBJPROP_PRICE,BBM[0]);
      }
   //--- Indicator's lines (correction)
   if(I_line)
      {
      name="MA";  //--- iMA
      ObjectSetInteger(0,name,OBJPROP_TIME,T[1]);
      ObjectSetDouble(0,name,OBJPROP_PRICE,MA[1]);
      ObjectSetInteger(0,name,OBJPROP_TIME,1,T[0]);
      ObjectSetDouble(0,name,OBJPROP_PRICE,1,MA[0]);
      name="BH";  //--- iBands - UPPER_BAND
      ObjectSetInteger(0,name,OBJPROP_TIME,T[1]);
      ObjectSetDouble(0,name,OBJPROP_PRICE,BBH[1]);
      ObjectSetInteger(0,name,OBJPROP_TIME,1,T[0]);
      ObjectSetDouble(0,name,OBJPROP_PRICE,1,BBH[0]);
      name="BL";  //--- iBands - LOWER_BAND
      ObjectSetInteger(0,name,OBJPROP_TIME,T[1]);
      ObjectSetDouble(0,name,OBJPROP_PRICE,BBL[1]);
      ObjectSetInteger(0,name,OBJPROP_TIME,1,T[0]);
      ObjectSetDouble(0,name,OBJPROP_PRICE,1,BBL[0]);
      name="BM";  //--- iBands - BASE_LINE
      ObjectSetInteger(0,name,OBJPROP_TIME,T[1]);
      ObjectSetDouble(0,name,OBJPROP_PRICE,BBM[1]);
      ObjectSetInteger(0,name,OBJPROP_TIME,1,T[0]);
      ObjectSetDouble(0,name,OBJPROP_PRICE,1,BBM[0]);
      }
  }
//+------------------------------------------------------------------+
Since the emission continues to the past and to the future, the trend line properties should be following:
- OBJPROP_RAY_LEFT = 1, (Ray goes left);
- OBJPROP_RAY_RIGHT = 1, (Ray goes right).
As a result, the chart with additional lines will look as presented in Fig. 6.
The preparatory phase is completed, now let's proceed to the emission. We are going to create the first series of points at the intersection of the following lines:
- between the "MA" (iMA) line and "BH" line (iBands = UPPER_BAND);
- between the "MA" (iMA) line and "BL" line (iBands = LOWER_BAND);
- between the "MA" (iMA) line and "BM" line (iBands = BASE_BAND).

Fig. 6. Auxiliary plottings. Continuation of the indicator's lines using straight lines.
Now it's time to calculate the coordinates of intersection and to draw the points of the emission. Let's create the function:
void Draw_Point(
                string   P_name,     // Object name (OBJ_ARROW)
                double   P_y1,       // Y-coordinate of the 1st line at the [1] bar
                double   P_y0,       // Y-coordinate of the 1st line at the [0] bar
                double   P_yy1,      // Y-coordinate of the 2nd line at the [1] bar
                double   P_yy0,      // Y-coordinate of the 2nd line at the [0] bar
                char     P_code1,    // Char at the right side of the [0] bar
                char     P_code2,    // Char at the left side of the [0] bar
                color    P_color1,   // Color of point at the right side of the [0] bar
                color    P_color2    // color of point at the left side of the [0] bar
                )
  {
   double   P,X;
   datetime P_time;
   if(MathAbs((P_yy0-P_yy1)-(P_y0-P_y1))>0)
     {
      P=P_y1+(P_y0-P_y1)*(P_y1-P_yy1)/((P_yy0-P_yy1)-(P_y0-P_y1));
      X=(P_y1-P_yy1)/((P_yy0-P_yy1)-(P_y0-P_y1));
      if(X>draw_period)
        {
         P_time=T[0]+(int)(X*PeriodSeconds());
         ObjectCreate(0,P_name,OBJ_ARROW,0,0,0);
         ObjectSetDouble(0,P_name,OBJPROP_PRICE,P);
         ObjectSetInteger(0,P_name,OBJPROP_TIME,P_time);
         ObjectSetInteger(0,P_name,OBJPROP_WIDTH,0);
         ObjectSetInteger(0,P_name,OBJPROP_ARROWCODE,P_code1);
         ObjectSetInteger(0,P_name,OBJPROP_COLOR,P_color1);
         if(X<0)
           {
            ObjectSetInteger(0,P_name,OBJPROP_ARROWCODE,P_code2);
            ObjectSetInteger(0,P_name,OBJPROP_COLOR,P_color2);
           }
        }
     }
  }
And adding the following lines of code to the function OnTick:
//+------------------------------------------------------------------+
   int GTC=GetTickCount();
//+------------------------------------------------------------------+
   name="H"+(string)GTC;
   Draw_Point(name,BBH[1],BBH[0],MA[1],MA[0],170,178,Red,Red);
   name="L"+(string)GTC;
   Draw_Point(name,BBL[1],BBL[0],MA[1],MA[0],170,178,Blue,Blue);
   name="M"+(string)GTC;
   Draw_Point(name,BBM[1],BBM[0],MA[1],MA[0],170,178,Green,Green);
//---
   ChartRedraw(0);
Now let's run the Expert Advisor and look at the result (Fig. 7.).
It's good, but there are some other intersection cases, that we haven't considered. For example, the iBands indicator has three lines that intersect each other and can complement the overall picture.

Fig. 7. The emission of the iMA and iBands indicators (3 intersections).
Now, let's try to add another one series of point to the calculated emission, the intersection between the following lines:- between the line "BH" (iBands = UPPER_BAND) and line "BL" (iBands = LOWER_BAND);
- between the line "BH" (iBands = UPPER_BAND) and line "BM" (iBands = BASE_BAND);
- between the line "BL" (iBands = LOWER_BAND) and line "BM" (iBands = BASE_BAND).
Due to these intersections, we would get 3 points, but all they will have the same coordinates. Therefore, it's sufficient to use an only one intersection, between the line "BH" and line "BL".
Let's add these lines of code to our Expert Advisor, and take a look at the result (Fig. 8.).
   name="B"+(string)GTC;
   Draw_Point(name,BBH[1],BBH[0],BBL[1],BBL[0],170,178,Magenta,Magenta);

Fig. 8. Emission of the iMA and iBands indicators (4 intersections).
So, we have got the emission, but there is a feeling that we have missed something important. Nevertheless, what we have missed?
Why we have used just such input parameters? What we will get if we change them? And anyway, what is their role in the emissions?
All right, the emission we've got corresponds to a single frequency, resulted from the input parameters of the indicator. To calculate the full multi-frequency spectrum, it's necessary to perform the same calculations for other frequencies. As an example, here is my version of the possible emission spectrum:
//---- handles for indicators
int         MAHandle[5];   // handles array of iMA indicators
int         BBHandle[7];   // handles array of iBands indicator
//+------------------------------------------------------------------+
//| Expert initialization function                                   |
//+------------------------------------------------------------------+
int OnInit()
  {
//---
   MAHandle[0]=iMA(NULL,0,21,0,MODE_EMA,PRICE_CLOSE);
   MAHandle[1]=iMA(NULL,0,34,0,MODE_EMA,PRICE_CLOSE);
   MAHandle[2]=iMA(NULL,0,55,0,MODE_EMA,PRICE_CLOSE);
   MAHandle[3]=iMA(NULL,0,89,0,MODE_EMA,PRICE_CLOSE);
   MAHandle[4]=iMA(NULL,0,144,0,MODE_EMA,PRICE_CLOSE);
//---
   BBHandle[0]=iBands(NULL,0,55,0,2,PRICE_CLOSE);
   BBHandle[1]=iBands(NULL,0,89,0,2,PRICE_CLOSE);
   BBHandle[2]=iBands(NULL,0,144,0,2,PRICE_CLOSE);
   BBHandle[3]=iBands(NULL,0,233,0,2,PRICE_CLOSE);
   BBHandle[4]=iBands(NULL,0,377,0,2,PRICE_CLOSE);
   BBHandle[5]=iBands(NULL,0,610,0,2,PRICE_CLOSE);
   BBHandle[6]=iBands(NULL,0,987,0,2,PRICE_CLOSE);
//---
   return(0);
  }
To consider all possible combinations, let's add the following code to the Expert Advisor:
//+------------------------------------------------------------------+
   CopyTime(NULL,0,0,10,T);
   ArraySetAsSeries(T,true);
   int GTC=GetTickCount();
//+------------------------------------------------------------------+
   int iMax=ArraySize(BBHandle)-1;
   int jMax=ArraySize(MAHandle)-1;
   for(int i=0; i<iMax; i++)
     {
      for(int j=0; j<jMax; j++)
        {
         //--- filling the arrays with current values
         CopyBuffer(MAHandle[j],0,0,2,MA);
         ArraySetAsSeries(MA,true);
         CopyBuffer(BBHandle[i],0,0,2,BBM);
         ArraySetAsSeries(BBM,true);
         CopyBuffer(BBHandle[i],1,0,2,BBH);
         ArraySetAsSeries(BBH,true);
         CopyBuffer(BBHandle[i],2,0,2,BBL);
         ArraySetAsSeries(BBL,true);

         name="H"+(string)GTC+(string)i+(string)j;
         Draw_Point(name,BBH[1],BBH[0],MA[1],MA[0],250,158,Aqua,Aqua);
         name="L"+(string)GTC+(string)i+(string)j;
         Draw_Point(name,BBL[1],BBL[0],MA[1],MA[0],250,158,Blue,Blue);
         name="M"+(string)GTC+(string)i+(string)j;
         Draw_Point(name,BBM[1],BBM[0],MA[1],MA[0],250,158,Green,Green);
         name="B"+(string)GTC+(string)i+(string)j;
         Draw_Point(name,BBH[1],BBH[0],BBL[1],BBL[0],250,158,Magenta,Magenta);
        }
     }
//---
   ChartRedraw(0);
The more frequencies is involved in the emission spectrum, the better picture will be on chart, but you should not abuse it - it's a simplest way to exhaust the computer resources, and to get the chaos on the chart. The number of frequencies can be determined experimentally. For the better perception of graphics, we must pay special attention to the drawing style.

Fig. 9. Multi-frequency emission spectrum.
Of Emission's Drawing Styles
MQL5 language provides a wide range of Web Colors and Windings characters for drawing emissions. I would like to share my thoughts about it:- Each person has his own perception of graphic images, so you'll need some time to customize the emissions.
- The "chaos" in Fig.9. doesn't allow to recognize any regularities or patterns in images. It's an example of bad drawing.
- Try to use the neighbor colors in the rainbow spectrum.
- The character codes for the past (from the left side of [0] bar) and for the future (from the right side of [0] bar) should differ.
- The successful combination of colors and shapes of points is able to turn the emission into the masterpieces, which will not only help in the trade, but will also pleasure your eyes.
         name="H"+(string)GTC+(string)i+(string)j;
         Draw_Point(name,BBH[1],BBH[0],MA[1],MA[0],250,158,Aqua,Aqua);
         name="L"+(string)GTC+(string)i+(string)j;
         Draw_Point(name,BBL[1],BBL[0],MA[1],MA[0],250,158,Blue,Blue);
         name="M"+(string)GTC+(string)i+(string)j;
         Draw_Point(name,BBM[1],BBM[0],MA[1],MA[0],250,158,Magenta,Magenta);
         name="B"+(string)GTC+(string)i+(string)j;
         Draw_Point(name,BBH[1],BBH[0],BBL[1],BBL[0],250,158,DarkOrchid,DarkOrchid);
The iMA and iBands Emissions Gallery
The images with this emissions are presented in this chapter.
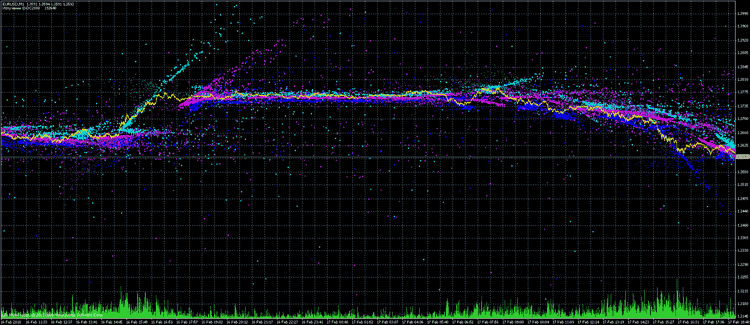
Fig. 10.
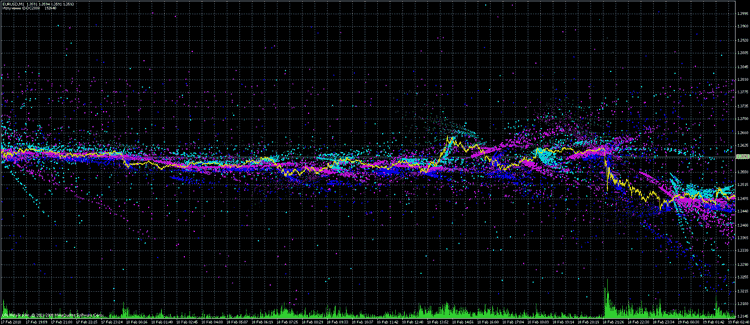
Fig. 11
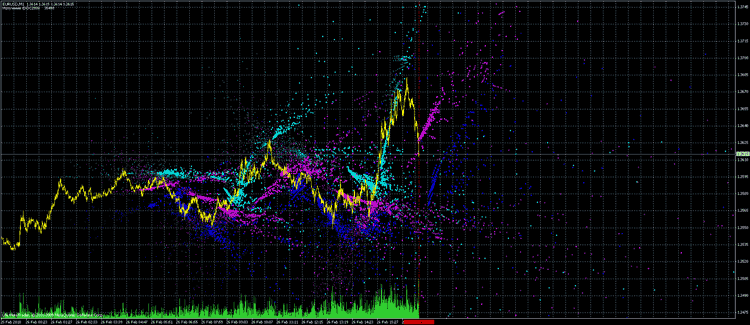
Fig. 12.
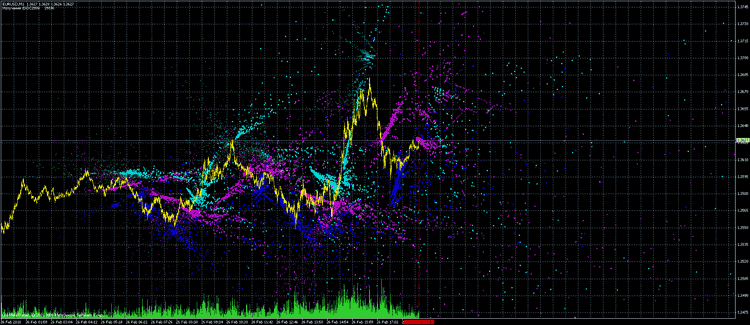
Fig. 13.
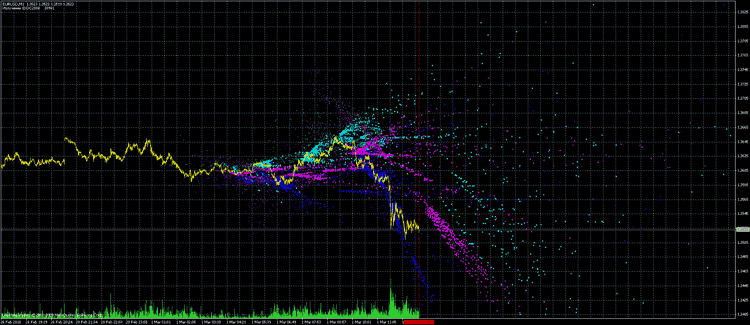
Fig. 14.
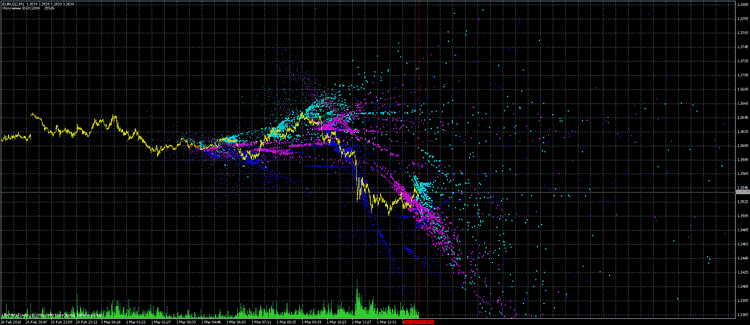
Fig. 15.
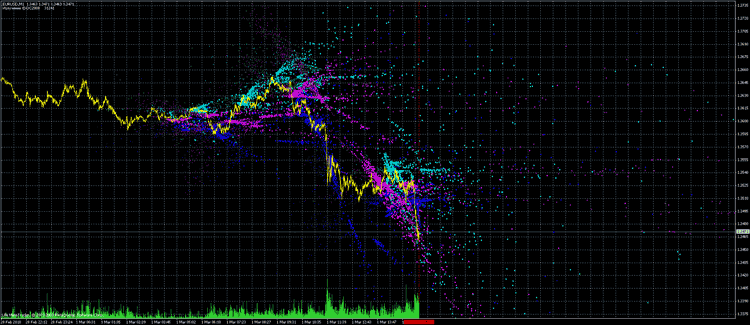
Fig. 16.
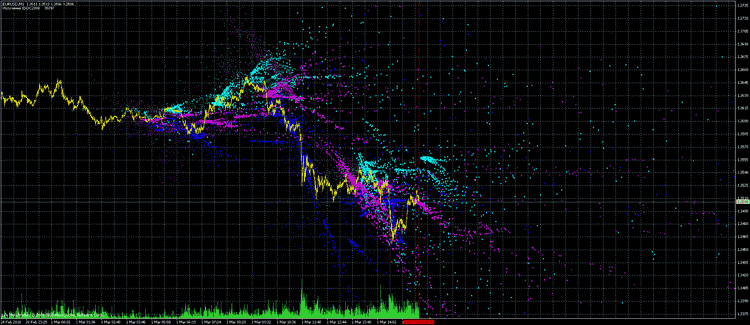
Fig. 17.
Emission Analysis
The analysis of emissions is a separate task. The most useful thing is to look at its dynamics in a real time, it's the best way to understand many effects and patterns.
Pay attention to the price corrections - it seems that the emission "knows" the target price. In addition, you can see the support, resistance and equilibrium price levels.
Conclusion
- The emissions of the indicators might be interesting to traders and trade systems developers, who are looking for new approaches in market research and analysis.
- As an introductory article, it doesn't contain the ready solutions. However, the presented technology for emission calculation can be applied in other indicators or their combinations.
- Preparing this article, I have collected more questions than answers. Here are some of them: how to optimize the algorithm of emission drawing; what is the role of the emission spectrum characteristics in the structure of emission; how to use the emissions in automated trading?
Translated from Russian by MetaQuotes Ltd.
Original article: https://www.mql5.com/ru/articles/26
 Introduction to MQL5: How to write simple Expert Advisor and Custom Indicator
 The Drawing Styles in MQL5
 MQL5: Analysis and Processing of Commodity Futures Trading Commission (CFTC) Reports in MetaTrader 5
 Practical Implementation of Digital Filters in MQL5 for Beginners
- Free trading apps
- Over 8,000 signals for copying
- Economic news for exploring financial markets
You agree to website policy and terms of use
Breathless..
Really very interesting.
Looking for the possibility to easily change/add more different indicators.
If you have code ideas of how to it correctly, please paste
It's possible to rewrite this EA, in order that it, can draw emissions, also in shiftback, and not only in real-time?
In example, a function that set like this: draw emissions for the previous 100 bars back.
It would be useful to draw emissions, like an indicator do for the past/back bars, and not only begin to drawing
only in the moment it(EA) attached to the graph.
How to modify the code, in order to set a back-bars emissions-drawing function?
I hope my 'idea' would like you.
Thanks.
Nobody still interested in this (great) article/EA?
I founded it very interesting, freshly and promising.
I'm looking a way to add more indicators to merge and watch the emissions,
and also a possibility to add something opening positions for trade.
Some code modifications?
Really interesting, but when I compile and use them, nothing happens.
Not sure if I'm missing something?
Steven