
Algorithmic Trading With MetaTrader 5 And R For Beginners
Introduction
MetaTrader stands as a globally acclaimed pinnacle in the realm of trading platforms. Renowned for its industry-grade quality, this software is provided at no cost, rendering it accessible to a broad spectrum of users. Consequently, the MetaTrader community has witnessed a steady growth year by year. The community, now more diverse than ever in its history, comprises individuals from varied cultural backgrounds and possessing distinct proficiencies in programming languages. Noteworthy is the fact that, alongside MetaQuotes Language 5 (the official language of the platform), Python stands as the sole programming language with full support within the MetaTrader platform.
For community members transitioning from R, irrespective of their background in Academia or Scientific Computation, the MetaQuotes community welcomes you with open arms. Despite the advancements in Python, and the exclusive integration of Python as the only other fully supported language within the MetaTrader terminal, individuals proficient in R need not perceive their programming skills as obsolete. This article challenges any notion suggesting obsolescence by illustrating that, with the application of creativity and a little ingenuity, it remains entirely feasible to construct a comprehensive algorithmic trading advisor using R and MetaTrader 5.
It is imperative to note, based on the author's experience, that the packages discussed in this article exhibit imperfect interactions when employed individually within the MetaTrader 5 Terminal. Each package presents its distinctive limitations. However, when employed in unison, these packages effectively compensate for one another's shortcomings, collectively forming a robust framework conducive to the development of trading algorithms using R and MetaTrader.
Please Note:
1. Operating System Consideration:
This demonstration was carried out on a Windows Machine running Windows 11 OS Build 22621.1848. These steps have not undergone testing on alternative operating systems.
2. R Version Compatibility:
This demonstration utilizes R version 4.3.2. It is imperative that participants use the same version of R, given that certain packages featured in this presentation do not extend support to earlier versions of the R language.
3. RStudio Integration:
This demonstration integrates with RStudio, a sophisticated integrated development environment designed for writing R code. Participants are advised to leverage RStudio for an optimal coding experience throughout the course of this demonstration.
Setting Up Your Environment
First things first – let's set up our environment.
Start by making sure you've got R version 4.3.2 on your computer. If you're unsure or don't have R installed, we'll walk through the steps together.
To check if R is installed, look for the R icon on your desktop. If it's not there, you can search for "R" – that should bring up the R terminal if it's already installed. If you need to install R or have an older version, you can get the setup from the official R repository at The Comprehensive R Archive Network. This link will always take you to the latest version of R, and as of now, it's version 4.3.2. Once you download the setup file, just follow the instructions that pop up, starting with choosing your language.
Now that you have R installed, let's confirm the version you're running. Open the R terminal, and you'll see the version displayed at the top of the greeting message whenever you start a new session. If you want more detailed information, you can always use the "version" command in the terminal.
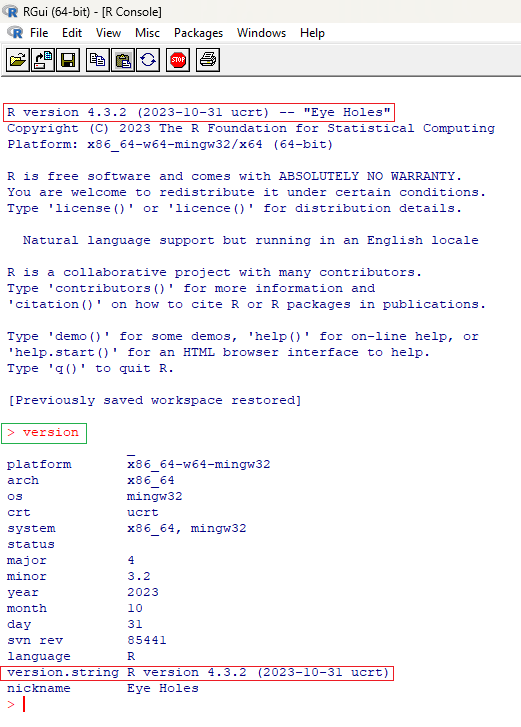
Fig 1: Checking Your Version of R
Now, let's get RStudio set up. If you don't have RStudio installed, you can download it from this link: RStudio Desktop - Posit. Just follow the on-screen prompts as they appear, similar to the R setup process we discussed earlier.
Once the installation is complete, let’s validate the version of R that your installation of R studio is pointing to.
First open R studio.
Then select “tools”, and “global options”.
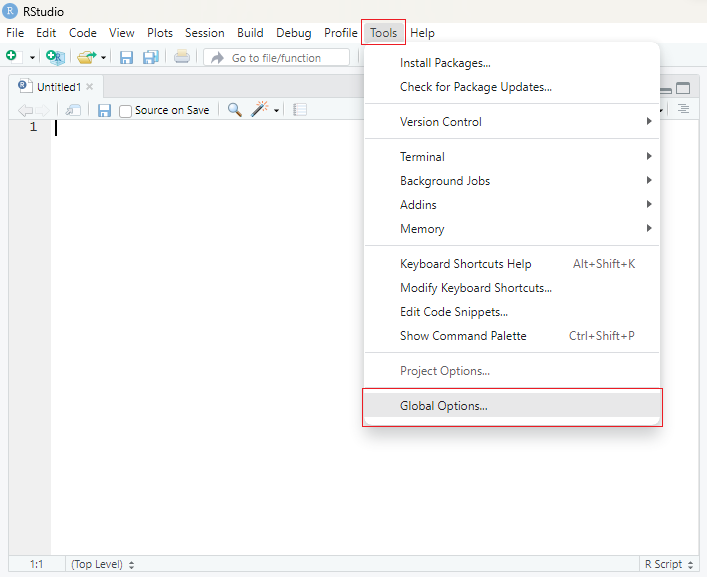
Fig 2: Checking Which Version of R is running in RStudio
From there you will see the version of R you are running.
If you have two or more versions of R installed on your machine, version 4.3.2 that we installed together and whichever version you may have already had before, click “change”.

Fig 3: Checking Which Version of R is running in RStudio
From there select “choose a specific version of R” and select version 4.3.2 then click “OK” and restart RStudio for the changes to take effect.
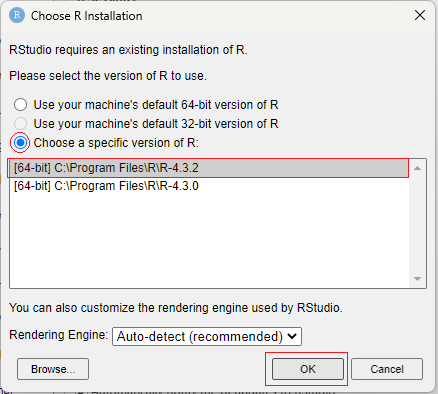
Fig 4: Choosing a different version of R
Once you have restarted RStudio we have to install a few dependencies.
#Algorithmic Trading With RStudio And MetaTrader 5
#Gamuchirai Zororo Ndawana
#This script will help you get your environment setup and test that everything is working fine
#Sunday 17 December 2023

#Installing Dependencies
install.packages("stringi")             #This package is a dependency for devtools
install.packages("devtools")            #We will use this package to install R packages hosted on github
install.packages("xts")                 #We will use this package to plot data fetched from the MetaTrader 5 Terminal
install.packages("quantmod")            #We will use this package to plot data fetched from the MetaTrader 5 Terminal
install.packages("ttr")                 #We will use this package to calculate technical indicator values
install.packages("reticulate")          #We will use this package to call Python libraries in R
devtools::install_github("Kinzel/mt5R") #We will use this open source package to interact with the MetaTrader 5 Terminal
Let's start by importing the first library, which is "reticulate." This library enables us to execute Python code within R. We'll utilize reticulate to install the MT5 Python Library in a virtual environment. Once the MT5 Library is installed, we can use reticulate as a bridge between our RStudio session and the Python virtual environment. This intermediary connection allows us to send commands to our MetaTrader 5 terminal, facilitating the execution of trades.
We start by loading the reticulate library.
#Libraries
#Importing reticulate
library(reticulate)
Next, we'll create a virtual environment using the `virtualenv_create()` function within the reticulate library. This function takes a string parameter, representing the name of our virtual environment. In programming, virtual environments offer a method to construct isolated and self-contained spaces for individual projects. The fundamental rationale behind employing virtual environments is to effectively manage dependencies, mitigate conflicts, and uphold project reproducibility. This becomes especially pivotal when multiple projects or packages share common dependencies but need different versions of the same dependencies.
#Create a virtual environment
virtualenv_create("rstudio-metatrader5")
Once the virtual environment has been established, the next step is to activate and utilize it. This is accomplished by employing the `use_virtualenv()` function within the reticulate library. Activating the virtual environment ensures that subsequent Python operations are executed within the isolated context of this environment, allowing us to manage dependencies and configurations specific to our project.
#Use the virtual environemnt
use_virtualenv("rstudio-metatrader5")
Moving forward, let's install the MetaTrader 5 Python Library using the `py_install()` function within the reticulate library. We provide the function with the name of the library we intend to install, which, in this instance, is "MetaTrader5."
#Install metatrader5 python library
py_install("MetaTrader5")
After installing the library, the subsequent step involves importing the MetaTrader5 library and storing it in a variable named `MT5`. This is achieved by using the `import()` function from the reticulate library. The variable `MT5` will serve as our interface for interacting with the MetaTrader 5 library in subsequent steps.
#Import MetaTrader 5
MT5 <- import("MetaTrader5")
Before proceeding, please make sure that the MetaTrader 5 terminal is not currently running. If it is running, kindly close it.
Now, let's launch the MetaTrader 5 Terminal directly from our RStudio session. We can achieve this by invoking the `initialize` function from the MetaTrader5 Python Library. If the initialization is successful, the function will return TRUE, indicating that the MetaTrader 5 Terminal has been successfully launched.
#Initialize the MetaTrader 5 Terminal
MT5$initialize()
[1] TRUE
While we have the capability to access account information, terminal details, symbol specifics, we encounter our first limitation: the inability to programmatically log in to a different account. The account that is active during the terminal initialization becomes the sole account accessible unless manually changed by the user. While it's feasible to create a Python script to log in to a different account using the MetaTrader 5 Library and execute it from R using reticulate, this article assumes readers possess only R programming knowledge along with a basic understanding of MQL5 programming.
The subsequent limitation revolves around the inability to request historical price information using reticulate. This constraint may stem from reticulate automatically converting datatypes behind the scenes as objects pass between R and Python. Consequently, it seems to encounter difficulty handling the object returned when requesting historical price data from the terminal. This is where we make use of a second package to patch the short comings of reticulate.
#Get account information
account_info <- MT5$account_info()

#Print account information
account_info$company
account_info$balance
account_info$name

#Get terminal information
terminal_info <- MT5$terminal_info()

terminal_info$build
terminal_info$company
terminal_info$name
[1]"Deriv.com Limited"
[1]868.51
[1]"Gamuchirai Ndawana"
[1]4094
[1]"MetaQuotes Software Corp."
[1]"MetaTrader 5"
#Requesting price data
price_data <- MT5$copy_rates_from_pos("Boom 1000 Index",MT5$TIMEFRAME_M1,0,10)
Error in py_call_impl(callable, call_args$unnamed, call_args$named) :
SystemError: <built-in function copy_rates_from_pos> returned a result with an exception set
Run `reticulate::py_last_error()` for details.
We will use MT5R to address these issues. But first let’s understand how MT5R is operating underneath the hood.
The MT5R package establishes a WebSocket connection between RStudio and the MetaTrader 5 Terminal, creating a full-duplex communication channel. In a full-duplex system, data can be sent and received simultaneously. For this channel to be effective, the MetaTrader 5 terminal needs to be listening on a specific port, which we will use to transmit instructions. Additionally, it must communicate with our RStudio session on the same port. Fortunately, MT5R includes an Expert Advisor written in MetaQuotes Language 5 that listens for our commands. This advisor is open source, providing the flexibility to incorporate additional functionality if necessary. Furthermore, if you’d like the source code you can download it here. Please note that we have attached a customised version of the expert advisor along with the article, our customised version includes an additional function to automatically place trailing stop losses and take profits.
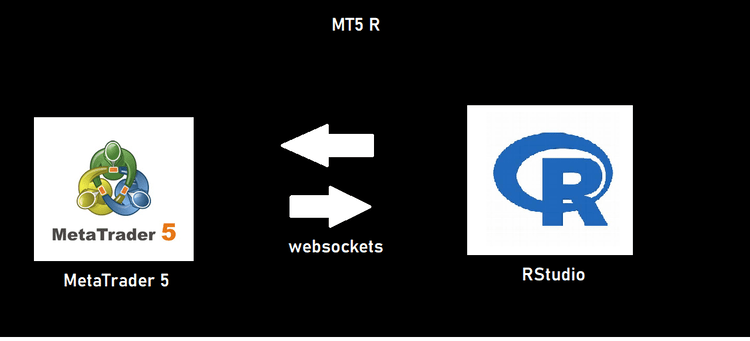
Fig 5:MT5R Diagram
Once you have downloaded the expert advisor, you need to place it in the same files as your other expert advisors. Simply open your MetaTrader 5 Terminal, press “file” and then “open data folder”.
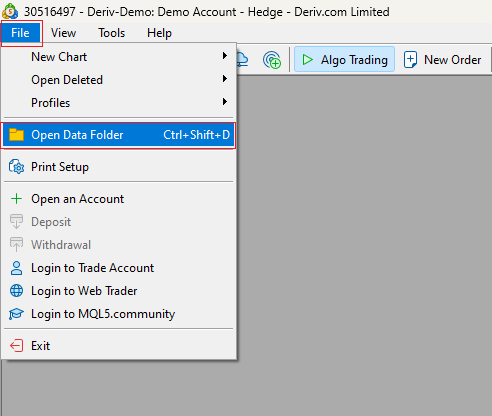
Fig 6: Finding your data folder
Then navigate to “.\MQL5\experts\” and place the Advisor in your experts folder. Once complete, open the symbol you desire to trade then place the MT5R expert advisor on the chart. Your computer may prompt you asking if permission should be granted to allow MetaTrader 5 to make use of network operations on your machine, grant permission. Once that is done, we are ready to return to RStudio and continue building our trading algorithm.
Open RStudio and import the MT5R, xts and quantmod Library.
#Import the MT5R Library
library(mt5R)
#Import xts to help us plot
library(xts)
#Import quantmod to help us plot
library(quantmod)
Then we check if our connection to the terminal is established using the Ping() function in the MT5R package. The function returns TRUE if it was able to communicate with the Expert Advisor.
#Check if our connection is established
MT5.Ping()
#Global variables
MARKET_SYMBOL <- "Volatility 75 Index"
[1] TRUE
MT5R does not address the login issue we discussed earlier however it does address the issue of requesting price data.
To request price data from our MetaTrader 5 terminal we call the GetSymbol function from our MT5R library. The function expects the name of the symbol, followed by the time frame in minutes so daily data would be 1440, and lastly the number of rows. The data is returned with the oldest data at the top and the current price at the bottom.
Note that we set the xts parameter to true. This will convert the data frame to an R timeseries object and automatically format the dates in your plot behind the scenes. It also allows us to easily add technical indicator values into our data frame.
#Request historical price data
price_data <- MT5.GetSymbol(MARKET_SYMBOL, iTF = 1, iRows=5000,xts = TRUE)
We can easily plot the price data using a function from quantmod called lineChart()
#Plotting a line chart
lineChart(price_data, name = MARKET_SYMBOL) 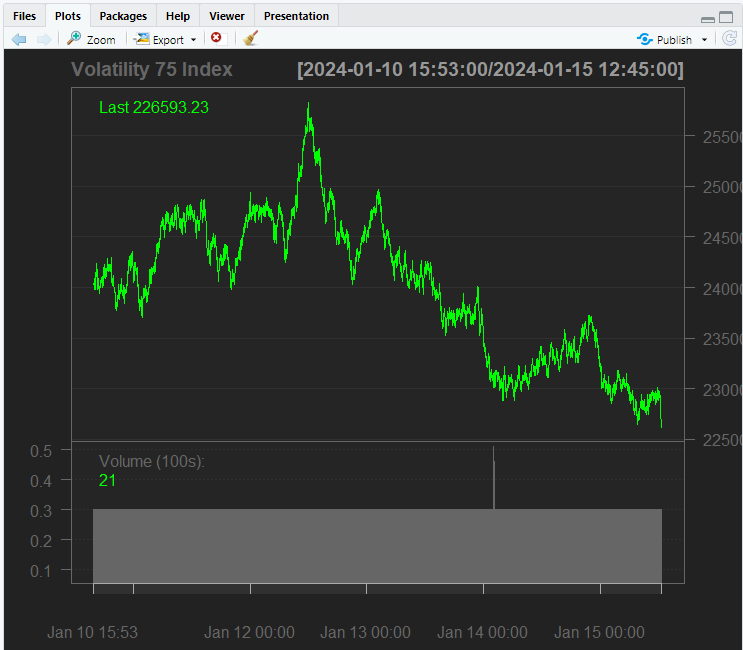
Fig 7: Plotting price data in RStudio
We can also add technical indicators to our plot using the addIndicator function in quantmod, for example we will add a 60 period Relative Strength Index to our plot.
#We can also add technical indicators to the plot
addRSI(n=60)
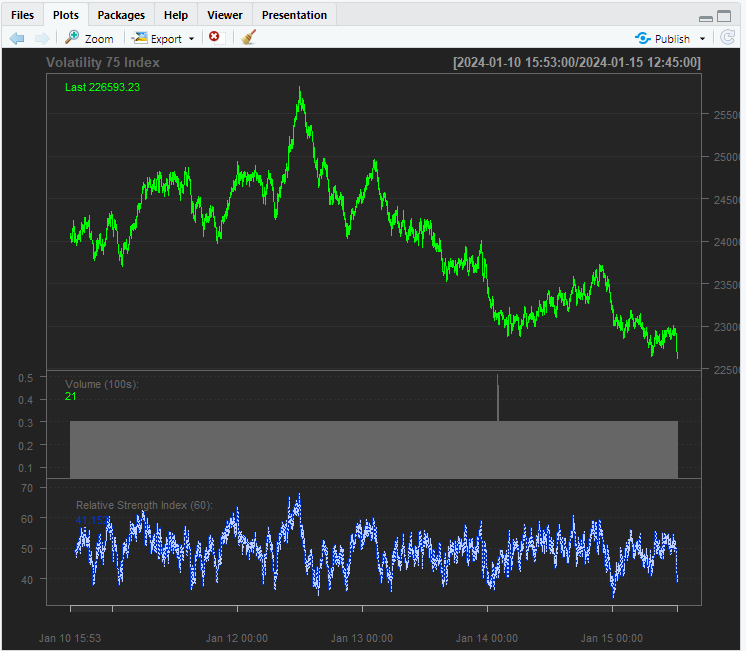
Fig 8: Adding Technical Indicators to our plot
Processing Your Data
When we added the RSI and the Aroon indicator, we only added them to the plot, to add technical indicator values to our data frame, we must call the indicator from the quantmod package and then pass it the corresponding columns needed for calculations. The corresponding columns are specified in the documentation, in this example we will add a 20-period simple moving average, a 20-period Relative Strength Indicator and a 20-period Average True Range indicator to the data frame.
#Add moving average
price_data$SMA_20 <- SMA(price_data$Close,n = 20)
#Add RSI to the dataframe
price_data$RSI_20 <- RSI(price_data$Close,n=20)
#Add ATR to the dataframe
price_data$ATR_20 <- ATR(price_data[,c("High","Low","Close")], n=20)
Once that is done, we will drop all rows with missing values.
#Drop missing values
price_data <- na.omit(price_data)
We will add a feature called “next close” that contains the next close price. If next close is greater than close our target will be one otherwise zero. This is done using the ifelse function in R.
#Next close price
price_data$Next_Close <- lag(price_data$Close,-1)

#Setting up our target
price_data$Target <- ifelse( ( (price_data$Next_Close) > price_data$Close) , 1 , 0)
Afterwards we are ready to perform our train test split. We will use the first 4000 rows for training, and the remainder will be for testing. When working with time series data, we steer clear of random splitting practices to avoid data leakage – a situation where the model unintentionally learns from future information to predict the past. Instead, we prioritize maintaining the natural time order of the data. In practical terms, we select the initial 4000 rows in their chronological sequence and follow suit with the remaining rows. This approach ensures our model learns from past data to predict the future, upholding best practices in time series analysis.
#Train test split
train_set <- price_data[1:4000,]
train_y <- price_data[1:4000,c("Target")]

test_set <- price_data[4001:4980,]
test_y <- price_data[4001:4980,c("Target")]
Now that we've divided our data into training and testing sets, the next step is to train your chosen model. In this instance, we opt for Quadratic Discriminant Analysis (QDA). QDA is geared towards maximizing the distinction between two classes, facilitating more effective data classification. It accomplishes this by maximizing the separation between the means of the two classes and minimizing the spread from the mean within each class. To implement QDA, we make use of the MASS library, which houses the QDA model. Therefore, we import the MASS library to access and employ the QDA model in our analysis.
#Fitting models
library(MASS)
#Quadratic Discriminant Analysis
#Using OHLC Data
qda  <- qda(Target ~ Open+High+Low+Close,data = train_set)
qda
Call:
qda(Target ~ Open + High + Low + Close, data = train_set)
Prior probabilities of groups:
0 1
0.49925 0.50075
Group means:
Open High Low Close
0 365424.6 365677.8 365159.9 365420.5
1 365125.4 365384.0 364866.6 365131.4
We can see from the confusion matrix that our model is predicting up movements better than down movements in the market.
#Evaluating model performance
#Custom Quadratic Discriminant Analysis
qda_predictionts <- predict(qda,test_set)
qda_predictionts <- qda_predictionts$class

#Confusion matrix
table(qda_predictionts,test_y)

Fig 9: Confusion matrix
Implementing Your Trading Logic
We have reached the fundamental essence of our trading algorithm, where the initial imperative is the establishment of a variable designated as last_trade. This variable assumes significance as it serves the pivotal function of monitoring the most recent trade initiated. Its importance lies in facilitating the timely closure of positions when our model predicts an adverse market movement that could potentially undermine our overall market exposure. It is pertinent to recall our uncomplicated encoding system, wherein a value of 1 signifies a purchase (BUY), while a value of 0 denotes a sale (SELL).
#Keeping track of the last trade
last_trade <- -1
In operationalizing our algorithm, it is imperative to initiate an infinite loop, within which our trading logic is intricately nested. This perpetual loop is achieved through the incorporation of a timeout function, thereby regulating the frequency of iterations. Aligning with the generation of new candles, we aim for synchronous iteration cycles. The integration of the Sys.sleep function ensures our trading actions align with the rhythm of the market's minute-by-minute changes.
Our first step is to fetch current market information.
Then we pass the data to our model and get a forecast.
Once our model has made a forecast, we check if we have any open positions using the MT5 package we installed with reticulate. If we have no open positions, then we proceed to open a position in the direction of the market forecast and then update our last_trade variable.
Otherwise, if we have a position open, we will check if our model is forecasting an adversarial move against it, and if it is, we will close the position.
Then lastly, we need to add a timeout, so that our algorithm checks on our position once every bar.
while(TRUE){
  #Fetching current market data
  print("Fetching market information")
  data <- MT5.GetSymbol(MARKET_SYMBOL,iTF=1, iRows = 2)
  data <- data[1,]

  #Forecasting market move
  qda_forecast <- predict(qda,data)
  qda_forecast <- qda_forecast$class
  print("Model forecast: ")
  print(qda_forecast)
  #Checking if we have no open positions
  current_positions <- MT5$positions_total()

  #If we have no open positions, open a position following the model forecast
  if(current_positions == 0){
    print("We have no open positions. Opening a new position")

    #A Forecast of 1 means buy
    if(qda_forecast == 1){
      print("Opening Buy Position")
      MT5$Buy(MARKET_SYMBOL,symbol_info$volume_min)
      last_trade <- 1
    }
    #A Forecast of 0 means sell
    if (qda_forecast == 0){
      print("Opening Sell Position")
      MT5$Sell(MARKET_SYMBOL,symbol_info$volume_min)
      last_trade <- 0
    }
  }

  else{
      #Are we anticipating a move against our open position?
      if(last_trade != qda_forecast){
        #If we are, let's close our position
        print("Closing open position")
        MT5$Close(MARKET_SYMBOL)
        #Reset last trade
        last_trade <- -1
      }

    else{
      #Otherwise everything is expected to be fine
      print("The current position is aligned with the market")
      info <- MT5$account_info()
      print("Current Profit")
      print(info$profit)
    }

  }
  #Wait for a new candle to form
  Sys.sleep(60)
}
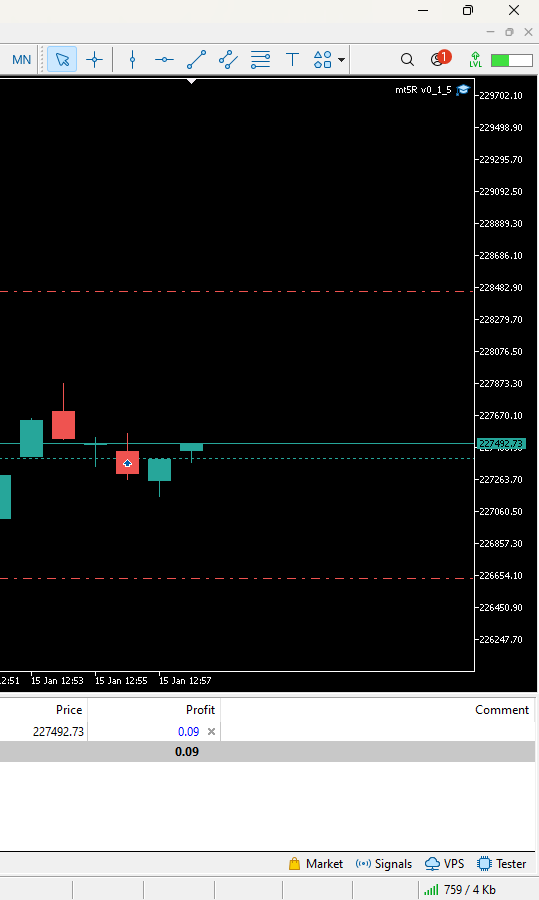
Fig 10: Quadratic Discriminant Analysis Model in R Trading In MetaTrader 5 in real time.
Conclusion
In conclusion, despite encountering challenges in developing a real-time trading algorithm using R and MetaTrader 5, this article demonstrates that the task is more approachable than it may initially seem. Even individuals with a beginner's grasp of R can achieve significant progress. The limitations of individual packages are effectively mitigated by complementary packages, and notably, the approach adopted minimizes dependencies. Overall, it presents a viable and robust framework accessible to any R user.
Additionally, a customized version of the MT5R expert advisor, appended herewith, is designed to autonomously incorporate stop losses and take profits, aiding in trade management. Users are encouraged to enhance its functionality as needed. Wishing you peace, prosperity, and profitable trades until our paths cross again.
 Modified Grid-Hedge EA in MQL5 (Part II): Making a Simple Grid EA
 MQL5 Wizard Techniques you should know (Part 10). The Unconventional RBM
 Mastering Model Interpretation: Gaining Deeper Insight From Your Machine Learning Models
- Free trading apps
- Over 8,000 signals for copying
- Economic news for exploring financial markets
You agree to website policy and terms of use
when is the new article on R ?
If you need complex actions with the trading environment, then it is better to do it inside mql5. It is unlikely that everything will be available from R.
When is the new article on R?
Hi, I am learning this library with MT4 but whenever an error occurs and R crashes, the whole MT5 also crashes and disconnects. I have created error handling functions to work around this issue. I wonder if you are facing the same issue and how do you solve the crash issue? Thanks
Hi, I am exploring this library with MT4, but whenever an error occurs and R crashes, the whole MT5 also crashes and shuts down. I have created error handling functions to get around this problem. Wondering if you are facing the same problem and how do you solve the crashing issue? Thanks