Category Theory in MQL5 (Part 4): Spans, Experiments, and Compositions
Introduction
In the previous article, we saw how category theory can be potent in complex systems via its concepts of products, coproducts, and the universal property, examples of applications of which in finance and algorithmic trading were shared. Here, we will delve deeper into spans, experiments, and compositions. We will see how these concepts provide a more nuanced and flexible way of reasoning about systems, and how they can be used to develop more sophisticated trading strategies. By understanding the underlying structure of financial markets in terms of category theory, traders can gain new insights into the behavior of financial instruments, construct more sophisticated portfolios, and develop more effective risk management strategies. Overall, the application of category theory in finance has the potential to revolutionize the way we think about financial markets and to enable traders to make more informed decisions.
Spans, Experiments, and Compositions
In category theory, a span is a construction that relates three objects and two morphisms between them. Specifically, a span is a diagram of the form:
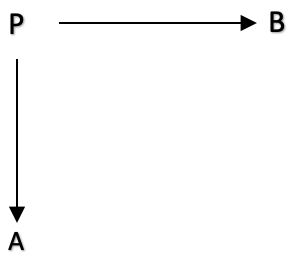
This very basic diagram that can also be represented with the single line below:
A<--- f --- P --- g --->B
where A, B, and P, are domains in a category, and f: P to A, and g: P to B, are morphisms in the category. The morphisms f: P to A, and g: P to B, are called the legs of the span.
The span, P, can be thought of as a way of relating two different paths or perspectives between A and B, one via f and the other via g. The legs f and g connect these paths at A and B respectively, and allow for comparison and composition of the two paths.
Let's start by going over the theory first, before diving into possible application within MQL5.
Spans are important in category theory because they provide a way to compare two different morphisms in a category. Given two morphisms f: A → B and g: A → C, a span from B to C is a diagram of the form B ← A → C, where the two arrows represent the morphisms f and g. Spans are often used to define limits and colimits in category theory. For example, a limit of a diagram in a category can be defined as a universal cone over that diagram, where a cone is a span from the limit object to each object in the diagram that satisfies certain conditions.
Spans are also useful in defining pullbacks, which are a type of limit in which the objects involved are related by a pair of morphisms. Given two morphisms f: A → B and g: A → C in a category, a pullback of f and g is an object P together with two morphisms p1: P → B and p2: P → C such that f ∘ p1 = g ∘ p2 and P is universal with respect to this property. Pullbacks are important in many areas of mathematics and science, including algebraic geometry, topology, and computer science.
Another important concept in category theory is the experiment, which is a diagram consisting of two parallel morphisms and a third morphism connecting their codomains. An experiment can be thought of as a way of comparing two different ways of transforming an object in a category. For example, given two morphisms f: A → B and g: A → C, an experiment from B to C is a diagram of the form A → B ⟶ D ← C, where the arrows represent the morphisms f, g, and h, respectively. Experiments can be used to define limits and colimits in a similar way to spans, and they are also useful for defining coequalizers, which are a type of colimit that can be used to identify two different morphisms that have the same codomain.
Composites are a fundamental concept in category theory that arises from the composition of two or more morphisms. Given two morphisms f: A → B and g: B → C, their composite is a morphism g ∘ f: A → C, which is obtained by applying f followed by g. Composites are associative, meaning that (h ∘ g) ∘ f = h ∘ (g ∘ f) for any three morphisms f, g, and h. This property allows for the composition of many morphisms at once, and it is used to define the notion of a category, which is a collection of objects and morphisms that satisfy certain axioms.
Here are ten impromptu applications of spans, experiments, and composites in category theory in finance and trading:
- Spans could model the underlying assets of a financial derivative and the hedging instruments used to replicate its payoffs. Universal-property of the span would help define the derivative’s price.
- Efficient portfolio construction by composites through combining different asset classes in a way that minimizes risk and maximizes return. This can be guided by using the universal-property of a composition.
- Spans could model the risk exposure of a financial institution to different market factors. This can be achieved by constructing a span that connects the institution's assets to the relevant market indices.
- Experiments could test the performance of different trading algorithms under various market conditions. This can be simulated by constructing an experiment that mimics market behavior and measuring the performance of the algorithm on the simulated data.
- Modelling the behavior of financial systems at a zoomed-out scale is something compositions of domains could help with. For instance looking at how various sectors of SP500 correlate in different longer cycles could be an application.
- Spans can model the replication of a particular financial instrument using a combination of simpler instruments. This is useful in designing new financial instruments that have desirable properties like less correlations to existing ones.
- Experiments could test trading strategies by comparing the performance of a particular strategy against a control group. This could be accomplished once again using the universal-property of the experiment.
- Experiments can also test the efficiency of different market microstructure designs. By constructing an experiment that simulates the behavior of different types of market participants and measuring the resulting market outcomes this could be done.
- Composites could model the overall risk exposure of a financial institution. This can be done by constructing a composite of the institution's various business lines and analyzing their interdependence.
- Spans could model the relationship between different financial data sources. This could design machine learning algorithms that can extract useful features from disparate data sources.
To illustrate this concept’s application, we can describe a span ‘experiment’ that involves finding whether there is a relationship between the profit on a security’s long open trade position and a pair of other variables namely the security's moving average and the security's average true range. This ‘experiment’ can be represented as a diagram that involves an apex, two domains, and morphisms between them.
Let’s say we have a category C that contains two domains, A and B, that represent the domains of the moving average and the domain of the average true range, respectively. And in this category, we also have a domain P that represents the long position profit and acts as our apex.
We can then go on to define two morphisms f: P -> A and g: P -> B that map the long position float P to its observables in domains A and B, respectively. These morphisms represent the logging of the observables.
This diagrammatic representation allows us to analyse the experiment in a more abstract and formal way, and to apply the concepts and tools of category theory to reason about it.
To perform the ‘experiment’, we open a buy order on the current chart symbol, say EURUSD, 0.1 lots and then at each new bar we log the current float, MA, and ATR. Based on the observed data, we can see if there are any correlations between the data and this can then be used in coming up with an ideal trailing stop system for long positions. The indicators used here of MA and ATR can easily be substituted for what the reader deems more appropriate. I have only chosen these for illustration.
If we run this experiment on EURUSD on the hourly timeframe on the 1st of March, this will be some of our data.
| P: (Float/ Profit) | A: ATR | B: MA |
| -6.60000 | 0.00203 | 1.12138 |
| -14.90000 | 0.00181 | 1.12136 |
| -18.80000 | 0.00175 | 1.12140 |
| -24.20000 | 0.00157 | 1.12125 |
| -29.00000 | 0.00146 | 1.12100 |
| -24.30000 | 0.00127 | 1.12078 |
|
|
|
|
If we do lagging correlations between each of our two domain data sets A & B with the position profit, this can help set whether each of these domains could forecast negative drawdowns in a position. This information will help in setting or moving an existing stop-loss on a long position.
Another way these spans could help in defining a stop-loss could be if we hypothesise that each of the terminal domains A & B via their respective morphisms f & g do form a coproduct (sum) of how far the ideal stop-loss should be for long positions. These morphisms are in essence functions that take input and provide output. In this case each of the terminal domains would provide its indicator value as input and each of the functions f and g would provide an output double value.
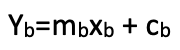
Summing these double values, the equivalent of a coproduct, would give us the ideal stop-loss price. If we take it that the morphisms’ output (stop-loss price) has a linear relationship with the morphism’s indicator inputs, then these equations are implied.
![]()
where xa ⊆ A and ma and ca are slope and y-intercept coefficients of the linear relation. Similarly, for B domain
This hypothesis is for a linear relationship between the ideal stop-loss delta and the indicator values. If this relationship were a curve then the above equations would be quadratic, and with more coefficients and exponents. Our simpler option however can be coded as indicated below.
double _sl=((m_ma.Main(_index)*m_slope_ma)+(m_intercept_ma*m_symbol.Point()))+((m_atr.Main(_index)*m_slope_atr)+(m_intercept_atr*m_symbol.Point()));
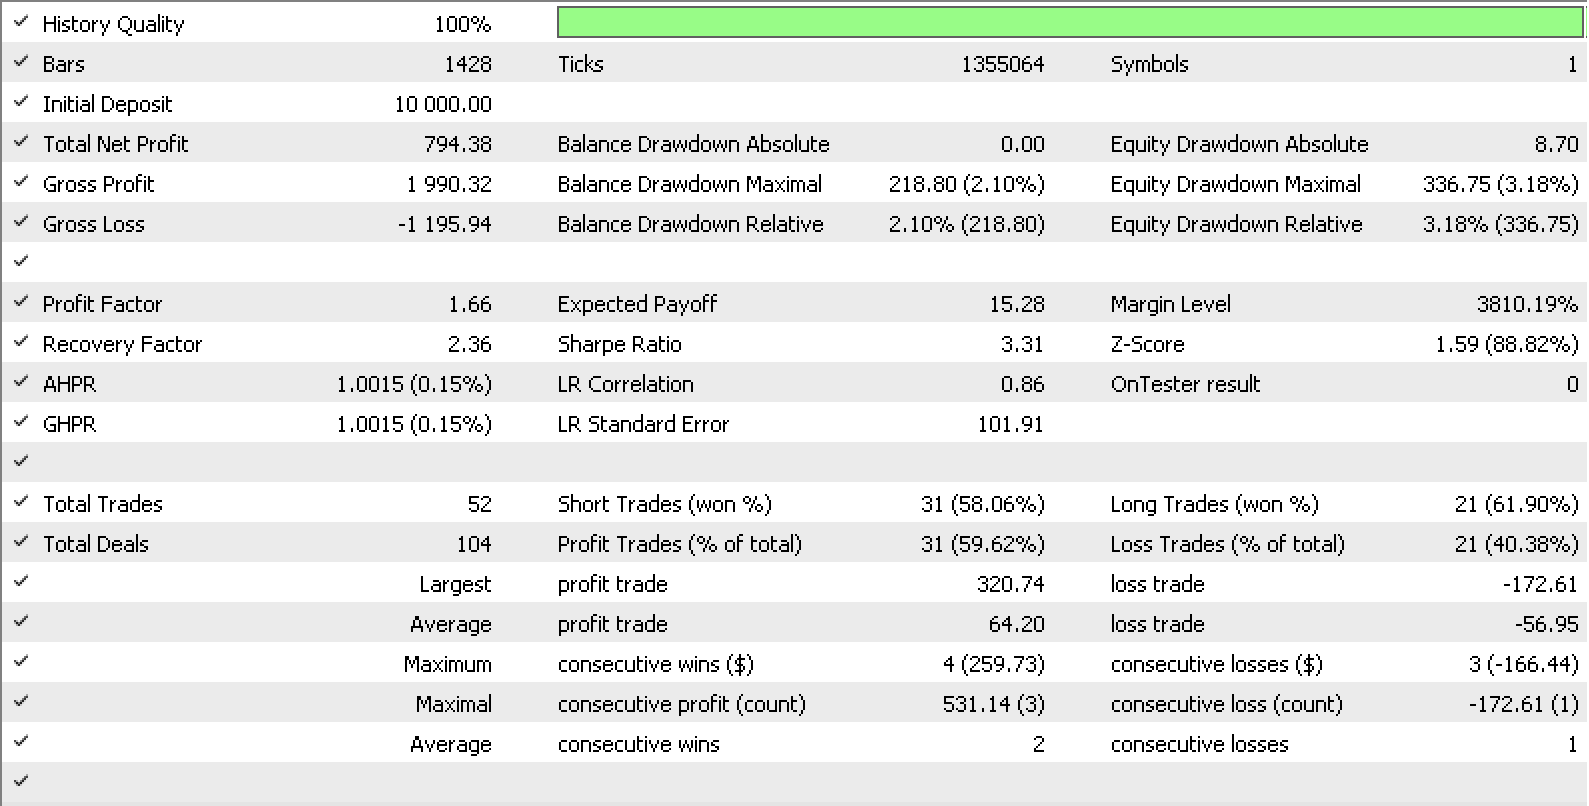
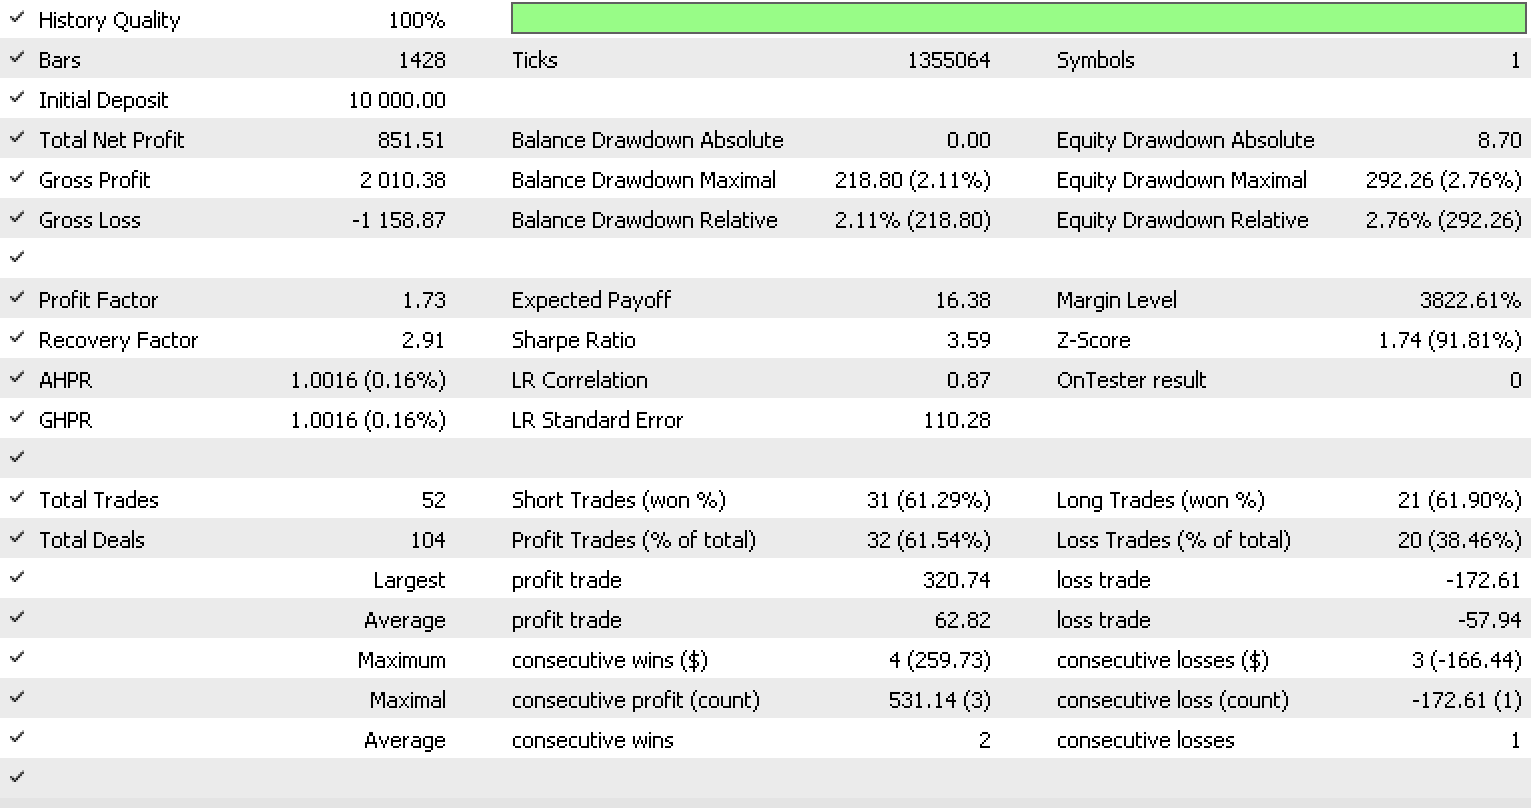
If, using the MQL5 in-built expert trailing class we build our own trailing class that uses our ideal stop-loss delta, then the coefficients m and c for both the A domain and B domain could be inputs for this trailing class. Testing over the past year, for EURUSD on the hour with our signal as the built-in ‘signalRSI.mqh’ class, give us the report and curve represented below.

The ideas indicated here could be developed further if we look at composite spans.
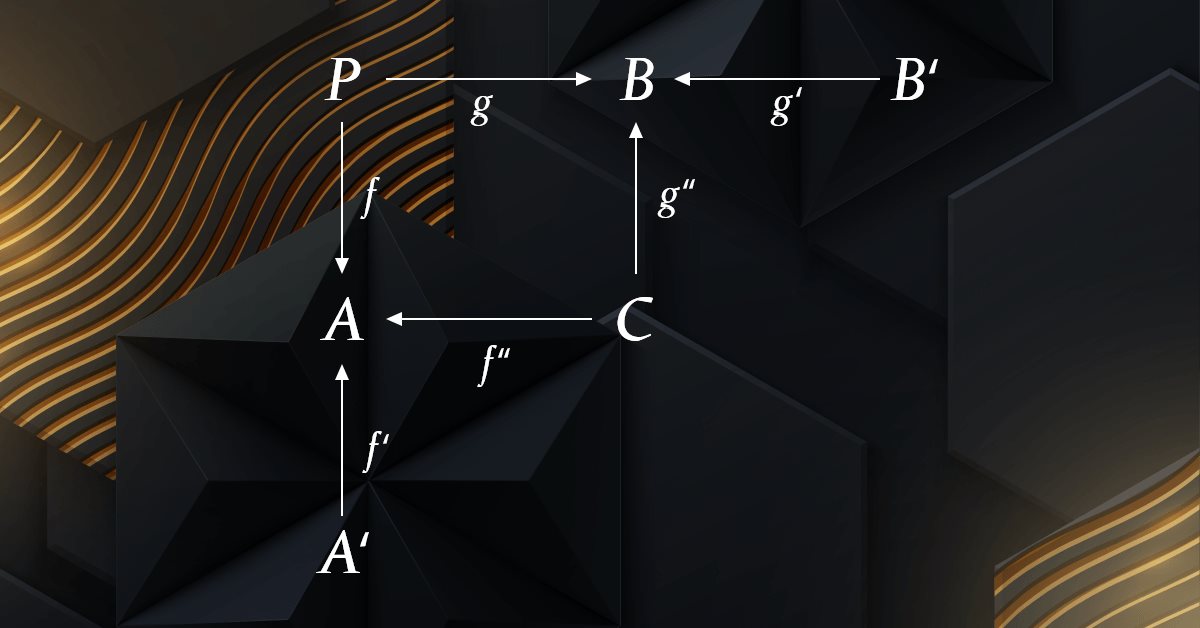
A composite span is a span of spans. In our case we could make the argument that our indicator values are lagging, say slightly. This slight lag could be leading to less accurate prices for our trailing stop. In order to address this, we could re-constitute domains A and B as spans. A would be changed to a product of A’ and C, while B would be of C and B’.

Composite spans that map to subdomains A', C, and B’ can help optimise the morphisms f: P to A, g: P to B, f’: A’ to A, f’’: C to A, g’’: C to B, and g’: B’ to B in fine tuning our trailing stop system by providing a more granular view of the data and relationships between observables in domains A and B.
In re-constituting A and B, we are now viewing them as products of A’ & C for A and C & B’ for B. Remember P is a sum of A & B but these will be products. We know ATR is the average true-range of price over a set period so it is mathematically equivalent to product between the inverse of the period length, and the sum of price-ranges over that length meaning we have A’ for our period length inverse and C for our prices sum. Conversely, the MA is equivalent to the product of an inverse of a period and the sum of recent-prices. So, in this case we also have the same product arrangement we have at span A.

The domain C is labelled as price and if we are to be a bit pedantic this seems contradictory in that that price availed to the ATR (A), is a sum of the true-range values over a period where as that given to the MA is simply the SUM current close prices.
This is where Category theory’s unwritten rule of focusing on morphisms between domains and not on unpacking what is in a domain comes in handy. Because with it we can, not only easily assemble our diagram as simply as shown above but can also easily identify possible universal properties. Universal properties are what set our approach here apart from other numerous math methods that are typically used in optimising or solving for missing values.
As far as we’re concerned domain C represents price. How that domain processes out price ranges versus close prices is not in the scope of this article and in fact for our purposes does not affect the end result.
However, before we look at applicable universal properties it is helpful to note that by breaking down the data into these subdomains, it becomes easier to identify patterns and correlations between the different observables, which can help optimise not just the morphisms f and g, but also f’, f’’, g’, and g’’.
Once again for brevity we can take the relationships between the added terminal domains A’, C, and B’ to be linear meaning the equation formats above will still be applicable.
If as above we do run tests now with more inputs as the number of morphisms has tripled, we do get the following report and test curve.

There is clearly improvement in the overall performance of the trailing system. However, this could be attributable to over fitting as the number of input parameters went up 3-fold from the previous test.
Returning to the concept of universal property, our composite span does present us with two candidates for this concept. Firstly, in the domain A span, since domain A’ and domain C, are terminal, a universal morphism is implied between A’ and C.
If we label these morphisms f’’’ and g’’’ for C to A’ and C to B’ respectively, we do imply there are relationships between price and the period chosen for ATR. Likewise, there would be a relationship between price and the period for MA indicator.
As has been the hypothesis in the morphisms above, the relationship between price and the indicator periods can be linear meaning we stick to the simple equation format above or it could be a curve meaning we pick our highest exponent and adopt a quadratic equation.
If we however stick to linear relationships, and building on our last version of the trailing class we keep the constants to all morphisms (with the exception of f’’’ and g’’’) constant (unaltered and always using default values), we could run comparative tests over the same period and see how it performs compared to our previous trailing classes.
This is the testing result.


The results are not the best of the three reports but the level of performance with fewer inputs and while using the universal-property principles does mean this could be an idea worth examining over longer periods? As always, all code posted here is not a grail or complete trading system so readers are urged to do their own research and diligence before even using any parts of it.
Conclusion
In conclusion, we have seen how spans, experiments, and compositions in category theory could be used in setting exit trading strategies. Spans are a cell unit of a pairing of ideas/precepts or systems represented here as domains. This pairing does provide experiments which are in essence the universal property of this span. Composition takes the span and augments it with other spans in order to come up with more insightful systems and methods which in our case here were useful in fine tuning the exit strategy of a trading system.
Warning: All rights to these materials are reserved by MetaQuotes Ltd. Copying or reprinting of these materials in whole or in part is prohibited.
This article was written by a user of the site and reflects their personal views. MetaQuotes Ltd is not responsible for the accuracy of the information presented, nor for any consequences resulting from the use of the solutions, strategies or recommendations described.
- Free trading apps
- Over 8,000 signals for copying
- Economic news for exploring financial markets
You agree to website policy and terms of use