
Developing a Replay System — Market simulation (Part 13): Birth of the SIMULATOR (III)

Introduction
The previous article Developing a Replay System — Market simulation (Part 12): Birth of the SIMULATOR (II) was a preparation for this article. Today we will make some changes to the simulation system to achieve greater consistency in the data. At the same time, we will make some big changes to make the system more efficient in terms of processing. We will need this in the next steps of creating our replay/simulation system. The point is this: in order for the system to actually be usable by either the replay or the simulator, we need it to have consistent behavior, or at least as consistent and consistent behavior as possible. We can't just make a system work in a certain way at one point in time and then work completely differently and unpredictably at another point in time.
In the article "Developing a Replay System — Market simulation (Part 02): First experiments (II)", we have created a system that has been usable so far, but it stops being suitable the moment the idea involves simulation and generating pseudo-random data. To be honest, even if we work with replay (using real tickets), the current system is not entirely suitable. This is especially true if the desired asset or day is highly volatile. In this scenario, the current system for creating and presenting 1-minute bars is very inefficient and can sometimes cause synchronization issues. In other words, bars that should take 1 minute to build can sometimes take much longer, giving us the false impression that high volatility moves are easy to follow or trade, which is not true.
The solution to this problem is far from simple, because we will have to change the way it is actually built. You might think that this task would be easy, but it is not. It involves a certain type of modeling that makes it quite difficult if we don't know what we're doing. It took even me (and this is me who is showing you how to do it) all this time to realize that there was something wrong with the bar building system. I only noticed this when I got into the modeling phase where the differences over time really became apparent as it involves some calculations that we'll see later. But even now, don’t think that I can solve this problem. This problem will be solved later, at the next stage of construction. Let's start by making some corrections and introducing a new system for constructing 1-minute bars.
New market replay service
To actually build the 1 minute bars so that we can check them if we need to, we will need to make some changes to the replay service. The first thing we need to change is the service file. Below is a complete picture of what the new replay service file will look like.
#property service
#property icon "\\Images\\Market Replay\\Icon.ico"
#property copyright "Daniel Jose"
#property version   "1.13"
#property description "Replay-simulation system for MT5."
#property description "It is independent from the Market Replay."
#property description "For details see the article:"
#property description "https://www.mql5.com/en/articles/11034"
#property link "https://www.mql5.com/en/articles/11034"
//+------------------------------------------------------------------+
#define def_Dependence  "\\Indicators\\Market Replay.ex5"
#resource def_Dependence
//+------------------------------------------------------------------+
#include <Market Replay\C_Replay.mqh>
//+------------------------------------------------------------------+
input string            user00 = "Config.txt";  //"Replay" config file.
input ENUM_TIMEFRAMES   user01 = PERIOD_M5;     //Initial timeframe for the chart.
input bool              user02 = true;          //Visual bar construction.
input bool              user03 = true;          //Visualize creation metrics.
//+------------------------------------------------------------------+
void OnStart()
{
        C_Replay        Replay;

        Replay.InitSymbolReplay();
        if (Replay.SetSymbolReplay(user00))
        {
                Print(<"Wait for permission from [Market Replay] indicator to start replay...");
                if (Replay.ViewReplay(user01))
                {
                        Print("Permission received. The replay service can now be used...");
                        while (Replay.LoopEventOnTime(user02, user03));
                }
        }
        Replay.CloseReplay();
        Print("Replay service completed...");
}
//+------------------------------------------------------------------+
You can see that this is much simpler, at least at first glance. All the complexity is moved inside the object class, and there is a very good reason for this: TIME. There are still subtle issues here that I will explain throughout the article, however, as in the case of the old service file, some operations were taking away precious milliseconds from the system. Despite attempts to improve the efficiency of the MetaTrader 5 platform, all those milliseconds spent ultimately resulted in reduced performance, so that it took longer to actually process and plot 1-minute bars.
However, if you look more closely, you will see that a new variable has been added for the user. This allows us to create and check the time spent or required to create 1 minute bars. Note that we now only have one call that blocks the bar creation loop. This call will not return except in two very specific situations. But soon you will see what situations we are talking about. Then this loop will run like an infinite loop, but in fact it will be regulated by the function, which will be located inside the object class. Because of this simplification, the actual file is only this one. As for the object class, its complexity has increased. As a result, several functions that were previously public are no longer public and are now private to the class. This is called method concealment. Therefore, the only truly public elements are the functions that are appear in the service file, which can be seen above.
This way we will begin to see the changes that have happened. This will allow an even greater simplification of the service file. The first of the changes is shown below:
                bool ViewReplay(ENUM_TIMEFRAMES arg1)
                        {
                                u_Interprocess info;

                                if ((m_IdReplay = ChartFirst()) > 0) do
                                {
                                        if (ChartSymbol(m_IdReplay) == def_SymbolReplay)
                                        {
                                                ChartClose(m_IdReplay);
                                                ChartRedraw();
                                        }
                                }while ((m_IdReplay = ChartNext(m_IdReplay)) > 0);
                                info.u_Value.IdGraphic = m_IdReplay = ChartOpen(def_SymbolReplay, arg1);
                                ChartApplyTemplate(m_IdReplay, "Market Replay.tpl");
                                ChartRedraw(m_IdReplay);
                                GlobalVariableDel(def_GlobalVariableIdGraphics);
                                GlobalVariableTemp(def_GlobalVariableIdGraphics);
                                GlobalVariableSet(def_GlobalVariableIdGraphics, info.u_Value.df_Value);
                                while ((!GlobalVariableCheck(def_GlobalVariableReplay)) && (!_StopFlag) && (ChartSymbol(m_IdReplay) != "")) Sleep(750);

                                return ((!_StopFlag) && (ChartSymbol(m_IdReplay) != ""));
                        }
Basically the code is the same as before, but we've added tests that were previously run in the service file code. This way, the service file no longer needs to know which chart ID is used to display the replay asset. Thus, this point will expect a global terminal variable to be created by the indicator. But if the user closes the chart or stops the service, this loop will end. However, if everything is ok and the variable is defined while the user has not closed the chart or service, we will get the TRUE value and thus the service will move to the next step, which is shown below.
                bool LoopEventOnTime(const bool bViewBuider, const bool bViewMetrics)
                        {

                                u_Interprocess Info;
                                int iPos, iTest;

                                iTest = 0;
                                while ((iTest == 0) && (!_StopFlag))
                                {
                                        iTest = (ChartSymbol(m_IdReplay) != "" ? iTest : -1);
                                        iTest = (GlobalVariableGet(def_GlobalVariableReplay, Info.u_Value.df_Value) ? iTest : -1);
                                        iTest = (iTest == 0 ? (Info.s_Infos.isPlay ? 1 : iTest) : iTest);
                                        if (iTest == 0) Sleep(100);
                                }
                                if ((iTest < 0) || (_StopFlag)) return false;
                                AdjustPositionToReplay(bViewBuider);
                                m_MountBar.delay = 0;
                                while ((m_ReplayCount < m_Ticks.nTicks) && (!_StopFlag))
                                {
                                        CreateBarInReplay(bViewMetrics);
                                        iPos = (int)(m_ReplayCount < m_Ticks.nTicks ? m_Ticks.Info[m_ReplayCount].time_msc - m_Ticks.Info[m_ReplayCount - 1].time_msc : 0);
                                        m_MountBar.delay += (iPos < 0 ? iPos + 1000 : iPos);
                                        if (m_MountBar.delay > 400)
                                        {
                                                if (ChartSymbol(m_IdReplay) == "") break;
                                                GlobalVariableGet(def_GlobalVariableReplay, Info.u_Value.df_Value);
                                                if (!Info.s_Infos.isPlay) return true;
                                                Info.s_Infos.iPosShift = (ushort)((m_ReplayCount * def_MaxPosSlider) / m_Ticks.nTicks);
                                                GlobalVariableSet(def_GlobalVariableReplay, Info.u_Value.df_Value);
                                                Sleep(m_MountBar.delay - 20);
                                                m_MountBar.delay = 0;
                                        }
                                }
                                return (m_ReplayCount == m_Ticks.nTicks);
                        }
This routine is much more than it seems. You might think it's constantly going in and out. But in fact it's just going back to the service file code in only two cases. The first is if the user pauses the creation of 1-minute bars. The second is when the service is stopped either because the chart is closed or because we no longer have ticks to use. That is, when the service stops for whatever reason. In any other case, we will have a value of TRUE if the end of ticks is reached and FALSE in any other case. The FALSE value will terminate the replay/simulation system, as can be seen from the service code.
Now let's look at what happens the rest of the time when this routine simply gets stuck in the inner loops it contains. Yes, we have 2 loops, each of which is responsible for something very specific. Let's focus on both to make it clear what's going on here. The first loop is highlighted below:
// ... declaring variables ...

                                iTest = 0;
                                while ((iTest == 0) && (!_StopFlag))
                                {
                                        iTest = (ChartSymbol(m_IdReplay) != "" ? iTest : -1);
                                        iTest = (GlobalVariableGet(def_GlobalVariableReplay, Info.u_Value.df_Value) ? iTest : -1);
                                        iTest = (iTest == 0 ? (Info.s_Infos.isPlay ? 1 : iTest) : iTest);
                                        if (iTest == 0) Sleep(100);
                                }
                                if ((iTest < 0) || (_StopFlag)) return false;
                                AdjustPositionToReplay(bViewBuider);
                                m_MountBar.delay = 0;

//... the rest of the code (will be discussed later) ...
This piece of code has a loop that will work in two situations. The first situation is if the service has not been terminated by closing the chart. Pay attention that we are also testing a variable. So what do we do? Note that inside the loop we check some conditions to change the value of the variable, but where do these checks come from? These checks were launched in the previous version inside the service code. However, there was one problem. Each time these checks were run, they took a few milliseconds, but what required the most machine cycles was checking whether the chart was open or not.
Doing this check before the system actually starts plotting 1-minute bars allows us to save machine cycles. However, we need a way out of this loop. So if the user starts the service, we will have an indication that the loop should end. To ensure that it will head towards the bar building system, we set the test variable to a positive value. Now, if for some reason the loop ends and the user has not started building bars, we will return FALSE. This way the service will know that the replay/simulation needs to be completed.
However, if the trigger condition is met, we actually have to do two things: the first is to find the replay/simulation starting point. The function responsible for this will be discussed later in this article. The second thing to do is reset the delay system. This way we can enter the second loop shown below.
// ... Code from the previous loop...

                                while ((m_ReplayCount < m_Ticks.nTicks) && (!_StopFlag))
                                {
                                        CreateBarInReplay(bViewMetrics);
                                        iPos = (int)(m_ReplayCount < m_Ticks.nTicks ? m_Ticks.Info[m_ReplayCount].time_msc - m_Ticks.Info[m_ReplayCount - 1].time_msc : 0);
                                        m_MountBar.delay += (iPos < 0 ? iPos + 1000 : iPos);
                                        if (m_MountBar.delay > 400)
                                        {
                                                if (ChartSymbol(m_IdReplay) == "") break;
                                                GlobalVariableGet(def_GlobalVariableReplay, Info.u_Value.df_Value);
                                                if (!Info.s_Infos.isPlay) return true;
                                                Info.s_Infos.iPosShift = (ushort)((m_ReplayCount * def_MaxPosSlider) / m_Ticks.nTicks);
                                                GlobalVariableSet(def_GlobalVariableReplay, Info.u_Value.df_Value);
                                                Sleep(m_MountBar.delay - 20);
                                                m_MountBar.delay = 0;
                                        }
                                }

// ... The rest of the function ...
This second loop is responsible for the correct functioning of the system. Here we will actually build 1-minute bars. The system will not exit this loop until there is no more data to use or the system is terminated. There is another condition for exiting - when the user pauses. In this case, the function will stop and then be called again, returning to the first loop shown above. Now let's look at why this system is more efficient than the previous version of the replay/simulation service. Here we will call a function that we will see later. It will create 1 minute bars. Don't worry about how it works – just know that the construction is done somewhere else.
But now an important question arises: if you look closely, you will see that each of the ticks, regardless of whether they are actually traded or simulated, must be created at a certain time. The relevant segments are highlighted in the image below:
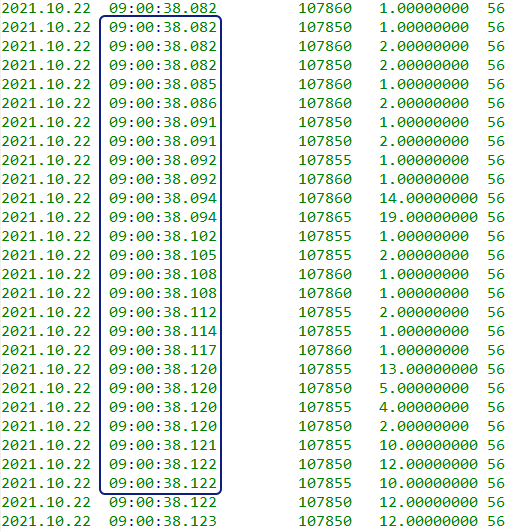
Note that we have hours, minutes and seconds, which don't mean much to us: what really matters to us here in replay/simulation is the number that comes after the seconds, i.e. milliseconds. If you look at these numbers, you will notice that they may seem like a long time. However, what we really need to understand is not the time in milliseconds, but the difference between the time of the last tick and what we are going to show next. In some cases the difference is very small, sometimes less than 2 milliseconds. The previous system couldn't handle this. We need a different, faster system. Despite our attempts, it could not work properly when time was very short as shown in the image above. This time between one call and the next is much less than 10 milliseconds.
But with this new method of plotting 1-minute bars, we can reduce it to less than 1 millisecond on modern computers. And since the bar construction procedure has become quite fast, as we will see later, we no longer need to resort to OpenCL to get the appropriate performance. We can achieve this using only the CPU, without the need for a GPU. However, note that we will no longer be delaying every tick. Let's accumulate things a little bit and then take a short break. The accumulated value and the pause value can be changed, allowing us to make fine adjustments. This way we can get quite appropriate results as shown in the video below. It shows the time the system managed to achieve between 1-minute bars.
The accuracy is not perfect, but we can adjust the values to get a more accurate time. It is not possible to use the operating system's internal counter to achieve this exact time, since this counter cannot handle times lower than 16 milliseconds with good accuracy. However, please note that this work is research work and is not yet finished. It may take some time to find a way to improve the situation, but for now I think that's enough.
We also need to check if the chart is open, this is done from time to time. However, since we will do not do it often, the caused delay will be much lower. Well, all calls will always generate a small delay. We also need to update the position value and capture the current state of the control indicator, which will also lead to a slight execution delay. Also, checking whether the chart is open or not will cause a little loss in performance. However, this will be much lower precisely because the call is made few times per second.
With this we can finish this part. But first, let's look at the other two features that are part of this 1-minute bar building system. The first one looks for the point from which replay/simulation should begin.
                void AdjustPositionToReplay(const bool bViewBuider)
                        {
                                u_Interprocess Info;
                                MqlRates       Rate[def_BarsDiary];
                                int            iPos,   nCount;

                                Info.u_Value.df_Value = GlobalVariableGet(def_GlobalVariableReplay);
                                if (Info.s_Infos.iPosShift == (int)((m_ReplayCount * def_MaxPosSlider * 1.0) / m_Ticks.nTicks)) return;
                                iPos = (int)(m_Ticks.nTicks * ((Info.s_Infos.iPosShift * 1.0) / (def_MaxPosSlider + 1)));
                                Rate[0].time = macroRemoveSec(m_Ticks.Info[iPos].time);
                                if (iPos < m_ReplayCount)
                                {
                                        CustomRatesDelete(def_SymbolReplay, Rate[0].time, LONG_MAX);
                                        if ((m_dtPrevLoading == 0) && (iPos == 0))
                                        {
                                                m_ReplayCount = 0;
                                                Rate[m_ReplayCount].close = Rate[m_ReplayCount].open = Rate[m_ReplayCount].high = Rate[m_ReplayCount].low = m_Ticks.Info[iPos].last;
                                                Rate[m_ReplayCount].tick_volume = Rate[m_ReplayCount].real_volume = 0;
                                                CustomRatesUpdate(def_SymbolReplay, Rate, 1);
                                        }else
                                        {
                                                for(Rate[0].time -= 60; (m_ReplayCount > 0) && (Rate[0].time <= macroRemoveSec(m_Ticks.Info[m_ReplayCount].time)); m_ReplayCount--);
                                                m_ReplayCount++;
                                        }
                                }else if (iPos > m_ReplayCount)
                                {
                                        if (bViewBuider)
                                        {
                                                Info.s_Infos.isWait = true;
                                                GlobalVariableSet(def_GlobalVariableReplay, Info.u_Value.df_Value);
                                        }else
                                        {
                                                for(; Rate[0].time > m_Ticks.Info[m_ReplayCount].time; m_ReplayCount++);
                                                for (nCount = 0; m_Ticks.Rate[nCount].time < macroRemoveSec(m_Ticks.Info[iPos].time); nCount++);
                                                CustomRatesUpdate(def_SymbolReplay, m_Ticks.Rate, nCount);
                                        }
                                }
                                for (iPos = (iPos > 0 ? iPos - 1 : 0); (m_ReplayCount < iPos) && (!_StopFlag);) CreateBarInReplay();
                                Info.u_Value.df_Value = GlobalVariableGet(def_GlobalVariableReplay);
                                Info.s_Infos.isWait = false;
                                GlobalVariableSet(def_GlobalVariableReplay, Info.u_Value.df_Value);
                        }
It has not undergone major changes compared to the previous version, but unlike the previous version, in this version we will no longer return any values. Bar creation has been changed to make it more efficient. This may seem like a small thing, but the simple fact of doing it helps a lot. Now one more small detail: the function above is no longer public. It can no longer be accessed outside of our object class. The same applies to the next function responsible for the creation of 1-minute bars.
inline void CreateBarInReplay(const bool bViewMetrics = false)
                        {
#define def_Rate m_MountBar.Rate[0]

                                static ulong _mdt = 0;
                                int i;

                                if (m_MountBar.bNew = (m_MountBar.memDT != macroRemoveSec(m_Ticks.Info[m_ReplayCount].time)))
                                {
                                        if (bViewMetrics)
                                        {
                                                _mdt = (_mdt > 0 ? GetTickCount64() - _mdt : _mdt);
                                                i = (int) (_mdt / 1000);
                                                Print(TimeToString(m_Ticks.Info[m_ReplayCount].time, TIME_SECONDS), " - Metrica: ", i / 60, ":", i % 60, ".", (_mdt % 1000));
                                                _mdt = GetTickCount64();
                                        }
                                        m_MountBar.memDT = macroRemoveSec(m_Ticks.Info[m_ReplayCount].time);
                                        def_Rate.real_volume = 0;
                                        def_Rate.tick_volume = 0;
                                }
                                def_Rate.close = m_Ticks.Info[m_ReplayCount].last;
                                def_Rate.open = (m_MountBar.bNew ? def_Rate.close : def_Rate.open);
                                def_Rate.high = (m_MountBar.bNew || (def_Rate.close > def_Rate.high) ? def_Rate.close : def_Rate.high);
                                def_Rate.low = (m_MountBar.bNew || (def_Rate.close < def_Rate.low) ? def_Rate.close : def_Rate.low);
                                def_Rate.real_volume += (long) m_Ticks.Info[m_ReplayCount].volume_real;
                                def_Rate.tick_volume += (m_Ticks.Info[m_ReplayCount].volume_real > 0 ? 1 : 0);
                                def_Rate.time = m_MountBar.memDT;
                                m_MountBar.bNew = false;
                                CustomRatesUpdate(def_SymbolReplay, m_MountBar.Rate, 1);
                                m_ReplayCount++;

#undef def_Rate
                        }
It requires virtually no explanation. Here we create 1 minute bars one by one and then send them to the chart. We don’t work with ticks yet, i.e., we cannot yet use some MetaTrader 5 resources for replay/simulation. We will implement this in the future. So don't worry about this at the moment. At the same time, we also carry out all the necessary checks and measurements to determine whether it is worth starting to build a new bar or not. This part can be discarded in the future if you want, since all it does is display time metrics between one bar and the previous one. This is quite useful now because it helps us fine-tune the delay values inside the creation loop.
This concludes this part of the presentation of 1-minute bars. Now the system can present them in a very reasonable time, at least for the traded and simulated ticks that were tested. Next we will deal with another problem related to tick replay. As for the ticks themselves, we don't have any additional problems at the moment.
Viewing a RANDOM WALK graph
So far the work has been interesting and even enjoyable. However, we are now faced with something that may be very difficult for some, but it really needs to be done: simulate the launch of all the ticks that might be present in any way on 1-minute bars. I recommend that you attentively follow the explanation presented below. And to keep things simple, I won't show the final version of the simulation system here. The final version will be shown later. The reason is that all of this is quite complex to show in one go.
What we really want and are going to create is the so-called RANDOM WALK. This random walk has some rules. Unlike what is usually programmed, here we cannot allow the system to be completely random. We need to create some mathematical rules to try to direct the movement. Don't get me wrong. A random walk is actually a completely random and unpredictable movement, at least in the short term. But because we don't create completely unpredictable motion, and because we know where it starts and where it ends, the system is not completely random. However, we will still add some randomness inside the bars.
There are several ideas that can be used to make it easier to create a truly random walk. Depending on the specific case, some approaches can be better than others. A less experienced programmer might think that it would be sufficient to use a random number generator and perform some kind of transformation to limit the values to a certain range. This approach, although not completely wrong, does have some disadvantages. If you were to look at the data resulting from such a move on a chart, you would get something similar to the image below:
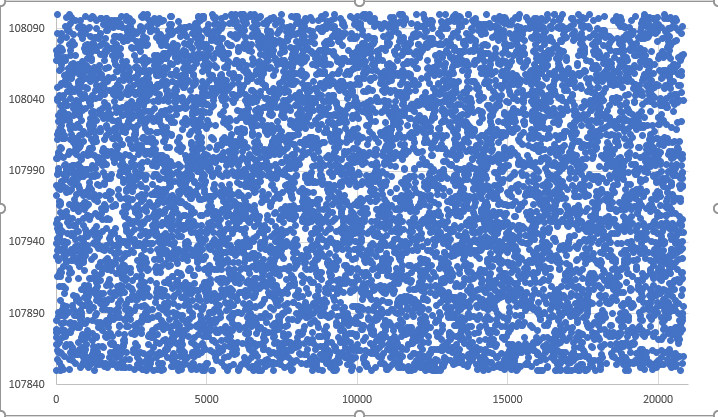
You might think that this graph (YES, this is the graph I'll show you later) doesn't look like random movement at all. It looks more like a complete mess, but in fact it is a random movement that is achieved by jumping between points in time. To achieve this step, we will use the following line of data obtained using the MetaTrader 5 platform. Remember that each line represents a 1-minute bar.
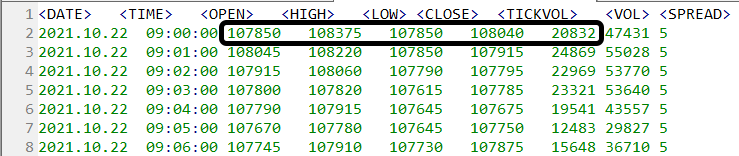
This data will be available in attached files so that you can conduct your own analysis. Now let's continue to understand why the graph above is so unexpectedly different from what we expected. To understand this, you need to know how it was created. To begin with, we need to define two things inside the service file. We will use them temporarily and they will not appear in the source code in the future.
#define def_TEST_SIMULATION
#ifdef def_TEST_SIMULATION
        #define def_FILE_OUT_SIMULATION "Info.csv"
#endif
//+------------------------------------------------------------------+
#property service
#property icon "\\Images\\Market Replay\\Icon.ico"
#property copyright "Daniel Jose"
#property version   "1.13"

// ... The rest of the code...
This definition will allow us to create a simulation check so that we can analyze the graph of the generated movement. On the other hand, this file will contain the data corresponding to the simulated movement within the 1-minute bar. Later we will see where and when this file will be created. Once this is defined, directly in the service file, and before declaring the header files, we can use this definition in the MQH files. Now let's move on to the C_Replay.Mqh file to understand what we will do to get the data.
To actually capture things, in order to get a sense of how the simulator created the movement within a 1-minute bar, we will use the following function.
                bool LoadBarsToTicksReplay(const string szFileNameCSV)
                        {
                                int file;
                                MqlRates rate[1];
                                MqlTick tick[];

                                if (OpenFileBars(file, szFileNameCSV))
                                {
                                        Print("Converting bars to ticks. Please wait...");
                                        ArrayResize(m_Ticks.Info, def_MaxSizeArray, def_MaxSizeArray);
                                        ArrayResize(tick, def_MaxSizeArray);
                                        while ((!FileIsEnding(file)) && (!_StopFlag))
                                        {
                                                FileReadBars(file, rate);
                                                Simulation(rate[0], tick);
#ifdef def_TEST_SIMULATION
        FileClose(file);
        file = FileOpen(def_FILE_OUT_SIMULATION, FILE_ANSI | FILE_WRITE);
        for (long c0 = 0; c0 < m_Ticks.nTicks; c0++)
                FileWriteString(file, StringFormat("%0.f\n", m_Ticks.Info[c0].last));
        FileClose(file);
        ArrayFree(tick);

        return false;
#endif
                                        }
                                        FileClose(file);
                                        ArrayFree(tick);

                                        return (!_StopFlag);
                                }

                                return false;
                        }
One detail that may be interesting to less experienced programmers is whether the simulator will always perform the same type of movement simulation within a 1 minute bar. In fact, NO. We will try to create a way where each bar is unique and has unique movement. However, if you want the movement between bars to always be the same, or at least similar, you simply need to set the system to always start simulation from a certain value. This can be done by adding a call before the simulator call and setting a fixed value in this call, as shown below:
// ... Code ...

                                if (OpenFileBars(file, szFileNameCSV))
                                {
                                        Print("Converting bars to ticks. Please wait...");
                                        ArrayResize(m_Ticks.Info, def_MaxSizeArray, def_MaxSizeArray);
                                        ArrayResize(tick, def_MaxSizeArray);
                                        while ((!FileIsEnding(file)) && (!_StopFlag))
                                        {
                                                FileReadBars(file, rate);
                                                srand(5);
                                                Simulation(rate[0], tick);

// ... The rest of the code...
But let's go back to our source code. Since we will have a definition in the service file, when the execution reaches a given point, we will create a specific file in the service that will contain all the elements present in the tick array, which in this case is a dummy array. This will happen regardless of what happens inside the simulation function. We can use EXCEL to graphically check what's going on. Note that in this case, we will receive an error message from the service. This error message should be ignored if a check definition is present. Another important thing to know is that we will use EXCEL because it is easier to create a graph. We could even use MetaTrader 5 to do this but the result will be confusing given the amount of information generated. So, it is simpler to visualize it in EXCEL. You can use any other program to generate a graph. What's important is that you can generate and visualize the graph generated by the simulator. If you don't know how to do this in EXCEL, you can watch the video below where I show it.
It is very important that you know how to create a graph as you will need some way to check if the movement is being created correctly. Simply observing the movement of the bars being created will not be enough to determine whether it really has the appropriate level of randomness. Another very common point among programmers is that trying to complicate the calculations performed within the simulation procedure does not guarantee that we actually have a truly random movement like a RANDOM WALK. Watch the video above. It is short and can help you a lot in the next stages. I will show the chart, and we need to understand why it looks like exactly like this. This will allow you to perform local checks.
Conclusion
To keep things simple and not to confuse you, dear reader, about what we will see in the implementation of the RANDOM WALK model, I am going to end this article at this point. In the next article, we will implement a RANDOM WALK model in which the generated graph will look different. We'll also see the problems caused by this "random walk" and the idea behind it. But since we already have something that is new for many and quite complex for others, I don't want to complicate things further, even though the attached code will tell you things that I won't explain until the next article.
Do not hurry. You should first study and understand what has been explained today. Because without this knowledge and its correct understanding, we will not be able to learn anything of what will be done in the near future.
One more detail: to build the service and make the replay/simulation system work without generating data for graph analysis, disable the testing directive, as shown in the code below. Here I mean the service file.
//#define def_TEST_SIMULATION // <<-- Leave this line as it is to be able to use the replay/simulation service....
#ifdef def_TEST_SIMULATION
        #define def_FILE_OUT_SIMULATION "Info.csv"
#endif
//+------------------------------------------------------------------+
#property service
#property icon "\\Images\\Market Replay\\Icon.ico"
#property copyright "Daniel Jose"
#property version   "1.13"
If you don't do the above thing, the service will always report an error when you try to view more data in addition to the chart. So pay attention to this.
Translated from Portuguese by MetaQuotes Ltd.
Original article: https://www.mql5.com/pt/articles/11034
 Combinatorially Symmetric Cross Validation In MQL5
- Free trading apps
- Over 8,000 signals for copying
- Economic news for exploring financial markets
You agree to website policy and terms of use