Automated exchange grid trading using stop pending orders on Moscow Exchange (MOEX)
Introduction
The previous article delved into a trading approach based on limit pending orders for trading on the Moscow Exchange. In this article, we will focus on using a grid trading approach on stop pending orders using stop loss and/or take profit.
The grid trading method is not described in classic books on trading, perhaps due to its relatively recent appearance.
When trading in the market, one of the simplest strategies is a grid of orders designed to "catch" the market price. Trading systems applying this method usually do not pursue the goal of finding exact entry and exit points - the task is to deploy a grid of positions with deals opening automatically.
1. Grid with stop pending orders (Buy Stop, Sell Stop)
This method is very common in the arsenal of novice traders as it does not require special knowledge regarding the foreign exchange market, and even such common things as technical or fundamental analysis. However, a successful grid strategy requires a rough knowledge of the main trend in the selected time period - up, down, or sideways price movement with a periodic return to the average value.
The general principles of constructing a grid in the market are quite simple:
- Orders are lined up one after another at an equal distance in points
- A trade direction is predetermined
-
The grid is set to a specific range
The grid is characterized by the following parameters:
- grid width
- grid step
- take profit
- stop loss
The grid width is the area covered by the placed orders. Grid step is the distance between orders. Grid width and step are calculated in points. Thus, we have reached the definition of the grid method of trading. A trading method, in which the entry into the market is carried out using many orders usually located at the same distance from each other and on both sides of the current price is called a grid.
Whatever direction the market price goes, it will still pass through the grid of positions. Profitable trades can accumulate up to a certain amount, but they can also be closed as soon as the price turns the next order placed on the grid into a market position. Placing next orders in the grid (for example, when the price moves up and triggers buy stop orders, as well as accumulates market position volumes with subsequent placing sell market orders closer to the price (updating the grid)) with subsequent small price downward rollbacks triggering sell stop orders performs the role of the so-called partial closing of the position, which is shown in Fig. 1.
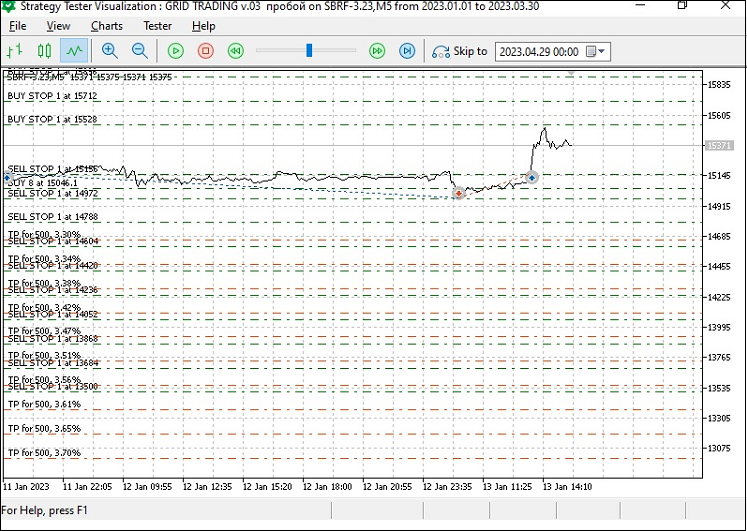
Fig. 1. Placing an order grid and triggering the orders
At the same time, the balance and equity graphs in the strategy tester looks like this (Fig. 2)
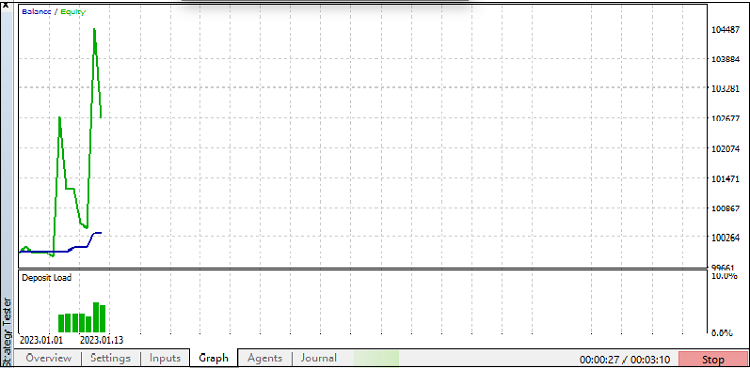
Fig. 2. Strategy tester graph
How could the idea of such an approach to trading come into existence? Presumably, the trader's thought worked in the following direction: first, the trader comprehends the process of opening one trade for a symbol and closing it either by take profit (TP) or stop loss (SL). Over time, the trader learns that it is possible to enter the market in a more sophisticated manner, namely, stepwise.
Entering the market in stages, the trader divides the entire volume of the position into several parts and determines the price levels to open trades at. These levels can be both above and below the current price, and then these entries will be called either "adding positions on a rollback" or "adding positions along a trend". Most traders like to close positions by TP, but it often happens that the price does not reach a predetermined level, at which traders have set their TP, and reverses. Traders lose part (if not all) of their accumulated profits. This fact was pretty disturbing for traders, and therefore, perhaps, some traders had the idea of a "step-by-step exit from the market" similarly to the entry.
This gave way to trading tactics, in which a trader closes part of open positions at predetermined levels. Finally, by combining the step-by-step entry with the step-by-step exit and turning it into a kind of "symmetrical system" that is independent of technical analysis (or only partially dependent on it), the trader’s thought came to the concept of grid trading. I said "symmetrical" because now the entry levels are set at the same distance from each other. The same usually goes for the exit levels.
The grid is characterized by the following parameters: grid width, grid step, TP, SL.
The grid width is the area covered by the placed orders. Grid step is the distance between orders. Grid width and step are calculated in points.
Thus, we have reached the definition of the grid trading method. A trading method, in which the entry into the market is carried out using many orders usually located at the same distance from each other (grid step) and usually on both sides of the current price is called a grid.
The significant advantage of this approach to trading is that it is now unnecessary to carry out hard (and often thankless) work of market forecasting. In fact, the grid method of trading has joined the theory of the efficient market or the theory of random walk of prices.
You may ask, why the grid type of trading can be profitable, or how we can be confident that there can be a profit (using this trading approach often involves no technical analysis).
To understand what this confidence is based on, let's look at Fig. 3 depicting the grid of stop orders and the movement of the futures contract price of PJSC Sberbank ordinary shares price.
The grid of orders in the strategy based on stop orders involves opening pending trades in the direction of a trend. If, however, stop orders are placed on both sides of the current price, then no matter which direction the trend goes, a trader will make a profit (Fig. 3 and 4 present testing an EA with a set take profit value):
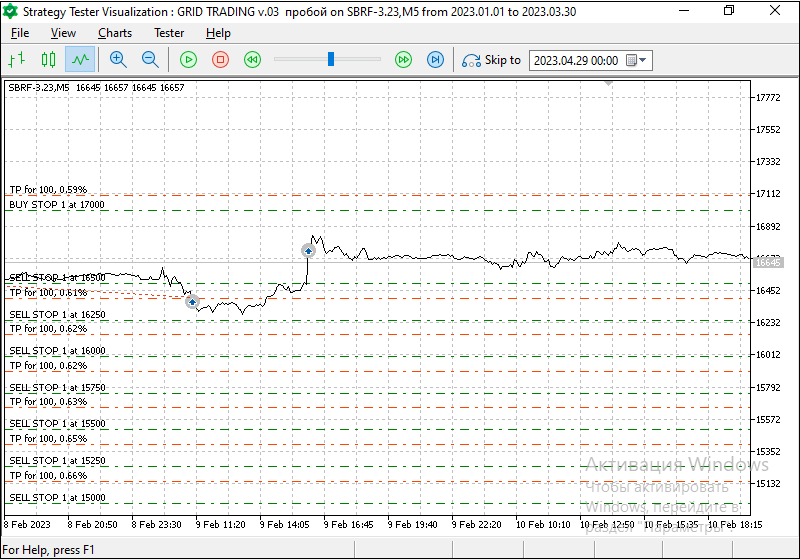
Fig. 3 The principle of grid trading profitability with a take profit less than the grid step width
When closing by take profit less than the grid step, the balance and equity graphs look as follows
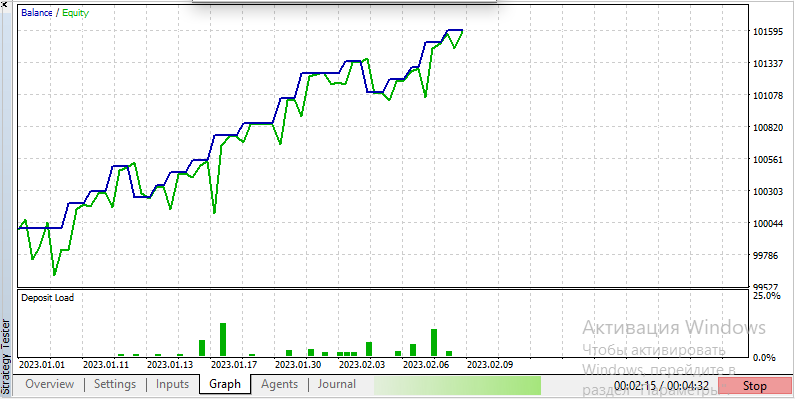
Fig. 4. Balance and equity graphs when closing by take profit
The type of this grid is based on the fact that the trader has no preference in the further direction of price movement due to the fact that he or she does not do any analysis at all or believes that further price changes, both upward and downward, are equally likely.
The grid is built from the selected level, which is close to the current price, according to the following principle:
- Buy Stop orders are placed above the selected level;
- Sell Stop orders are placed below the selected level;
The grid step is determined by the trader, but usually ranges from a few pips (above the spread) to the average daily true value of the traded symbol. This value can be determined by the Average True Range (ATR) indicator, which shows how much the price of a symbol has changed over a certain period of time (a measure of volatility). The choice of the step size determines the intensity of grid trading. Naturally, the smaller the grid step, the more aggressive it is and has an increased possible profitability. Therefore, when setting up and maintaining the grid, scripts and Expert Advisors are often used.
A stop loss in this type of grid trading approach is often not set on stop orders (visually controlled by the chart), and a take profit is also determined by the user's preferences (it is also possible to use a value smaller than the grid step).
Images 5 and 5.1 show a test with preset parameters:
- grid width 3,500 points;
- grid step 184 points;
- take profit 100 points (less than the grid step).
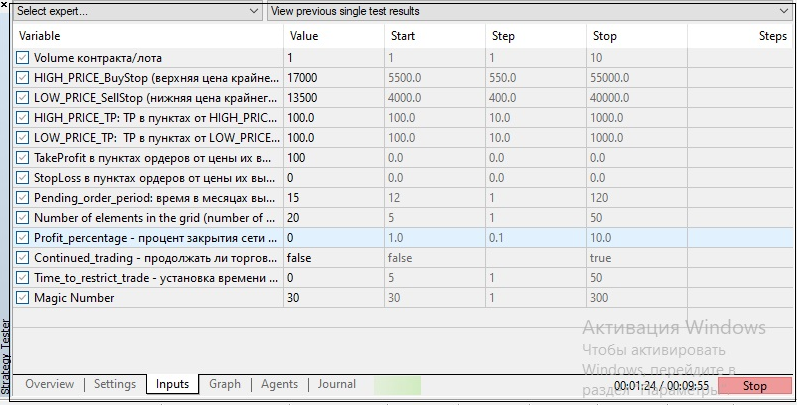
Fig. 5. Values of external variables
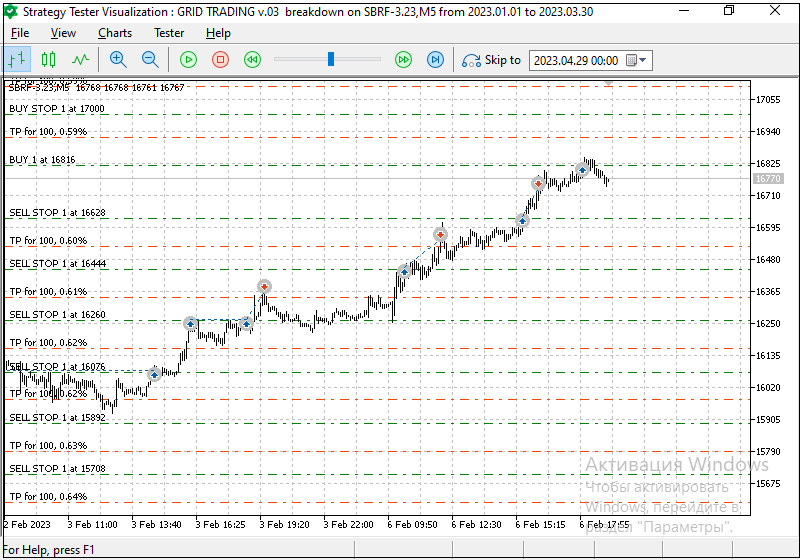
Fig. 5.1. Test with take profit of 100 points, step 184 points
In the presented grid trading approach, it is possible to adjust the grid parameters, its frequency (with a different number of orders in the external parameters of the EA) and set the upper and lower boundaries. Next, the system automatically places orders at an equal distance from each other based on the specified criteria, above and below the specific price of the traded symbol.
Using this grid trading strategy on stop orders involves the following steps:
- setting the starting grid structure. It implies defining price levels in external variables, setting and placing stop orders with a rate above and below the market rate, according to the number of stop orders specified by the user.
- opening positions. The grid is activated by a market position when the market price triggers the nearest stop order after the start (above the buy stop price, below the sell stop price).
- updating the grid. The structure is updated every time after reaching one of the set price levels within the price range specified by the user. In other words, after the next stop order is triggered, the stop order is re-placed depending on the direction of orders triggering (price movement). When the price moves down, sell stop orders are triggered, and within the price range specified by the user, additional buy stop orders are placed closer to price.
For example, the following trading principle is presented in the strategy tester - two orders on the far right (buy stop) turn into market positions after being triggered and close by take profit when the symbol price moves up. New sell stop grid orders are placed closer to the price of the tested symbol (Fig. 6):
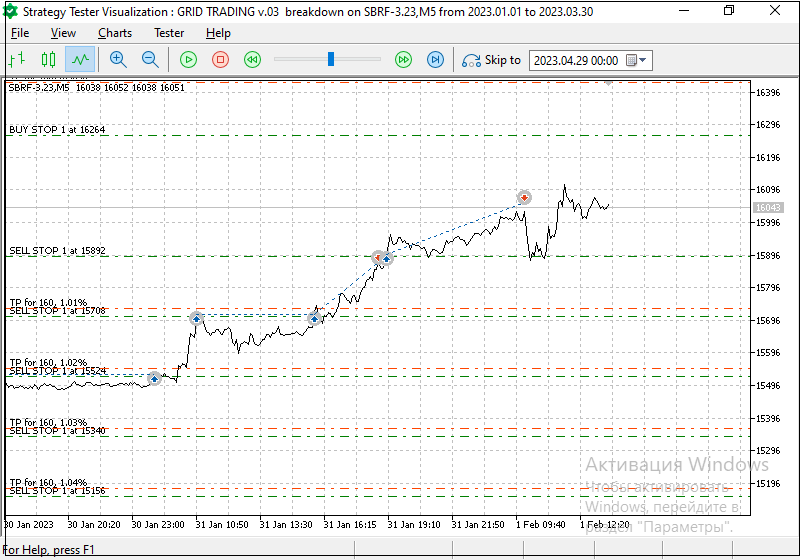
Fig. 6. The principle of triggering and placing new orders according to trading criteria
2. Using a trading strategy based on stop pending orders
Let's consider the principle of working with this type of grid. After closing deals by take profit, new orders are placed instead according to the rule:
- if the current price position is higher than the level of the closed deal, then a pending Sell Stop order is placed;
- if the current price position is lower than the level of the closed deal, then a pending Buy Stop order is placed;
As the grid functions, when the price of the symbol moves, the position is exited by take profit if the take profit is set less than the width of the grid step. This happens both with buy and sell positions. If the take profit is not set or exceeds the grid step, then with the unidirectional movement of the traded symbol, a market position is set when pending orders are triggered. The so-called unloading of the market position occurs during rollbacks from the previous main movement by an amount equal to or greater than the grid step causing opposite pending orders to trigger and increasing the account balance.
Thus, no matter in which direction the price moves, profit is obtained due to the prevalence of trading positions in the direction of the trend.
The advantage of BuyStop and Sell Stop order grids are:
- The ability to trade with minimal skills.
- Trading is always carried out in the direction of the main trend.
The disadvantage of Buy Stop and Sell Stop order grids is:
- In case of a wide flat channel, quotes can immediately activate 5-6 or more stop orders in both directions, and it will take a lot of time and resource of the trading account to get out of the drawdown.
There is no need for careful market forecasting. But in order to increase profits, it is important to consider many factors. As a rule, a good choice for this type of trading is a symbol (the traded rate of which is characterized by frequent and significant, preferably unidirectional rises or falls with no drawdowns).
Why automated grid trading is so popular:
It is convenient. You can figure it out quickly and there are no too complicated calculations that require a lot of experience.
This is effective in terms of risk management.
It is safe. The trading approach has been proven over the years and many traders practice it in a wide variety of markets.
Flexible tactic. It easily adapts to different market conditions.
Finally, grid trading is perfect for automation. It is extremely logical, has a clear structure and does not depend on the market behavior.
This is a grid trading method in which the trader must take the liberty of deciding that some trend will prevail in the traded area. The stronger the trend, the more profit the trader will receive. Stop orders are used here, which are opened in the direction of the trend, i.e. Buy Stop is opened for buying, and Sell Stop for selling. Stop orders are also used in a situation where the price has been in a range for a long time, upon exiting which, in any direction, the so-called additional loading (with stop orders co-directed to the movement) and unloading (with price rollbacks and triggering of pending orders of the opposite direction) will also occur.
For this type of grid trading, strong reverse fluctuations are unprofitable: extreme Buy Stop and Sell Stop orders may require a significant amount of funds on the account when the price returns to its original value.
3. Setting the EA parameter values and selecting trading symbols on the Moscow Exchange
In the code, part of the external variables looks like this:
//+------------------------------------------------------------------+
//|                          EXTERNAL GRID VARIABLES
//+------------------------------------------------------------------+
input int Volume = 1;                          //Contract/lot volume
input double HIGH_PRICE_BuyStop = 5500.00;     //HIGH_PRICE_BuyStop (the upper price of the last BuyStop grid order)
input double LOW_PRICE_SellStop = 4000.00;     //LOW_PRICE_SellStop (the lower price of the last SellStop grid order)
input double HIGH_PRICE_TP  = 100.00;          // HIGH_PRICE_TP: TP in points from HIGH_PRICE_BuyStop
input double LOW_PRICE_TP = 100.00;            // LOW_PRICE_TP:  TP in points from LOW_PRICE_SellStop
input double TakeProfit  = 0;                  // TakeProfit from the setting price in order points
input double StopLoss  = 0;                    // StopLoss from the setting price in order points
The figure below shows an example from the Settings tab for testing trading by an Expert Advisor in Fig. 7:
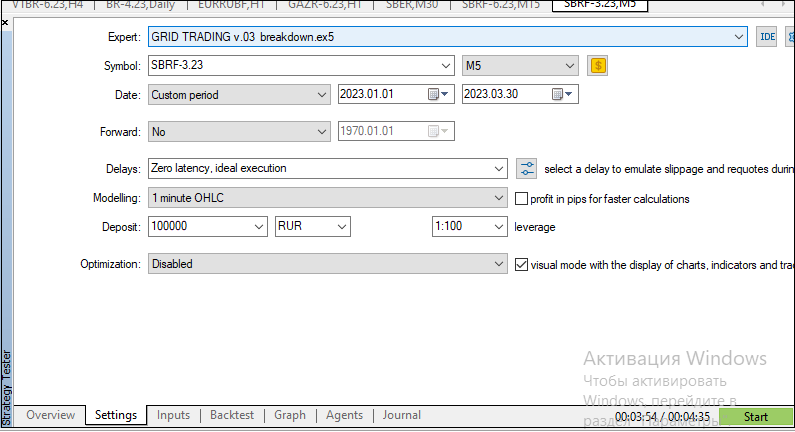
Fig. 7. Example of setting parameter values for testing
Ways to improve your trading strategy
In addition to a partial exit from the total market position by using opposite pending orders (on price rollbacks from the main movement, which is embedded in the logic of the trading system based on a grid of pending orders) or by stop losses, you can also look at the implementation of the exit through the trailing option.
For example, the Moscow Exchange offers the following options for a futures contract for ordinary shares of PJSC Sberbank (these are the assets the preliminary testing of the grid trading approach was performed on). See Fig. 8 and the link:
https://www.moex.com/en/contract.aspx?code=SBRF-6.23
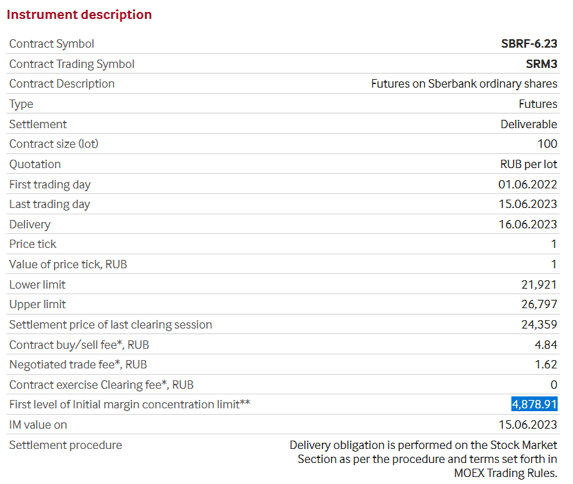
Fig. 8. Parameters of a futures contract for ordinary shares of PJSC Sberbank for placing new orders according to trading criteria
Also, when trading with the grid method, one should not forget about the calculation of the necessary and sufficient margin for the total number of orders and positions in the total volume of contracts.
Figures 9 and 9.1 demonstrate quite good unidirectional movements of futures contract for ordinary shares of PJSC VTB Bank with a relatively small value of margin.
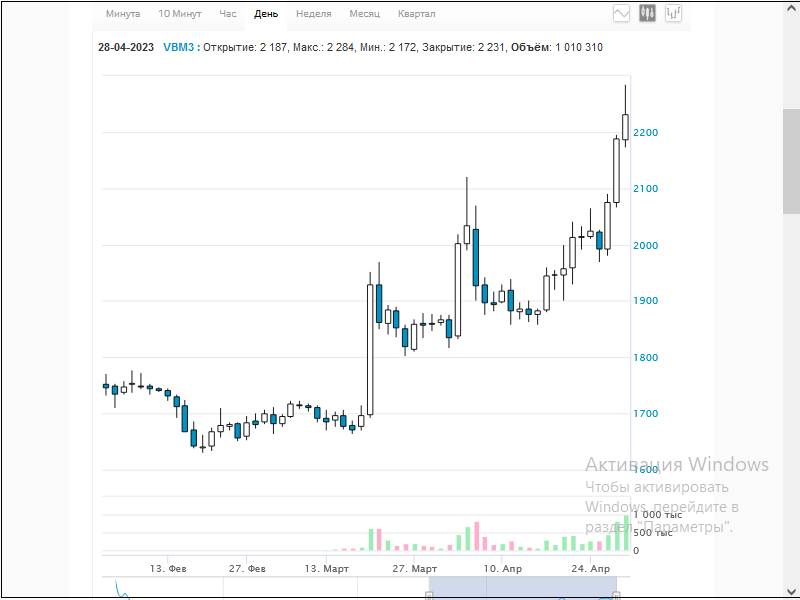
Fig. 9. Futures contract for ordinary shares of PJSC VTB Bank
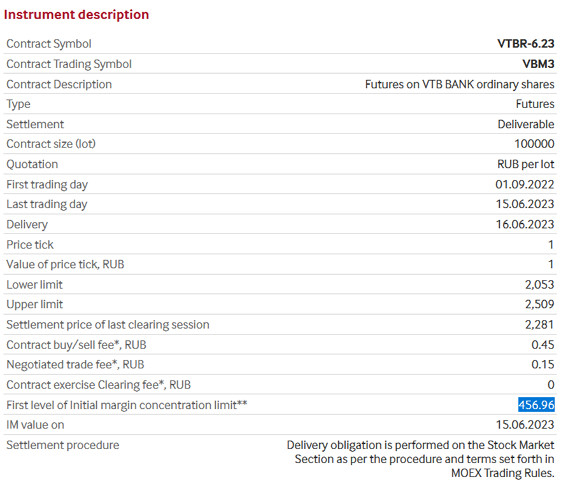
Fig. 9.1. Parameters of futures contract for ordinary shares of PJSC VTB Bank
Conclusion
In this article, we got acquainted with grid trading and types of trading orders - Buy Stop and Sell Stop. The material presented in the article implies and carries information for the user solely for educational purposes and a general understanding of the functioning and capabilities of the grid method of trading based on stop orders using the EA (attached below). I am also attaching a report on using the strategy on a futures contract for ordinary shares of PJSC Sberbank. Grid trading has capital risks, just like any other margin trading strategy.
Disclaimer: The article is not a trading recommendation. The ideas outlined in the article should only be considered as a possible trading opportunity.
Translated from Russian by MetaQuotes Ltd.
Original article: https://www.mql5.com/ru/articles/10671
 Multilayer perceptron and backpropagation algorithm (Part 3): Integration with the Strategy Tester - Overview (I).
- Free trading apps
- Over 8,000 signals for copying
- Economic news for exploring financial markets
You agree to website policy and terms of use
I'm not the author. but I'll give you my thoughts
1) The range of the price corridor is set ... which is divided by the number of levels (pending orders).
2) There is no trend ... you set a trap grid of pending limit orders ..... The trap trap has worked out, makes a profit (total on the grid) and closes the whole grid.
Although in my test robot on the basis of the presented code, I have redesigned ... closes not the entire grid only open positions, I don't see the point of generating a bunch of closed, not triggered orders at every sneeze.
3) How to solve them ... the principle of grid trading is like this ... we wait until either the price movement itself goes to the already opened positions in the desired direction or a sufficient number of positions in the opposite direction will be opened to cover the loss from unprofitable positions.
5) summarise the profit and loss on open positions ... in total if there is a set profit we exit ... although I have changed it to profit in pips instead of per cent.
6) In this robot there are no factors affecting the sideways movement ... I have added the ability to switch on or off the prohibition to set stops in the direction in which there are already open positions ... i.e. if we get into a flat, we can get two positions in different directions blocking drawdown at a certain level.
7) I, for example, do not understand the question ... the grid hangs during the whole period of trying to catch the total net profit ... the lifetime of the pending stops does not matter here ... because the price corridor is fixed ... the stop will expire in 12 months ... ... it will simply be redrawn in the same place))))) ... in the original Expert Advisor you can set the maximum time of holding positions in the hope of getting a given profit ... i.e. if it doesn't gain the set profit level, then close it at a profit greater than zero.
8) The price corridor is divided by the number of specified levels (orders) in the grid ... i.e. we set a corridor of 500 - 400 ... we have a corridor of 100 quid .... for example, if we set 10 orders, then the grid step will be 10 quid.
9) Grid trading does not involve market analysis ... grid trading ideally makes money no matter where the price moves .....
Opps. Mostly agree. I'll elaborate a bit below...
Bohdan Suvorov #:
...
7. What is the role and importance of the time factor in grid trading on stop orders? What time intervals or periods are considered when making decisions about placing pending orders and exiting positions?
...
7. Initially (based on the possible dynamics of the futures (stock) according to statistics) it is assumed that if the trend has started - it goes smoothly upwards, for example, with small pullbacks.
Therefore, it is assumed to trade in the direction of the main price movement of the symbol, regardless of its direction, taking into account the nature of the price movement in the past, it is assumed to use this trading approach from a week and above.
Naturally, with control from the side. I.e. the price has chattered in the range, some number of orders have worked - further, when the price goes beyond the boundaries of the previously selected range, you can close the position yourself, for example, in parts. In fact, the inter-day interval is traded with the transfer of the position cumulative through the night.
Timeframe for calculating the price range: min-max from a week.... month (+ is the upper boundary, - is the lower boundary).
After that, sketch a new range network of orders.
In essence, as trading is implemented here (yes - you don't buy cheaper - but more expensive), if the movement is going on - the position is gained gradually, if the pullbacks are not big and do not attract opposite orders, the equity grows faster, also allowing to gain further by stop orders the cumulative current position.
Further - also outside this robot - it is possible to exit by parts, as I have realised in practice.
1. visually on the chart. You set the range, days - weeks - above, below - levels max, min. Previously on the statistics looking at how the price has moved over the past weeks.
Immediately: For such a trading approach is desirable - directional movements....
2. "There is no trend ... a trap net of pending limit orders is placed ..... The trap trap has worked out, makes a profit (total on the grid) and closes the whole grid. " +
see on seasonality. Like - summer - flat (not now...) - on limit orders. Autumn - on stops.
3. And how to solve them ... the principle of grid trading is like this ... we wait until either the price movement itself will go to the already opened positions in the desired direction or a sufficient number of positions will be opened in the opposite direction to cover the loss from unprofitable positions.
initially put orders based on the size of the balance, taking into account MM and possible triggering of several multidirectional orders, such as their "tipping" in the range ...
4. The problem of drawdowns and risks is solved by "not roughing up" orders by volume in the grid.
5. + you close in profit. And further already on the statistics of symbol movement - see the range of min and max prices to set the next network of orders.
6. The essence of trading on stop orders with re-setting is reduced to the directional movement of the price of the symbol in any direction, so visually analysed the market, price movements, seasonality factor, news and when the absence of"long-term price in the range " is predicted.
...
8. + visually and statistically on the chart. Week - month up boundary, week - month down boundary. Distance between orders - depends on many factors, including greed....
used in trading the value of about one third of the daily range of futures price movement.
9. + average value of GO, the symbol's tendency to directional movements.
10. Grid trading on stop orders is a breakout "theme", i.e. breakdowns are traded, including inter-day breakdowns. It is rather suitable for (so-called "position traders", it took me a long time to remember - I don't know much about the types of traders.... :-))those who carry positions through the night, a - la mid-term... inside the day - often there are "jitters" in the range.
+ do not forget that even if a position on the directional movement has collected a network of co-directional orders and closed in plus either by you or robot by % of Dep or TR, no one prevents you from assessing the market situation (like rolling up - went out on TR, now - will roll down, and may continue to move up (like early exit)), and also to throw a network on stop orders, evaluating and setting the range: min/max price and with a distance of about 0.3 * ATR on the days between stop orders - continue to collect profit.
Initially, the idea of the article was formed while trading futures on the Moscow Exchange, often had to either buy manually when the price of the same futures of VTB Bank moved up (often in time (in parts) did not have time, immediately bought "a lot" and when at the computer) or to sell increasing the position when the price moved down, including at the expense of increasing equity of the account, at some point, based on the practice of trading, decided to put this trading approach in the code on mql5, in the form of an expert. Yes, it is not deprived of possible optimisation of the code structure, but it carries and fulfils the semantic load in full. It is embodied in the form of a trading expert for automated trading for the Moscow Exchange on stop orders with their resetting.
In my tests the timeframe is only a factor in how often a profit and close is checked .... i.e. let's say we have a short timeframe and a small timeframe, a profit will be caught ... if the timeframe is long, there is a chance that no profit will be caught and the grid will generally go backwards.
In my redesigned version I have two types of TFs set ... one is responsible for checking and closing positions for a profit ... and the second TF is responsible for maintaining the grid of pending orders.
As a result, I also removed the upper and lower limits of the price corridor as useless rubbish ... now it just maintains the minimum number of pending orders placed in each direction ... but no more than the maximum number of orders. I.e. in my case it is minimum 5 and maximum 7 ... which allows not to spam with constant placing and removal of orders and not to worry about the price corridor ... the corridor itself follows the current price
Yes. By the way, you can do it this way too ... It's like throwing a range from the ATR above and below the price and it is constant and orders constantly, until there is no exit (preferably at Takeout :-)).
The task was to describe the trading approach and its implementation in the Expert Advisor for a netting type of account.