Color Candles Identify the Major Trend
- Indicators
-
Ziheng Zhuang
 About me:a C/C++ programmer and forex trader, develop MT4/5 apps from October 2007.
Email: admin@fxmeter.com
My products: https://www.mql5.com/en/users/fxmeter/seller - Version: 4.33
- Updated: 17 May 2025
- Activations: 10
The indicator includes two parts.
Part I: Color Candles Show the Major Trend
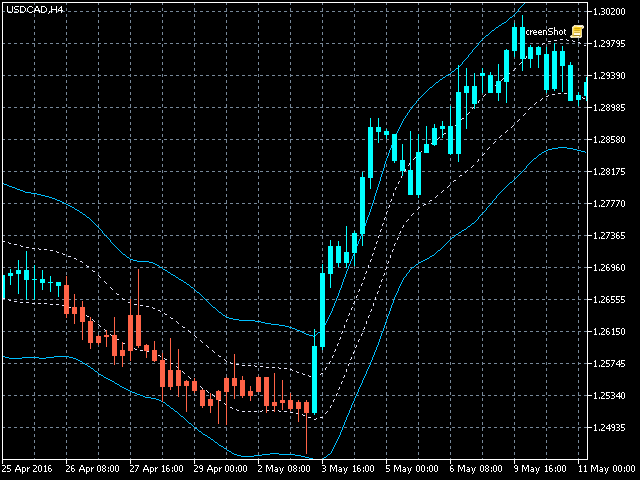
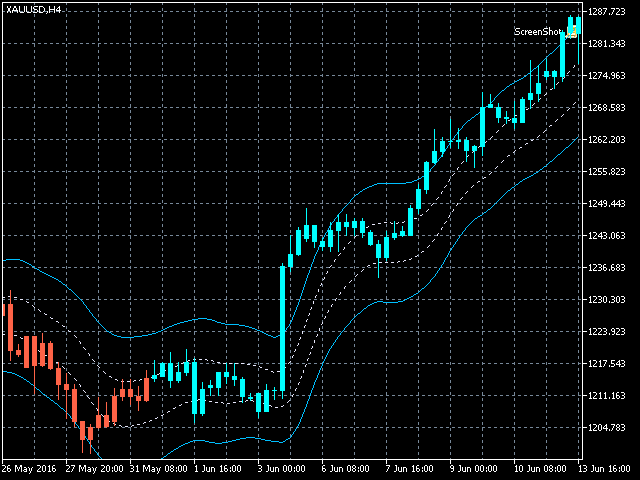
Color candles is to identify the market state by color candlesticks.
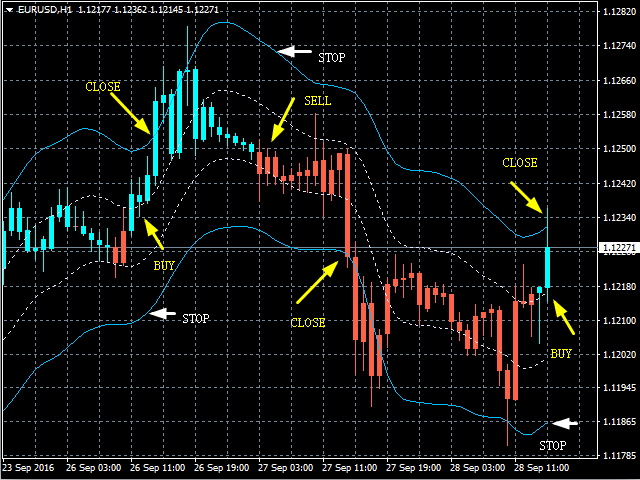
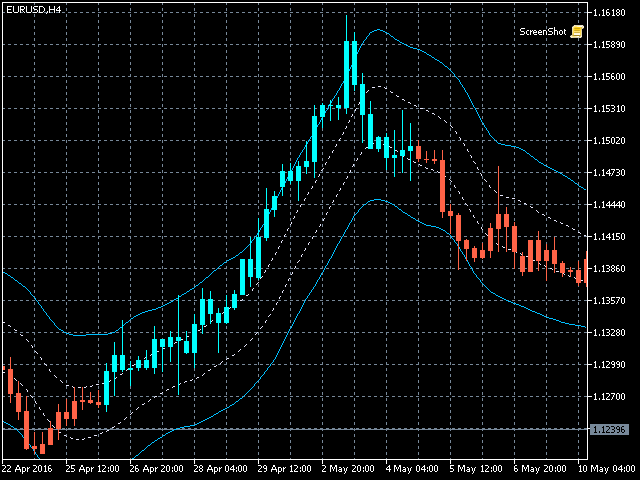
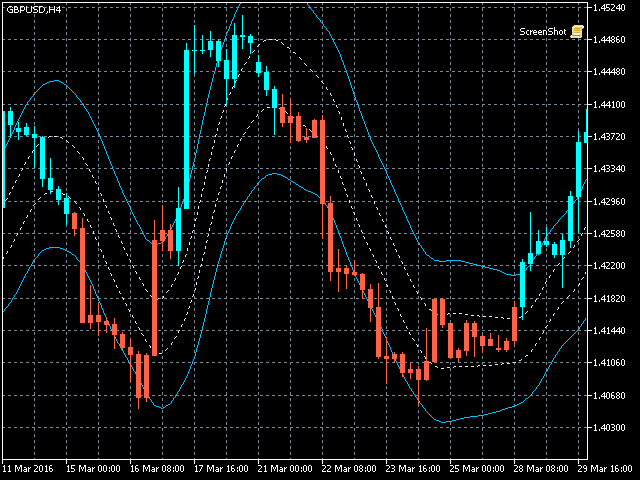
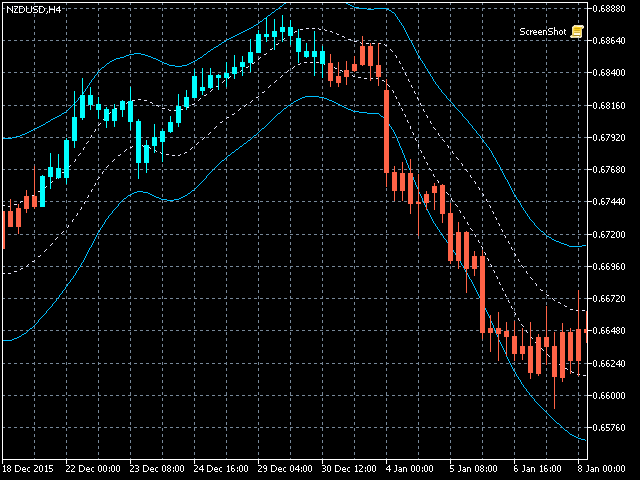
As shown in the screenshots, if the color is Aqua, the market is in a state when you should place long orders or exit short orders. If the color is Tomato, it is the time to place short orders or exit long orders.
If the color is changing, it is better to wait for its completion (until the current bar is closed).
Part II: Draw bands
The inner bands is defined as safe area, and the outer bands is for close orders.
Trading strategy as below:
- if the color is Aqua, and price is in the inner bands ,place a long order , when price cross outer bands, it is time to close order.
- if the color is Tomato, and price is in the inner bands,place a short order ,when price cross outer bands, it is time to close order.
Note: only entry market when price in the inner bands.this is very important.
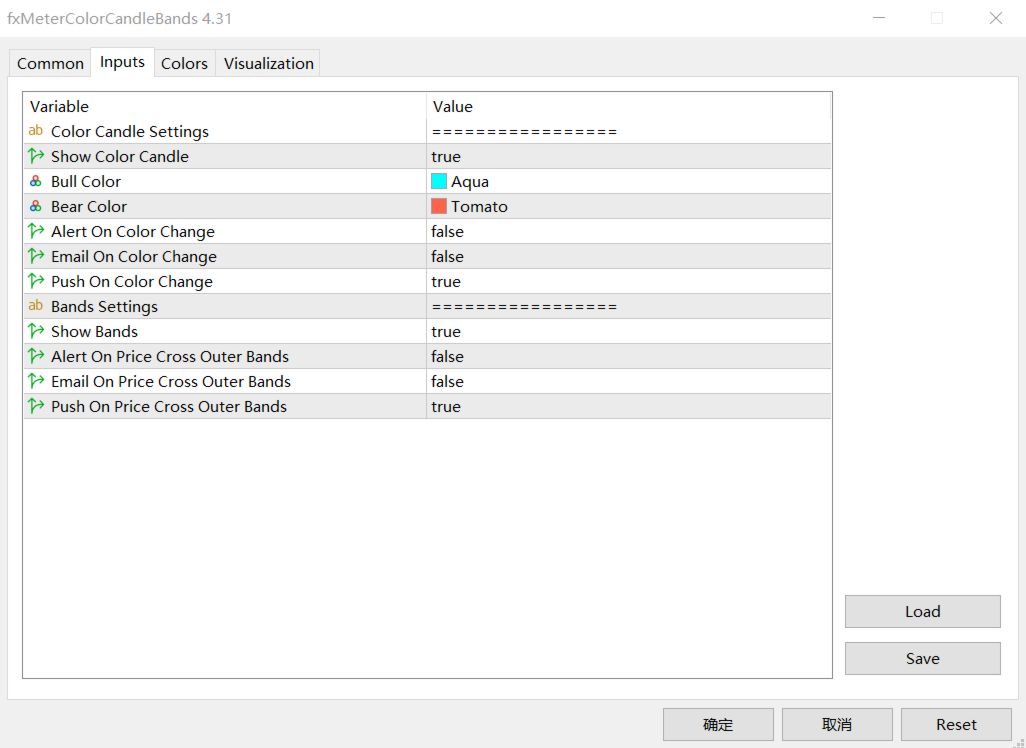
Input Parameters
- ShowColorCandle - true means indicator draw color candle.
- AlertColorChange - true means there will be alert when the color change is finished.
- EmailColorChange - true means there will be email when the color change is finished.
- ShowBands - true means indicator draw the bands
- AlertCrossOuterBands - true menns there will be alert when price cross the outer bands
- AlertCrossOuttrBands - true means there will be email when price cross the outer bands.
MT4 Version: https://www.mql5.com/en/market/product/10455

User didn't leave any comment to the rating