IceFX HeatMap
- Indicators
-
Norbert Mereg
 At Darkmoon FX you will find many useful tools developed mainly to semi automatic trading. These tools support advanced/pro forex traders with highl level of trading execution and the total control of the trades. None of these tools are the ultimate or the best solutions for everybody, but rather it
 - Version: 2.20
- Updated: 17 November 2021
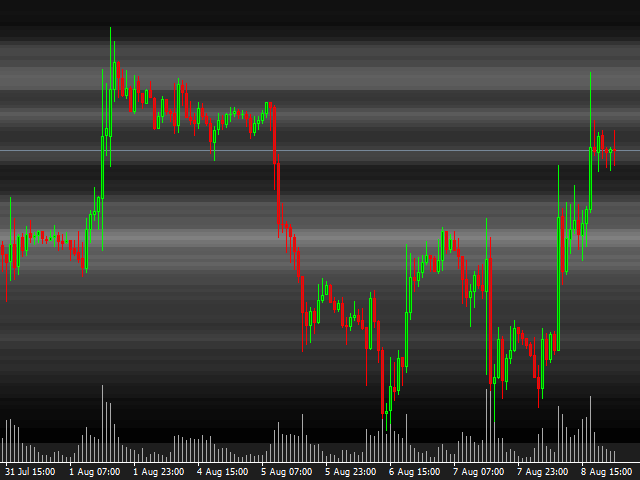
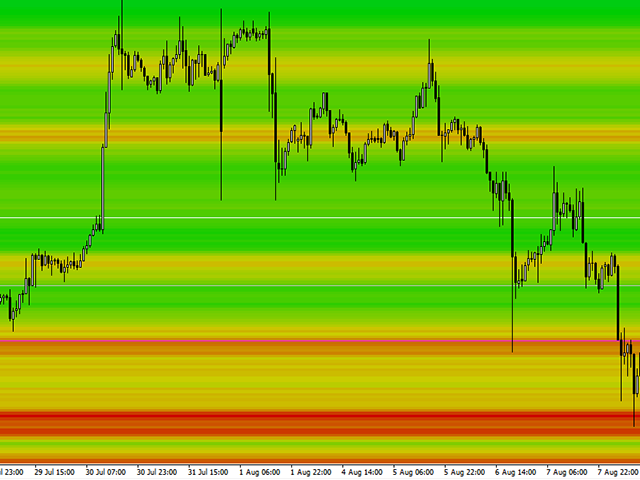
IceFX Heatmap is a special indicator that shows the places where the price has been staying and ranging over the past few days. These sites will be displayed in a "Heatmap style", with which you can clearly see the main formed bands. The main rates (where the price has "lingered/stayed" much) are indicated in bright colors (in case of black-and-white view) or red color (in case of color view).
Settings
- Days - the number of days the heat(map) is calculated for.
- Resolution - resolution rate. 10 = 1 pip. The smaller this number, the more accurate the drawing and the calculation. Therefore, more resources will be needed.
- Monochrome - black and white or color display.
- FullBackground - full or partial drawing.
- HSLS, HSLValue - HSL values for color display.























































The revealed nature of support and resistance is miraculous with this indication; my most sincere appreciation!