Смотри обучающее видео по маркету на YouTube
Как купить торгового робота или индикатор
Запусти робота на
виртуальном хостинге
виртуальном хостинге
Протестируй индикатор/робота перед покупкой
Хочешь зарабатывать в Маркете?
Как подать продукт, чтобы его покупали
Технические индикаторы для MetaTrader 5 - 5

Скользящая средняя Хала (HMA) пользуется заслуженной популярностью у трейдеров из-за эффективного сглаживания рыночных шумов и относительно небольшого запаздывания. Данная реализация индикатора для MetaTrader 5 меняет цвет при смене направления движения, может давать звуковой и текстовый сигнал. Также поддерживается отправка сообщений на электронную почту и push-сообщений на мобильные устройства. Есть возможность подачи сигнала на текущем незакрытом баре, однако этот сигнал может отмениться до з
FREE

Представляем индикатор «TW Trend Sniper» , мощный индикатор, который используется для определения основных тенденций с использованием эксклюзивной формулы индикатора «Trade Wizards», а также использования ценового действия, обнаружения валютных торговых сессий, функций Фибоначчи и обнаружения, а также методы удаления шума искусственного интеллекта с высокой точностью. эта стратегия, разработанная «группой Trade Wizards», состоящей из опытных трейдеров и опытных программистов, теперь

FOR CRASH 500 ONLY!! MT5
*This is a smooth heiken ashi setup meant to be used on CRASH 500 in combination with other indicators. *You are welcome to test it on other markets aswell. *I will be posting other indicators aswell to help with trading the crash 500 market. *You can use this to help smooth out price if you do struggle with reading the charts as is. * Just note heiken ashi doesnt represent real price action only smoothes it out for ease of read.
FREE

User Support
Paid subscribers may request to join the WTGS Workshop @DB_WTI after emailing your Twitter handle and the proof of subscription to wtg.system.international@gmail.com . The System WTGS Navigator Saturn consists of six components: TrendFinder Saturn: Internal Trending Confirmation Titan: Internal Trending Indicator Outer Ring: External Trending Indicator Inner Ring: External Trending Confirmation Data: The time-lapse of a trend on any given timeframe Disclaimers Although every

User Support
Paid subscribers may request to join the WTGS Workshop @DB_WTI after emailing your Twitter handle and the proof of subscription to wtg.system.international@gmail.com . The System WTGS Navigator Overlay consists of two components: Dynamic Butterfly Footprints Overlay Disclaimers Although every effort has been made when designing WTGS Navigator Overlay, WTG makes no warranties, expressed or implied, or representations as to the accuracy or profitability of the system. WTG assume

Этот индикатор находит и отображает фигуры технического анализа "Двойное дно" и "Двойная вершина". Сигнализирует (выводит сообщение на экран), если фигура была сформирована недавно. Часто после появления этих паттернов, тренд поворачивает обратно или происходит коррекция. Чтобы не искать их самостоятельно, или не пропустить их появления, достаточно добавить индикатор на график. Индикатор можно использовать на разных таймфреймах и валютных парах, есть настройки для лучшего поиска на определённой
FREE

Индикатор Renko Chart позволяет отображать графики "ренко" в окне индикатора. Тип графиков "ренко" показывает лишь движения цены, большие заданного (box size). Он помогает устранить шум и сосредоточиться на основных трендах.
При построении графика время не учитывается, используются лишь ценовые движения. По этой причине графики "Ренко" не похожи на графики цены.
Индикатор работает в 2 режимах: CLOSE - при построении графика "ренко" используются только цены Close; HIGH_LOW - при построении граф
FREE

Necessary for traders: tools and indicators Waves automatically calculate indicators, channel trend trading Perfect trend-wave automatic calculation channel calculation , MT4 Perfect trend-wave automatic calculation channel calculation , MT5 Local Trading copying Easy And Fast Copy , MT4 Easy And Fast Copy , MT5 Local Trading copying For DEMO Easy And Fast Copy , MT4 DEMO Easy And Fast Copy , MT5
DEMO
砖图 Renko PRO->>>
The display of the brick map on the main map.
The Renko chart ideal
FREE

Volume Weighted Average Price (VWAP) The volume weighted average price (VWAP) is a trading benchmark used by traders that gives the average price a security has traded at throughout the day, based on both volume and price. It is important because it provides traders with insight into both the trend and value of a security. This indicator VWAP V2 is free and is the manual version of the extended Easy VWAP indicator (30 Euro), where the date and time properties are automatically entered. Wit
FREE

For those who struggle with overbloated Volume Profile/Market Profile indicators, here is a solution that contains only the Point of Control (POC) information. Super-fast and reliable, the Mini POC indicator presents this vital information visually within your chart. Totally customizable in splittable timeframes, type of Volume, calculation method, and how many days back you need.
SETTINGS Timeframe to split the POCs within the day. Volume type to use: Ticks or Real Volume. Calculation method
FREE

Индикатор TimeCycleCaptor представляет собой инновационное средство для точной визуализации рыночного тренда и генерации сигналов на покупку и продажу.
Рыночный тренд играет ключевую роль в принятии торговых решений, и наш индикатор предоставляет надежный инструмент для его определения. Мы воплотили мечту трейдеров о незапаздывающих скользящих средних в нашем индикаторе.
TimeCycleCaptor способен прогнозировать будущие значения и предназначен как для определения основного тренда, так и для в

The first currency based indicator to draw a distinction between map and strength. The map shows the currencies in terms of oversold/overbought levels and gives the direction of travel. The currency strength calculates and shows the strength of that move. Alerts are included for changes in currency direction on the map (confirmed over two bars) and also when the strength reached the appropriate level. The currency map is useful for finding currency pairs to trade and in which direction. Look fo

Усовершенствованная версия бесплатного индикатора HMA Trend (для MetaTrader 4), с возможностью статистического анализа HMA Trend - трендовый индикатор, базирующийся на скользящей средней Хала (Hull Moving Average - HMA) с двумя периодами. HMA с медленным периодом определяет тренд, HMA с быстрым периодом - краткосрочные движения и сигналы в сторону тренда
Главные отличия от бесплатного варианта: Возможность предсказать вероятность разворота тренда с помощью анализа исторических данных Построени
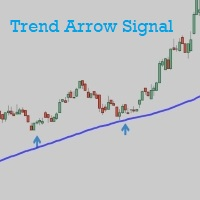
Trend Arrow Signal gives buy/sell signals and alerts with up and down arrow at potential reversal of a pullback or a trend continuation pattern. As the name indicated, this is an indicator which gives signals based on trend => It works best in trend market with the principle is to ride on the trend not trade against the trend. The main trend is determined by EMA 50 and can be changed manually to suit your preference. Trend arrow signal can work on all time frames. It gives signal at close of th
FREE

Introduction
The Bounce Zone indicator is a cutting-edge non-repainting technical tool built to identify key areas on the price chart where market sentiment is likely to cause a significant price reversal. Using advanced algorithms and historical price data analysis, this indicator pinpoints potential bounce zones. Combined with other entry signal, this indicator can help forex traders place the best trades possible
Signal
A possible buy signal is generated when price is in the green zo
FREE
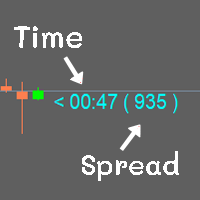
Show the time of candlesticks and spread. All data will be displayed in a rod. Can change color Can fix the size as needed
MT4 : Link https://www.mql5.com/en/market/product/102742 MT5 : Link https://www.mql5.com/en/market/product/102834
Most free code on various websites I didn't write it myself. I only do a little bit.
If you like it, please give 5 stars with it. Thank you.
FREE

Модифицированный осциллятор MACD. Классический индикатор, соединяющий в себе трендовый индикатор с осциллятором для обнаружения точек входа. Имеет мультитаймфреймовую панель, а также 3 типа уведомлений
Преимущества:
Работает на всех инструментах и таймсериях Трендовый индикатор с осциллятором для входов Мультипериодная панель на всех таймфреймах Подключаемые стрелки при появлении сигналов Три типа уведомлений: push, email, alert
MT4 версия -> ЗДЕСЬ / Наши новости -> ЗДЕСЬ
Как работат
FREE

Период низкой волатильности и нетрендового движения на финансовом рынке считается периодом бокового рынка (Sideways Market). Рано или поздно волатильность начинает расти и рынок переходит в трендовую фазу. Период бокового рынка (флет) может служить хорошим временем входа в рынок. Кроме того, боковой рынок часто означает накопление на рынке объемных ордеров крупных инвесторов. Информация о господстве на рынке флета может помочь вам определить хорошие моменты для входа в рынок и выхода из него. Тр

Сигналы снайперского входа MFI и RSI для синтетики Boom и Crash поставляются с мощными системами оповещения о входе, а для более продвинутых сигналов фильтрации рассмотрите Harmonic Hybrid Pilot Pro.При торговле шипами у вас есть три ордера, логически расположенных для распределения риска, и третий ордер, наконец, близка к самой высокой вероятности всплеска. Сигналы становятся недействительными через пятнадцать минут после окончательного ордера, и убытки должны быть закрыты немедленно. Что касае
FREE

Индикатор ищет консолидацию(флэт) на рынке в определенное время, строит коробку-канал и отмечает уровни с отступом от него на пробой. После пересечения одного из уровней индикатор отмечает зону для тейкпрофита и считает соответствующий профит или убыток в направлении данного входа на панели. Таким образом, индикатор, подстраиваясь под рынок, находит флэтовый участок с началом трендового движения для входа в него. Версия для MT4: https://www.mql5.com/ru/market/product/57466 Преимущества:
уникал
FREE

Торговля пивотами:
1.pp pivot
2. r1 r2 r3, s1 s2 s3
Necessary for traders: tools and indicators Waves automatically calculate indicators, channel trend trading Perfect trend-wave automatic calculation channel calculation , MT4 Perfect trend-wave automatic calculation channel calculation , MT5 Local Trading copying Easy And Fast Copy , MT4 Easy And Fast Copy , MT5 Local Trading copying For DEMO Easy And Fast Copy , MT4 DEMO Easy And Fast Copy , MT5 DEMO
Сотрудничество QQ: 556024 "
Со
FREE

Candle Counter - это индикатор, который печатает количество свечей от первой свечи дня. Первая свеча дня будет иметь номер 1, и каждая новая свеча будет увеличиваться на 1 в этом подсчете.
Входные параметры Выберите четное, нечетное или все Расстояние от свечи до печати числа Размер шрифта текста Цвет шрифта текста
Если у вас остались вопросы, свяжитесь со мной в прямом сообщении: https://www.mql5.com/ru/users/robsjunqueira/
FREE

The trend indicator " Super Trend Flexible Alert " has a minimum of settings. This indicator is designed to be as easy to use as possible. The indicator shows the trend with a main colored line ("SuperTrend" line, which you can see in the "Data Windows" window). Also, in places where the trend changes, the indicator shows colored arrows ( "STBuy" and " STSell" icons, which you can see in the "Data Windows" window ). In places where the trend changes, the indicator doesn't give a s
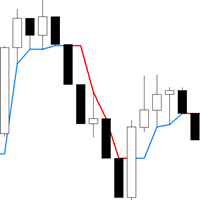
Trend following indicator to assist you in trend trading , analysis or risk management. Non Repainting and works on all timeframes. Robust alert system Benefits: Never redraws the results, the signal is strictly at the close of the candle It can be used in an adviser A great addition to a trading strategy or an independent strategy Market noise filtering algorithm Suitable for any tools Why chose for MetaTrader 5 : Enhanced Precision : Utilize accurate trend analysis to enhance your trading dec
FREE

The worktime indicator helps you identify the most important times to day to trade the currency pairs. It was created based on the ICT day trading free tutorials that are freely vailable on his youtube channel. You can use this indicator together with my other indicators that i have shared freely with you like the true day, custom periods, daily month, weekly open lines - they together complement each other very well.
Nuggets from this indicator: 1. Draws the asian session box showinng you th
FREE

The Expert Advisor for this Indicator can be found here: https://www.mql5.com/en/market/product/115445 The Break of Structure (BoS) and Change of Character indicator is a powerful tool designed to identify key turning points in price movements on financial charts. By analyzing price action, this indicator highlights instances where the market shifts from a trend to a potential reversal or consolidation phase.
Utilizing sophisticated algorithms, the indicator identifies breakouts where the str
FREE

Хотите стать постоянно прибыльным 5-звездочным трейдером Форекс? 1. Прочитайте базовое описание нашей простой торговой системы и ее масштабное обновление в 2020 году 2. Отправьте скриншот вашей покупки, чтобы получить персональное приглашение в наш эксклюзивный торговый чат .
Маяк - это удивительно точный и надежный индикатор поддержки и сопротивления.
Он отображает наиболее важные торговые уровни и рисует их в соответствии с их актуальностью.
Если уровень явно пробит, он меня
Introduction to the Candle Time Indicator The Candle Time Indicator for MetaTrader 5 (MT5), helps users know how much time on a candlestick is remaining. This is a simple but incredibly powerful and useful tool. To download the Dagangduit CandleTimer.ex5 indicator, check the bottom of this post. It’s one of the best forex time indicators in its category. The function of the indicator will not change, even if you change the name of the indicator. The candlestick countdown timer will tell you how
FREE

Это четкий индикатор для оценки максимумов и минимумов, и он хорошо работает для колеблющегося рынка.
Акционная цена 49$ → 59$
функции хорошо оценивает верх и низ Без перерисовки, без дрейфа Быстрый расчет, без задержек Богатый режим напоминания Можно настроить несколько параметров и цветов
параметр "======== Главная ========" HighLowPeriod1 = 9 HighLowPeriod2 = 60 HighLowPeriod3 = 34 HighLowEMAPeriod = 4 MASignalPeriod = 5 "======== Уведомить ========" UseAlertNotify = истина; UseMetaQuo

Fair Value Gaps (FVG) and Liquidity Voids are price ranges you can exploit for better entries and exits on your trades. They're similar concepts, so let's look at them from the top and break it down. Think of FVG and Liquidity voids as soft-spots in the market. They are paths of least resistance. That doesn't mean price will go through them, but price could go through them more easily.
To find and locate it is easy but tidiest to repeat the same thing all over again. This helps to boost your
FREE

Boom and crash Gold Miner v2 trend histogram which works in conjunction with the indicator above that has arrows as shown in the video. PLEASE Note: That the top indicator and the bottom indicator are two separate indicators. the top indicator is https://www.mql5.com/en/market/product/98066 the bottom one is free. which is the histogram at the bottom. the trend histogram trading tool that helps to easy detect the trend blue color indicates an uptrend. Orange color is a down trend.
FREE
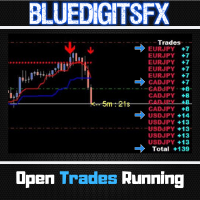
MT4 Version Available Here: https://www.mql5.com/en/market/product/43528
Telegram Channel & Group : https://t.me/bluedigitsfx
V.I.P Group Access: Send Payment Proof of any of our Paid Products to our Inbox
Recommended Broker: https://eb4.app/BDFXOsprey * The Most Sought After Pip Counter for Metatrader ! Features
Will show Currency Symbol in BLUE for Buy positions. Will show Currency Symbol in RED for Sell positions. Will Show pips in BLUE Color for Positive Pips Will Show pips in
FREE
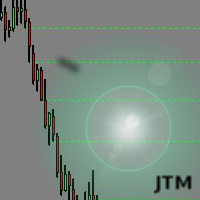
This indicator scanning thorough the history and drawing horizontal rays on all bars untested lows and highs. Fresh supply/demand zones and support/resistance levels will be marked down. It allows to be sure that certain levels is fresh and has not been tested yet. Usually after strong departure price is not retesting base immediately and leaving unfilled orders. There is no inputs, so indicator is ready to go.

Ace Supply Demand Zone Indicator The concept of supply demand relies on the quantity mismatching between buying and selling volumes in the financial market. Supply and demand zone can provide the good entry and exit. A zone is easier to trade than a line. The supply demand zone can provide the detailed trading plan and the risk management. Its ability to predict market direction is high. There are two distinctive points about Ace Supply Demand Zone Indicator. Ace Supply Demand Zone indicator was

Spike Catch Pro 22:03 release updates Advanced engine for searching trade entries in all Boom and Crash pairs (300,500 and 1000)
Programmed strategies improvements Mx_Spikes (to combine Mxd,Mxc and Mxe), Tx_Spikes, RegularSpikes, Litho_System, Dx_System, Md_System, MaCross, Omx_Entry(OP), Atx1_Spikes(OP), Oxc_Retracement (AT),M_PullBack(AT) we have added an arrow on strategy identification, this will help also in the visual manual backtesting of the included strategies and see h
FREE

With Fixed Range Volume Profile,The traces left by the big players will not go unnoticed by you.
Professional Volume Profile Indicator reveals Institutional order flow. This advanced market indicator will teach you to spot the buying and selling. Dont want to say more because its well known by most professionals trader. This Indicator : - Quickly Identify the Strongest Institutional S/R Zones. - W orks with all Trading Instruments (Forex, Futures, Indexes, Commodities, Stocks, Cryptocur

"Hunttern harmonic pattern finder" base on the dynamic zigzag with the notification and prediction mode
This version of the indicator identifies 11 harmonic patterns and predicts them in real-time before they are completely formed. It offers the ability to calculate the error rate of Zigzag patterns depending on a risk threshold. It moreover sends out a notification once the pattern is complete.
The supported patterns:
ABCD BAT ALT BAT BUTTERFLY GARTLEY CRAB DEEP CRAB CYPHER SHARK THREE
FREE

- 50% off - Telegram group : https://t.me/+5RIceImV_OJmNDA0 MT4 version : https://www.mql5.com/en/market/product/84526?source=Unknown%3Ahttps%3A%2F%2Fwww.mql5.com%2Fen%2Fmarket%2Fmy
Master Pullback is a complete system that gives unique trading opportunities and a clear indication of the market: trend, signals as well as stop loss and take profit levels. This system has been designed to be as simple as possible and detects extreme overbought and oversold zones, support and resistance levels, a

Renko is a well-known Japanese charting technique that removes time from the chart. Instead of drawing bars in constant intervals (time) as a normal chart would, a Renko chart does so only when price moves beyond a predefined amount.
In a Renko chart, a bar is created when price exceeds the previous bar’s high or low by a predefined amount or what we call the Box Size. The result is a chart with equally sized bars running up or down in 45 degree angles. Such a chart offers the following advant

Автоматический профиль объема с фиксированным диапазоном с оповещениями для MT5
Этот индикатор показывает, где цена провела больше времени, выделяя важные уровни, которые можно использовать в торговле.
и может отображать плотность цен с течением времени, выделяя наиболее важные ценовые уровни, области значения и контрольное значение данной торговой сессии. Этот индикатор можно прикрепить к таймфреймам между M1 и D1, и он будет показывать профиль рынка для дневных, недельных, месячных или да

This indicator automatically identifies demand and supply zones on a number of 1000 candles or more, and you can change that number of settings.
It also carries a high level of accuracy in describing the type of each zone, as it contains:
Weak areas .
Untested areas . Strong areas . Role-taking areas . Areas tested + number of times visited . Areas to which a return is expected, depending on the direction . The indicator contains alert zones.
For signals and more free indicators, you ca
FREE

Smart Liquidity Levels is a valuable tool for identifying optimal liquidity levels, enabling retail traders like us to strategically set our stop-loss orders. T he essential tool for traders seeking to maximize their trading success. The liquidity level is a critical component of inner circle trading (ICT). It assists us in determining when and how we should enter the market. Watch the video for detailed instructions. Here's why understanding liquidity levels is crucial in trading and how our
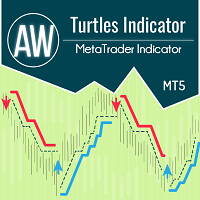
Индикатор работает по системе Черепах и классически предполагает временной интервал 20 и 55 свеч. На заданном временном интервале отслеживается тренд. Вход осуществляется в момент пробоя уровня поддержки или сопротивления. Сигнал выхода – пробой цены в обратном направлении тренда того же временного интервала. Преимущества:
Инструменты: Валютные пары, акции, сырьевые товары, индексы, криптовалюты Таймфрейм: Классически D1, также подходит для работы с любыми таймфреймами Время торговли: круглос
FREE

OBV MACD
Calculating MACD based on OBV data Features
3 outputs: MACD & Signal & Histogram 4 Colored Histogram Smoothing factor show/hide option for MACD & Signal lines Description
Among the few indicators developed for working with volume data, OBV (On Balance Volume) is the simplest yet most informative one. Its logic is straightforward: when the closing price is above the previous close, today's volume is added to the previous OBV; conversely, when the closing price is below the previous cl
FREE

The Breakout Indicator That Has Been Proven & Tested! Breakout Analyzer uses an advanced algorithm based on high probability price patterns. Each trade is analyzed on the statistics panel to help you evaluate the best breakout setups.
Bonus Strategy 1
Breakout Analyzer with Volume Critical Watch Video: (Click Here)
Bonus Strategy 2
Breakout Analyzer with Strength Meter
Watch Video: (Click Here)
Features Universal compatibility to different trading systems Analyzes statistics of breako

The indicator works to convert normal volume into levels and determine financial liquidity control points.
It is very similar in function to Fixed Volume Profile.
But it is considered more accurate and easier to use than the one found on Trading View because it calculates the full trading volumes in each candle and in all the brokers present in MetaTrade, unlike what is found in Trading View, as it only measures the broker’s displayed prices.
To follow us on social media platforms:
tel
FREE

Эта панель обнаруживает и отображает на графике зоны спроса и предложения , как в скальпинге, так и в долгосрочном режиме, в зависимости от вашей торговой стратегии для выбранных символов. Кроме того, сканерный режим панели помогает сразу проверить все нужные символы и не пропустить ни одной подходящей позиции / MT4 версия
Бесплатный индикатор: Basic Supply Demand
Особенности Позволяет просматривать торговые возможности по нескольким валютным парам , давая вам четкое и ясное п

YOU CAN NOW DOWNLOAD FREE VERSIONS OF OUR PAID INDICATORS . IT'S OUR WAY OF GIVING BACK TO THE COMMUNITY ! >>> GO HERE TO DOWNLOAD
More About Advanced Currency Meter Every good forex system has the following basic components: Ability to recognize the trend direction. Ability to identify the strength of the trend and answer the basic question Is the market trending or is it in a range? Ability to identify safe entry points that will give a perfect risk to reward (RR) ratio on every position
FREE

Свинг-трейдинг - это первый индикатор, предназначенный для обнаружения колебаний в направлении тренда и возможных разворотов. Он использует базовый подход свинговой торговли, широко описанный в торговой литературе. Индикатор изучает несколько векторов цен и времени для отслеживания направления совокупного тренда и выявляет ситуации, когда рынок перепродан или перекуплен и готов к исправлению. [ Руководство по установке | Руководство по обновлению | Устранение неполадок | FAQ | Все продукты ]

Time Session OPEN-HIGH-LOW-CLOSE This Indicator Will Draw Lines Of OHLC Levels Of Time Session Defined By User. It Will Plot Floating Lines On Current Day Chart. Time Session Can Of Current Day Or Previous Day. You Can Plot Multiple Session Lines By Giving Unique ID To Each Session. It Can Even Show Historical Levels Of Time Session Selected By User On Chart To Do Backdating Test. You Can Write Text To Describe The Lines.
FREE

Metatrader 5 version of the famous Andre Machado's Tabajara indicator. If you don't know Andre Machado's Technical Analysis work you don't need this indicator... For those who need it and for those several friend traders who asked this porting from other platforms, here it is...
FEATURES
8-period Moving Average 20-period Moving Average 50-period Moving Average 200-period Moving Average Colored candles according to the inflexion of the 20-period MA
SETTINGS You can change the Period of all M
FREE

Преимущество, которого вам не хватает, чтобы стать профессионалом. Следуйте за пошаговой системой, которая обнаруживает самые мощные прорывы!
Изучите рыночные модели, которые дают возможность получить значительную прибыль на основе проверенной и протестированной стратегии.
Воспользуйтесь своим важным преимуществом
Получите его здесь www.mql5.com/en/blogs/post/723208
Версия надежного советника
Автоматизируйте сигналы Breakout EDGE с помощью "EA Breakout EDGE" ссылка У вас есть доступ к

This is just a MACD with multi symbols, multi timeframes, and multi colors. features. different symbols and timeframes from the main chart. draw main line, signal line, and histogram. each line can be erased. the ascent and descent can be distinguished. Due to the above features, this MACD is suitable for multiple lineups in a single chart. This can be used in the same way as MiniCandles.
FREE
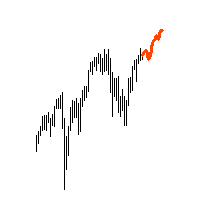
"AV Forecast MT5" is a preview or forecast indicator for MetaTrader 5, which draws forecast future price changes on the chart based on historical data. To do this, it primarily uses the everyday rhythm and the seasonality of the year. For timeframes below H1 closer dates can be selected. The lines for calculation can be made visible.
Settings:
- Draw line for x candles: draw x candles in the future
- Show all lines: yes/no
- Look back years or mixed (> H1 same): one year back or less b

The market price usually falls between the borders of the channel .
If the price is out of range , it is a trading signal or trading opportunity .
Basically , Fit Channel can be used to help determine overbought and oversold conditions in the market. When the market price is close to the upper limit, the market is considered overbought (sell zone). Conversely, when the market price is close to the bottom range, the market is considered oversold (buy zone).
However, the research can b

It is a MetaTrader 5 integrated drawing tool inspired on the "Pointofix" software. You can paint, make annotations and drawings on the chart in real time. It works in multiple timeframes, that is, the drawings can be visualized in different timeframes. The drawings are also saved in files and can be restored even on MetaTrader restarting.
Simple and Pratical
Chart Pen is designed as simple, beautiful and innovative way to create and manage all your chart analysis. There is no existing drawi

This is a conventional volume indicator, which displays the ticks or real volume (if available from your broker). But it has others features like: 5 color schemes: single, when crossing with moving average, when crossing a specific level, when having different volume between bars and when candle change color. Being hable to have a customizable moving average. Being hable to have a value indicator line. Many thanks to Diego Silvestrin for the ideas to version 1.1 and Konstantin Demidov for
FREE

KT Momentum Arrows Indicator is based on a momentary breakout which is calculated using the bands deviation and emerging volatility in a certain direction. A buy signal is generated when the price closes above the upper band and a sell signal is generated when the price closes below the lower band. A magnitude coefficient is used as the input which affects the band deviation and volatility at the same time. The coefficient value should be carefully selected and analyzed based on the instrument a

Индикатор использует несколько таймфреймов для анализа лучших входов в покупки во время бума 1000. Он предназначен для торговли только во время пиков бума. индикатор имеет две стрелки; красные и синие. появление красной стрелки указывает на то, что вы должны быть готовы к появлению синей стрелки, которая является сигналом для входа на покупку. Индикатор не предлагает точек выхода. всегда собирайте 3 пипса, т.е. если вы вошли в сделку по цене 10230,200, вы можете выйти на отметке 10260,200 со ст
FREE

non-repaint free MT5 technical indicator works on all timeframes 1 minute to the monthly timeframe the trade vision buy and sell arrow is a multi currency and synthetic indicator Trade vision buy and sell arrow comes with Push Alerts purple arrow look for selling opportunities white arrow look for buying opportunities. wait for candle to close and arrow to appear before taking any trades.
FREE

Счетчик свечей Этот индикатор подсчитывает и выводит на экран числа свечей на основе большего таймфрейма Длительный период времени Вы можете выбрать дневной таймфрейм как " Большой таймфрейм " и запустить его на любом меньшем графике. что счетчик будет считать бары на основе дневного графика . Если вы передадите в качестве параметра таймфрейм " H1 ", то индикатор будет знать, как считать бары внутри графика H1, вам просто нужно запустить его на меньшем диаграммы. Основным параметром является " Б
FREE

Панель MT5 для нескольких таймфреймов Matrix Arrow Indicator - это бесплатное дополнение и отличный актив для вашего Matrix Arrow Indicator MT5 . Он показывает текущий сигнал индикатора Matrix Arrow Indicator MT5 для 5 настраиваемых пользователем таймфреймов и всего для 16 изменяемых символов / инструментов. Пользователь имеет возможность включить / отключить любой из 10 стандартных индикаторов, из которых состоит Matrix Arrow Indicator MT5 . Все 10 стандартных атрибутов индикаторов также настр
FREE

SMCpro MT5 Original Price $440 --- Currently Price 40% OFF ( for unlimited use ) Hello World! Introducing.. SMCpro tool and Indicator for MetaTrader 5 , a cutting-edge feature designed to revolutionize your trading experience. With innovative ICT Smart Money Concept, you gain unparalleled insight into market dynamics, empowering you to make informed trading decisions like never before. Built on the foundation of advanced algorithms and real-time data analysis, SMCpro tool and Indicat

An indicator to draw a graph of account current and historical state such as Balance, Equity, Margin, Free Margin, Margin Level, Drawdown, Account Profit, Deposit and Withdrawals.
Indicator Inputs : Draw Balance Graph Draw Equity Graph Draw Margin Graph Draw Free Margin Graph Draw Margin Level Graph Draw Drawdown Graph Draw Account Profit Graph Hide Data on Chart and Buffers Connect Gaps by Lines Sign of DDs on Profit Sign of DDs on Loss
Tips : The Indicator will draw historical balance gra

Индикатор отображает линии пивот, уровни максимума, минимума и закрытия предыдущего дня, а также минимум и максимум предыдущего часа. Нужно просто установить этот индикатор на график, чтобы отобразить все эти важные линии, нет необходимости настраивать множество отдельных индикаторов.
Почему важны определенные линии Максимум и минимум предыдущего дня : эти уровни используются для торговли на дневном графике. Очень часто, если цена становится выше или ниже минимума/максимума предыдущего дня, пр
FREE

This indicator is very useful for day traders or short term traders. (MT5 version) No need to calculate the number of pips manually, just look at the chart and you will see the Virtual Take Profit / Virtual Stop Loss target line and evaluate whether the entry point is feasible to reach the intended target or not.
Enter the intended Take Profit / Stop Loss pips for your trade. The indicator will display Virtual Take Profit / Virtual Stop Loss lines for you to easily see if the target i
FREE

What is the Volume Weighted Average Price (VWAP)? The volume weighted average price (VWAP) is a trading benchmark used by traders that gives the average price an instrument has traded at throughout the day, based on both volume and price. It is important because it provides traders with insight into both the trend and value of the instrument.
What is the Difference between VWAP and AVWAP? While VWAP is having as starting point the beggining of the day,week,month etc. in the AVWAP you can p

Индикатор Accurate Gold - это удобный инструмент, который интуитивно понятен и прост в использовании, независимо от уровня опыта трейдера. Он предназначен для трейдеров, ищущих точные сигналы на временном интервале M5 на рынке золота. Этот индикатор использует передовые математические алгоритмы для анализа движения цен и динамики объема, генерируя точные сигналы на покупку и продажу. Отличительные особенности этого индикатора, включая его нерепейнтовый характер, предоставляют трейдерам ценны

(Перевод Google) Стандартное представление свечи Heikin Ashi имеет значение открытия, эквивалентное экспоненциальному показателю. Скользящее среднее (EMA) от Общей цены , из которых альфа значение EMA является фиксированным с периодом 0,5 (эквивалентно периоду EMA 3,0). В этой динамической версии период может быть изменен на любое значение, которое вы хотите использовать, что также позволяет приблизительный анализ нескольких таймфреймов или используйте минимальное или максимальное значение в кач
FREE

Закрытие предыдущего дня и смещение баров для MetaTrader! Индикатор Закрытие предыдущего дня и смещение баров - это инструмент, разработанный для улучшения технического анализа и принятия решений в торговле. С помощью этого индикатора вы получите подробную информацию о уровнях открытия, максимума, минимума и закрытия любого бара, что позволит провести точный и всесторонний анализ движения рынка. Представьте себе возможность поместить один таймфрейм в другой, позволяя детально анализировать кажды
FREE
MetaTrader Маркет - уникальная площадка по продаже роботов и технических индикаторов, не имеющая аналогов.
Памятка пользователя MQL5.community расскажет вам и о других возможностях, доступных трейдерам только у нас: копирование торговых сигналов, заказ программ для фрилансеров, автоматические расчеты через платежную систему, аренда вычислительных мощностей в MQL5 Cloud Network.
Вы упускаете торговые возможности:
- Бесплатные приложения для трейдинга
- 8 000+ сигналов для копирования
- Экономические новости для анализа финансовых рынков
Регистрация
Вход
Если у вас нет учетной записи, зарегистрируйтесь
Для авторизации и пользования сайтом MQL5.com необходимо разрешить использование файлов Сookie.
Пожалуйста, включите в вашем браузере данную настройку, иначе вы не сможете авторизоваться.